Showing posts with label r language. Show all posts

01 June 2024

Graphical Representation: Graphics We Live By (Part VIII: List of Items in Power BI)

Graphical Representation Series

Introduction

There are situations in which one needs to visualize only the rating, other values, or ranking of a list of items (e.g. shopping cart, survey items) on a scale (e.g. 1 to 100, 1 to 10) for a given dimension (e.g. country, department). Besides tables, in Power BI there are 3 main visuals that can be used for this purpose: the clustered bar chart, the line chart (aka line graph), respectively the slopegraph:

Main Display Methods

Main Display Methods

For a small list of items and dimension values probably the best choice would be to use a clustered bar chart (see A). If the chart is big enough, one can display also the values as above. However, the more items in the list, respectively values in the dimension, the more space is needed. One can maybe focus then only on a subset of items from the list (e.g. by grouping several items under a category), respectively choose which dimension values to consider. Another important downside of this method is that one needs to remember the color encodings. 

This downside applies also to the next method - the use of a line chart (see B) with categorical data, however applying labels to each line simplifies its navigation and decoding. With line charts the audience can directly see the order of the items, the local and general trends. Moreover, a line chart can better scale with the number of items and dimension values.

The third option (see C), the slopegraph, looks like a line chart though it focuses only on two dimension values (points) and categorizes the line as "down" (downward slope), "neutral" (no change) and "up" (upward slope). For this purpose, one can use parameters fields with measures. Unfortunately, the slopegraph implementation is pretty basic and the labels overlap which makes the graph more difficult to read. Probably, with the new set of changes planned by Microsoft, the use of conditional formatting of lines would allow to implement slope graphs with line charts, creating thus a mix between (B) and (C).

This is one of the cases in which the Y-axis (see B and C) could be broken and start with the meaningful values. 

Table Based Displays

Especially when combined with color encodings (see C & G) to create heatmap-like displays or sparklines (see E), tables can provide an alternative navigation of the same data. The color encodings allow to identify the areas of focus (low, average, or high values), while the sparklines allow to show inline the trends. Ideally, it should be possible to combine the two displays.  

Table Displays and the Aster Plot

One can vary the use of tables. For example, one can display only the deviations from one of the data series (see F), where the values for the other countries are based on AUS. In (G), with the help of visual calculations one can also display values' ranking. 

Pie Charts

Pie charts and their variations appear nowadays almost everywhere. The Aster plot is a variation of the pie charts in which the values are encoded in the height of the pieces. This method was considered because the data used above were encoded in 4 similar plots. Unfortunately, the settings available in Power BI are quite basic - it's not possible to use gradient colors or link the labels as below:

Source Data as Aster Plots

Sankey Diagram

A Sankey diagram is a data visualization method that emphasizes the flow or change from one state (the source) to another (the destination). In theory it could be used to map the items to the dimensions and encode the values in the width of the lines (see I). Unfortunately, the diagram becomes challenging to read because all the lines and most of the labels intersect. Probably this could be solved with more flexible formatting and a rework of the algorithm used for the display of the labels (e.g. align the labels for AUS to the left, while the ones for CAN to the right).
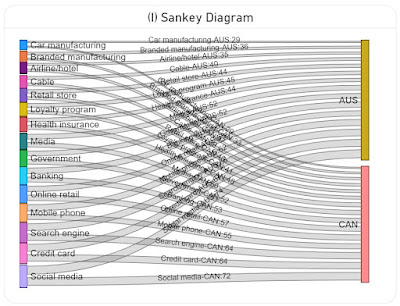
Sankey Diagram

Data Preparation

A variation of the above image with the Aster Plots which contains only the plots was used in ChatGPT to generate the basis data as a table via the following prompts:

  • retrieve the labels from the four charts by country and value in a table
  • consolidate the values in a matrix table by label country and value
The first step generated 4 tables, which were consolidated in a matrix table in the second step. Frankly, the data generated in the first step should have been enough because using the matrix table required an additional step in DAX.

Here is the data imported in Power BI as the Industries query:

let
    Source = #table({"Label","Australia","Canada","U.S.","Japan"}
, {
 {"Credit card","67","64","66","68"}
, {"Online retail","55","57","48","53"}
, {"Banking","58","53","57","48"}
, {"Mobile phone","62","55","44","48"}
, {"Social media","74","72","62","47"}
, {"Search engine","66","64","56","42"}
, {"Government","52","52","58","39"}
, {"Health insurance","44","48","50","36"}
, {"Media","52","50","39","23"}
, {"Retail store","44","40","33","23"}
, {"Car manufacturing","29","29","26","20"}
, {"Airline/hotel","35","37","29","16"}
, {"Branded manufacturing","36","33","25","16"}
, {"Loyalty program","45","41","32","12"}
, {"Cable","40","39","29","9"}
}
),
    #"Changed Types" = Table.TransformColumnTypes(Source,{{"Australia", Int64.Type}, {"Canada", Int64.Type}, {"U.S.", Number.Type}, {"Japan", Number.Type}})
in
    #"Changed Types"

Transforming (unpivoting) the matrix to a table with the values by country:

IndustriesT = UNION (
    SUMMARIZECOLUMNS(
     Industries[Label]
     , Industries[Australia]
     , "Country", "Australia"
    )
    , SUMMARIZECOLUMNS(
     Industries[Label]
     , Industries[Canada]
     , "Country", "Canada"
    )
    , SUMMARIZECOLUMNS(
     Industries[Label]
     , Industries[U.S.]
     , "Country", "U.S."
    )
    ,  SUMMARIZECOLUMNS(
     Industries[Label]
     , Industries[Japan]
     , "Country", "Japan"
    )
)

Notes:
The slopechart from MAQ Software requires several R language libraries to be installed (see how to install the R language and optionally the RStudio). Run the following scripts, then reopen Power BI Desktop and enable running visual's scripts.

install.packages("XML")
install.packages("htmlwidgets")
install.packages("ggplot2")
install.packages("plotly")

Happy (de)coding!

13 April 2024

R Language: Using the lessR Package in Microsoft Fabric's Notebooks (Test Drive)

I've started to use again the R languages for data visualizations. Discovering the lessR package, which simplifies considerably the verbose syntax of the R language by encapsulating the functionality behind simple functions, I wondered whether it can be installed in Microsoft Fabric and used from notebooks. Besides the available documentation, for learning I used also David W Berging's book on R visualizations [3].

Into a new notebook, I used one cell for each installation or package retrieval (see [1], [2]):

#installing packages
#install.packages("tidyverse") #is in Microsoft Fabric preinstalled
install.packages("lessR")

#retrieve packages from library
library("tidyverse")
library("lessR")

I attempted to read the data from a http location via the lessR Read function and it worked 

d <- Read("http://lessRstats.com/data/employee.xlsx")

head(d)

However, attempting to use any of the lessR functions used for visualization displayed only the text output and not the visualizations. No matter what I did - suppressing the text, suppressing the generation of PDF files, the result was the same. It seems to be a problem with the output device, though I'm not sure how to solve this yet. 

# supressing the text
style(quiet=TRUE)

# reenabling the text
style(quiet=FALSE)

# supressing PDF  generation
pdf(NULL)

# retrieving current device used 
options()$device

I was able to run the ggplot2 scripts from [3] though only when the lessR was also installed (each script should be run in its own cell, otherwise only the last plot is shown):

# bard charts 
ggplot(d) + geom_bar(aes(Dept)) 

# histogram
ggplot(d, aes(Salary)) + geom_histogram(binwidth=10000) 

# integrated violin/box/scatterplot
ggplot(d, aes(x="", y=Salary)) +
geom_violin(fill="gray90", bw=9500, alpha=.3) +
geom_boxplot(fill="gray75", outlier.color="black", width=0.25) +
geom_jitter(shape=16, position=position_jitter(0.05)) +
theme(axis.title.y=element_blank()) +
coord_flip()

# enhanced scatterplot 
ggplot(d, aes(Years, Salary)) + geom_point() +
geom_smooth(method=lm, color="black") +
stat_ellipse(type="norm") +
geom_vline(aes(xintercept=mean(Years, na.rm=TRUE)), color="gray70") +
geom_hline(aes(yintercept=mean(Salary), na.rm=TRUE), color="gray70")

Similar results could be obtained by using the following lessR syntax in RStudio:

# bard charts 
BarChart(Dept)

# histogram
Histogram(Salary) 

# integrated violin/box/scatterplot
Plot(Salary)

# enhanced scatterplot 
Plot(Years, Salary, enhance=TRUE)

Trying to see whether I can access the data from a lakehouse via SparkR, I've downloaded the file from the support website [3], loaded the data into an available lakehouse (e.g. UAT), respectiveley loaded the data to a new table:

-- creating the table
CREATE TABLE [dbo].[employee](
	[Name] [varchar](8000) NULL,
	[Years] [int] NULL,
	[Gender] [varchar](8000) NULL,
	[Dept] [varchar](8000) NULL,
	[Salary] [float] NULL,
	[JobSat] [varchar](8000) NULL,
	[Plan] [int] NULL,
	[Pre] [int] NULL,
	[Post] [int] NULL
) ON [PRIMARY]
GO

-- checking the data
SELECT *
FROM [dbo].[employee]

I was able to access the content of the imported file via the following script:

#access the file from lakehouse
#csv_file <- "https://onelake.dfs.fabric.microsoft.com/<file_system>/<account_name>/Files/OpenSource/employee.csv"
#csv_file <- "abfss://<file_system>.dfs.fabric.microsoft.com/<account_name>/Files/OpenSource/employee.csv"

csv_file <- "Files/OpenSource/employee.csv"

df <- read.df(csv_file, source= "csv", header = "true", inferSchema = "true")

display(df)

Initially, I wasn't able to access the table directly, though in the end I was able to retrieve the data (without and with the catalog's name):

# creating a data frame via SparkSQL
dfEmp <- sql("SELECT * FROM Employee")

head(dfEmp)

Comments:
1) Once the sessions timeout, it seems that one needs to rerun the scripts, which proves to be time-consuming as the installation takes about 5 minutes. 
2) Being able to use lessR directly in Microsoft Fabric could be a real win given its simple syntax. I run most of the tests from the book [3] plus some of the recommended scripts and the results are satisfactory. 
3) The connection via the ABFS path to the lakehouse works as well, but not via URL. 

References:
[1] Microsoft Learn - Microsoft Fabric (2023) R library management(link)
[2] lessR (2024) Data (link)
[3] David W Gerbing (2020) R Visualizations: Derive Meaning from Data
[4] CRAN=R (2024) Package lassR (link)

01 April 2024

R Language: Data Transformations (Part I: Temperatures' comparison between F° and C°)

The time series used for weather analysis use either Fahrenheit (F°) or Celsius (C°) for the temperature values. Looking at the A and B plots below that represent the values of the same dataset in F°, respectively C°, there seems to be no difference between the two plots independently on whether one works with F° or C°, however the scales are different. Once one uses the same scale for both values (see C) the plots are distorted according to the formula used for transformation.

Comments:
(1) Typically, it makes sense to adapt the temperature scale to the audience, though on the Web there will be always a mix of audiences (and that's why weather websites allow to choose one of the values). 
(2) Not starting from 0 might show in the end the same trend at same scale, though the behavior can change occasionally. As long as the Y-axis is correctly labeled, this shouldn't be a problem. Conversely, it's better to control the scale and provide the min-max values for the axis accordingly.
(3) When creating such plots, it's important to be aware of the distortion that might be introduced by transformations. For linear transformations of the type a*x+b, the value of the "a" coefficient tells how much the resulting values are stretched or contracted.

I used as exemplification the airquality dataset which contains data for 1973, the temperature being given in F°. Unfortunately, the dataset contains only the day and the month, so the date must be constructed and added to the dataset. For simplification, I've added the calculated temperature in C° as column as well:

#reviewing the data
help("airquality")

#preparing the data
head(airquality)
airquality$date <- with(airquality, as.Date(ISOdate(1973, Month, Day))) #adding the date
airquality$TempC <- with(airquality, (Temp - 32) * 5/9) #adding the temperature in C°
head(airquality)

And, here's the code used to generate the plots:

#Temperatures' comparison between F° and C°
par(mfrow = c(2,2)) #1x2 matrix display

plot(airquality$date, airquality$Temp, ylab="Temperature (F°)", xlab="date", type="l", col="blue", main="A")

plot(airquality$date, airquality$TempC, ylab="Temperature (C°)", xlab="date", type="l", col="brown", main="B")

plot(airquality$date, airquality$Temp, ylab="Temperature (F°) vs (C°)", xlab="date", ylim=c(0,100), type="l", col="blue", main="C")
lines(airquality$date, airquality$TempC, col="brown")

# using inline formula
plot(airquality$date, (airquality$Temp - 32) * 5/9, ylab="(Temp-32)*5/9", xlab="date", ylim=c(0,100), type="l", col="brown", main="D")

mtext("© sql-troubles@blogspot.com @sql_troubles, 2024", side = 1, line = 4, adj = 1, col = "dodgerblue4", cex = .7)
title("Temperatures' comparison between F° and C°", line = -1, outer = TRUE)

In the fourth plot I directly used the formula for transforming the values from F° and C°. If the values based on the formula need to be used repeatedly, it's probably better to add a column to the dataset.

Unfortunately, the standard library has its limitations when creating visualizations. While writing this post I tried to work also with the plotly library, which offers a richer set of tools and can be used to create wonderful visualizations (though it proves also more complex to use). 

install.packages("plotly")
library("plotly")

Here's the code used to plot the below graphic (the points have labels, much like in Power BI):

fig <- plot_ly(airquality, type = 'scatter', mode = 'lines+markers')%>%
  add_trace(x = ~date, y = ~Temp, name = 'Temp (F)')%>%
  add_trace(x = ~date, y = ~TempC, name = 'Temp (C)')%>%
  layout(showlegend = F, title="Temperatures' comparison between K° and C°")

fig
The temperatures via Plotly

Happy coding!

25 March 2024

R Language: Regression Analysis with Simulated & Real Data

Before doing regression on a real dataset, one can use as minimum a set of simulated data to test the steps (code adapted after [1]):

# define the model with simulated data
n <- 100
x <- c(1:n)
error <- rnorm(n,0,10)
y <- 1+2*x+error
fit <- lm(y~x)

# plotting the values
plot(x, y, ylab="1+2*x+error")
lines(x, fit$fitted.values)

#using anova (analysis of variance)
anova(fit)

In the first step is created the data model, while in the second the data are plotted, while in the third the analysis of variance is run. For the y variable, can be used any linear function that represents a line in the plane. 

rnorm() function generates multivariate normal random variates based on the parameters given, therefore the output will vary between the runs of the above code. The bigger the value of the third parameter, the more dispersed the data is.

To test the code on real data, one can use the Sleuth3 library with the data from [2] (see RPubs):

install.packages ("Sleuth3")
library("Sleuth3")

Let's look at the data from the first case, which represent an experiment concerning the effects of intrinsic and extrinsic motivation on creativity run by the psychologist Teresa Amabile (see [2]):

attach(case0101)
case0101
summary(case0101)  

The regression can be applied to all the data:

# case 0101 (all data)
x <- c(1:47)
y <- case0101$Score
fit <- lm(y~x)
plot(x, y, ylab="Score")
lines(x, fit$fitted.values)

Though, a more appropriate analysis should be based on each questionnaire:

# case 0101 (extrinsic vs intrinsic treatments)
extrinsic <- subset(case0101, Treatment %in% "Extrinsic")
intrinsic <- subset(case0101, Treatment %in% "Intrinsic")

par(mfrow = c(1,2)) #1x2 matrix display
x <- c(1:length(extrinsic$Score))
y <- extrinsic$Score
fit <- lm(y~x)
plot(x, y, ylab="Extrinsic Score")
lines(x, fit$fitted.values)

x <- c(1:length(intrinsic$Score))
y <- intrinsic$Score
fit <- lm(y~x)
plot(x, y, ylab="Intrinsic Score")
lines(x, fit$fitted.values)

title("Extrinsic vs. Intrinsic Motivation on Creativity", line = -2, outer = TRUE)

And, here's the output:

Case 0101 Extrinsic vs. Intrinsic Motivation on Creativity

Happy coding!

References:
[1] DeWayne R Derryberry (2014) Basic Data Analysis for Time Series with R 1st Ed.
[2] Fred L Ramsey & Daniel W Schafer (2013) The Statistical Sleuth: A Course in Methods of Data Analysis 3rd Ed.

19 March 2024

R Language: Drawing Function Plots (Part II - Basic Curves & Inflection Points)

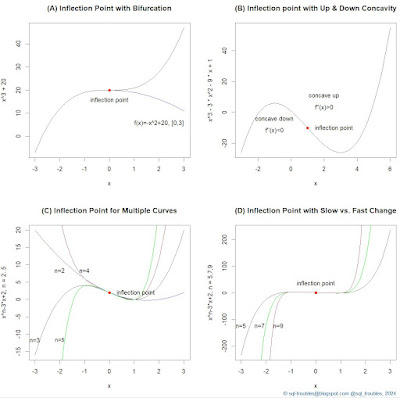
For a previous post on inflection points I needed a few examples, so I thought to write the code in the R language, which I did. Here's the final output:

Examples of Inflection Points

And, here's the code used to generate the above graphic:

par(mfrow = c(2,2)) #2x2 matrix display

# Example A: Inflection point with bifurcation
curve(x^3+20, -3,3, col = "black", main="(A) Inflection Point with Bifurcation")
curve(-x^2+20, 0, 3, add=TRUE, col="blue")
text (2, 10, "f(x)=-x^2+20, [0,3]", pos=1, offset = 1) #label inflection point
points(0, 20, col = "red", pch = 19) #inflection point 
text (0, 20, "inflection point", pos=1, offset = 1) #label inflection point


# Example B: Inflection point with Up & Down Concavity
curve(x^3-3*x^2-9*x+1, -3,6, main="(B) Inflection point with Up & Down Concavity")
points(1, -10, col = "red", pch = 19) #inflection point 
text (1, -10, "inflection point", pos=4, offset = 1) #label inflection point
text (-1, -10, "concave down", pos=3, offset = 1) 
text (-1, -10, "f''(x)<0", pos=1, offset = 0) 
text (2, 5, "concave up", pos=3, offset = 1)
text (2, 5, "f''(x)>0", pos=1, offset = 0) 


# Example C: Inflection point for multiple curves
curve(x^3-3*x+2, -3,3, col ="black", ylab="x^n-3*x+2, n = 2..5", main="(C) Inflection Point for Multiple Curves")
text (-3, -10, "n=3", pos=1) #label curve
curve(x^2-3*x+2,-3,3, add=TRUE, col="blue")
text (-2, 10, "n=2", pos=1) #label curve
curve(x^4-3*x+2,-3,3, add=TRUE, col="brown")
text (-1, 10, "n=4", pos=1) #label curve
curve(x^5-3*x+2,-3,3, add=TRUE, col="green")
text (-2, -10, "n=5", pos=1) #label curve
points(0, 2, col = "red", pch = 19) #inflection point 
text (0, 2, "inflection point", pos=4, offset = 1) #label inflection point
title("", line = -3, outer = TRUE)


# Example D: Inflection Point with fast change
curve(x^5-3*x+2,-3,3, col="black", ylab="x^n-3*x+2, n = 5,7,9", main="(D) Inflection Point with Slow vs. Fast Change")
text (-3, -100, "n=5", pos=1) #label curve
curve(x^7-3*x+2, add=TRUE, col="green")
text (-2.25, -100, "n=7", pos=1) #label curve
curve(x^9-3*x+2, add=TRUE, col="brown")
text (-1.5, -100, "n=9", pos=1) #label curve
points(0, 2, col = "red", pch = 19) #inflection point 
text (0, 2, "inflection point", pos=3, offset = 1) #label inflection point

mtext("© sql-troubles@blogspot.com @sql_troubles, 2024", side = 1, line = 4, adj = 1, col = "dodgerblue4", cex = .7)
#title("Examples of Inflection Points", line = -1, outer = TRUE)

Mathematically, an inflection point is a point on a smooth (plane) curve at which the curvature changes sign and where the second derivative is 0 [1]. The curvature intuitively measures the amount by which a curve deviates from being a straight line.

In example A, the main function has an inflection point, while the second function defined only for the interval [0,3] is used to represent a descending curve (aka bifurcation) for which the same point is a maximum point.  

In example B, the function was chosen to represent an example with a concave down (for which the second derivative is negative) and a concave up (for which the second derivative is positive) section. So what comes after an inflection point is not necessarily a monotonic increasing function. 

In example C are depicted several functions based on a varying power of the first coefficient which have the same inflection point. One could have shown only the behavior of the functions after the inflection point, while before choosing only one of the functions (see example A).

In example D is the same function as in example C with varying powers of the first coefficient considered, though for higher powers than in example C. I kept the function for n=5 to offer a basis for comparison. Apparently, the strange thing is that around the inflection point the change seems to be small and linear, which is not the case. The two graphics are correct though, because as basis is considered the scale for n=5, while in C the basis is n=3 (one scales the graphic further away from the inflection point). If one adds n=3 as the first function in the example D, the new chart will resemble C. Unfortunately, this behavior can be misused to show something like being linear around the inflection point, which is not the case. 

# Example E: Inflection Point with slow vs. fast change extended
curve(x^3-3*x+2,-3,3, col="black", ylab="x^n-3*x+2, n = 3,5,7,9", main="(E) Inflection Point with Slow vs. Fast Change")
text (-3, -10, "n=3", pos=1) #label curve
curve(x^5-3*x+2,-3,3, add=TRUE, col="brown")
text (-2, -10, "n=5", pos=1) #label curve
curve(x^7-3*x+2, add=TRUE, col="green")
text (-1.5, -10, "n=7", pos=1) #label curve
curve(x^9-3*x+2, add=TRUE, col="orange")
text (-1, -5, "n=9", pos=1) #label curve
points(0, 2, col = "red", pch = 19) #inflection point 
text (0, 2, "inflection point", pos=3, offset = 1) #label inflection point

Comments:
(1) I cheated a bit calculating the second derivative manually, which is an easy task for polynomials. There seems to be methods for calculating the inflection point, though the focus was on providing the examples. 
(2) The examples C and D could have been implemented as part of a loop, though I needed anyway to add the labels for each curve individually. Here's the modified code to support a loop:

# Example F: Inflection Point with slow vs. fast change with loop
n <- list(5,7,9)
color <- list("brown", "green", "orange")

curve(x^3-3*x+2,-3,3, col="black", ylab="x^n-3*x+2, n = 3,5,7,9", main="(F) Inflection Point with Slow vs. Fast Change")
for (i in seq_along(n))
{
ind <- as.numeric(n[i])
curve(x^ind-3*x+2,-3,3, add=TRUE, col=toString(color[i]))
}

text (-3, -10, "n=3", pos=1) #label curve
text (-2, -10, "n=5", pos=1) #label curve
text (-1, -5, "n=9", pos=1) #label curve
text (-1.5, -10, "n=7", pos=1) #label curve

Happy coding!

Previous Post <<||>> Next Post

References:
[1] Wikipedia (2023) Inflection point (link)

29 February 2024

R Language: Visualizing the Iris Dataset

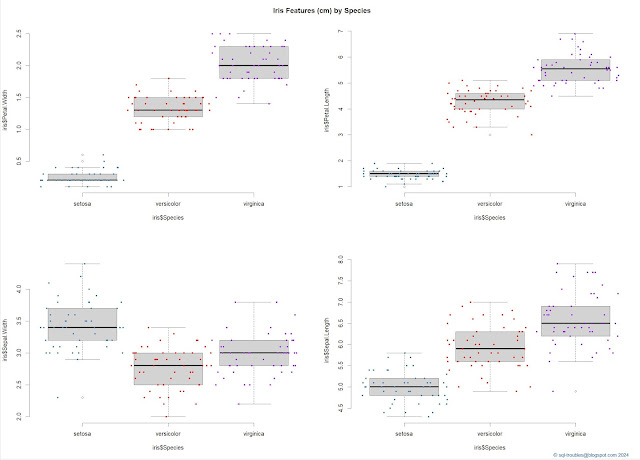
When working with a dataset that has several numeric features, it's useful to visualize it to understand the shapes of each feature, usually by category or in the case of the iris dataset by species. For this purpose one can use a combination between a boxplot and a stripchart to obtain a visualization like the one below (click on the image for a better resolution):

Iris features by species
Iris features by species (box & jitter plots combined)

And here's the code used to obtain the above visualization:

par(mfrow = c(2,2)) #2x2 matrix display

boxplot(iris$Petal.Width ~ iris$Species) 
stripchart(iris$Petal.Width ~ iris$Species
	, method = "jitter"
	, add = TRUE
	, vertical = TRUE
	, pch = 20
	, jitter = .5
	, col = c('steelblue', 'red', 'purple'))

boxplot(iris$Petal.Length ~ iris$Species) 
stripchart(iris$Petal.Length ~ iris$Species
	, method = "jitter"
	, add = TRUE
	, vertical = TRUE
	, pch = 20
	, jitter = .5
	, col = c('steelblue', 'red', 'purple'))

boxplot(iris$Sepal.Width ~ iris$Species) 
stripchart(iris$Sepal.Width ~ iris$Species
	, method = "jitter"
	, add = TRUE
	, vertical = TRUE
	, pch = 20
	, jitter = .5
	, col = c('steelblue', 'red', 'purple'))

boxplot(iris$Sepal.Length ~ iris$Species) 
stripchart(iris$Sepal.Length ~ iris$Species
	, method = "jitter"
	, add = TRUE
	, vertical = TRUE
	, pch = 20
	, jitter = .5
	, col = c('steelblue', 'red', 'purple'))

mtext("© sql-troubles@blogspot.com 2024", side = 1, line = 4, adj = 1, col = "dodgerblue4", cex = .7)
title("Iris Features (cm) by Species", line = -2, outer = TRUE)

By contrast, one can obtain a similar visualization with just a command:

plot(iris, col = c('steelblue', 'red', 'purple'), pch = 20)
title("Iris Features (cm) by Species", line = -1, outer = TRUE)
mtext("© sql-troubles@blogspot.com 2024", side = 1, line = 4, adj = 1, col = "dodgerblue4", cex = .7)

And here's the output:

Iris features by species (general plot)

One can improve the visualization by using a bigger contrast between colors (I preferred to use the same colors as in the previous visualization).

I find the first data visualization easier to understand and it provides more information about the shape of data even it requires more work.

Histograms make it easier to understand the distribution of values, though the visualizations make sense only when done by species:

Histograms of Setosa's features

And, here's the code:

par(mfrow = c(2,2)) #2x2 matrix display

setosa = subset(iris, Species == 'setosa') #focus only on setosa
hist(setosa$Sepal.Width)
hist(setosa$Sepal.Length)
hist(setosa$Petal.Width)
hist(setosa$Petal.Length)
title("Setosa's Features (cm)", line = -1, outer = TRUE)
mtext("© sql-troubles@blogspot.com 2024", side = 1, line = 4, adj = 1, col = "dodgerblue4", cex = .7)

There's however a visual called staked histogram that allows to delimit the data for each species:


Iris features by species (stacked histograms)

And, here's the code:

#installing plotrix & multcomp
install.packages("plotrix")
library(plotrix)
library(multcomp)

par(mfrow = c(2,2)) #1x2 matrix display

histStack(iris$Sepal.Width
	, z = iris$Species
	, col = c('steelblue', 'red', 'purple')
	, main = "Sepal.Width"
	, xlab = "Width"
	, legend.pos = "topright")

histStack(iris$Sepal.Length
	, z = iris$Species
	, col = c('steelblue', 'red', 'purple')
	, main = "Sepal.Length"
	, xlab = "Length"
	, legend.pos = "topright")

histStack(iris$Petal.Width
	, z = iris$Species
	, col = c('steelblue', 'red', 'purple')
	, main = "Petal.Width"
	, xlab = "Width"
	, legend.pos = "topright")

histStack(iris$Petal.Length
	, z = iris$Species
	, col = c('steelblue', 'red', 'purple')
	, main = "Petal.Length"
	, xlab = "Length"
	, legend.pos = "topright")
title("Iris Features (cm) by Species - Histograms", line = -1, outer = TRUE)
mtext("© sql-troubles@blogspot.com 2024", side = 1, line = 4, adj = 1, col = "dodgerblue4", cex = .7)

Conversely, the standard histogram allows drawing the density curves within its boundaries:

par(mfrow = c(2,2)) #1x2 matrix display 

hist(iris$Sepal.Width
	, main = "Sepal.Width"
	, xlab = "Width"
	, las = 1, cex.axis = .8, freq = F)
eq = density(iris$Sepal.Width) # estimate density curve
lines(eq, lwd = 2) # plot density curve

hist(iris$Sepal.Length
	, main = "Sepal.Length"
	, xlab = "Length"
	, las = 1, cex.axis = .8, freq = F)
eq = density(iris$Sepal.Length) # estimate density curve
lines(eq, lwd = 2) # plot density curve

hist(iris$Petal.Width
	, main = "Petal.Width"
	, xlab = "Width"
	, las = 1, cex.axis = .8, freq = F)
eq = density(iris$Petal.Width) # estimate density curve
lines(eq, lwd = 2) # plot density curve

hist(iris$Petal.Length
	, main = "Petal.Length"
	, xlab = "Length"
	, las = 1, cex.axis = .8, freq = F)
eq = density(iris$Petal.Length) # estimate density curve
lines(eq, lwd = 2) # plot density curve

title("Iris Features (cm) by Species - Density plots", line = -1, outer = TRUE)
mtext("© sql-troubles@blogspot.com 2024", side = 1, line = 4, adj = 1, col = "dodgerblue4", cex = .7)

And, here's the diagram:

Iris features aggregated (histograms with density plots)

As final visualization, one can also compare the width and length for the sepal, respectively petal:
 
par(mfrow = c(1,2)) #1x2 matrix display

plot(iris$Sepal.Width, iris$Sepal.Length, main = "Sepal Width vs Length", col = iris$Species)
plot(iris$Petal.Width, iris$Petal.Length, main = "Petal Width vs Length", col = iris$Species)

title("Iris Features (cm) by Species - Scatter Plots", line = -1, outer = TRUE)
mtext("© sql-troubles@blogspot.com 2024", side = 1, line = 4, adj = 1, col = "dodgerblue4", cex = .7)

And, here's the output:
 
Iris features by species (scatter plots)

Happy coding!

26 February 2024

R Language: Data Summaries without Using a DataFrame

Coming back to the R language after several years and trying to remember some basic functions proved to be a bit challenging, even if the syntax is quite simple. Therefore, I considered putting together a few calls as refresher based on Youden-Beale data. To run the below code you'll need to install the R language and RStudio.

In case you don't have the package installed, run the next two lines:

install.packages("ACSWR") #install the Youden-Beale Experiment package
library(ACSWR)	#load the library
 
str(yb)		#display datasets' structure

  'data.frame': 8 obs. of 2 variables:
$ Preparation_1: int  31  20  18  17  9  8 10  7
$ Preparation_2: int  18  17  14  11 10 7   5  6

yb		#display the dataset

Preparation_1 Preparation_2
1          31                  18
2          20                  17
3          18                  14
4          17                  11
5            9                  10
6            8                   7
7          10                   5
8            7                   6

summary(yb) 	#display the summary for whole dataset

Preparation_1     Preparation_2
Min. : 7.00          Min. : 5.00
1st Qu.: 8.75       1st Qu.: 6.75
Median :13.50     Median :10.50
Mean :15.00        Mean :11.00
3rd Qu.:18.50      3rd Qu.:14.75
Max. :31.00         Max. :18.00

summary(yb$Preparation_1)	#display the summary for first column

Min. 1st Qu. Median   Mean   3rd Qu.   Max.
7.00      8.75     13.50   15.00     18.50    31.00

summary(yb$Preparation_2)	#display the summary for second column

Min. 1st Qu. Median    Mean   3rd Qu.  Max.
5.00     6.75      10.50    11.00     14.75   18.00

min(yb)	#display the minimum value for the whole dataset

[1] 5

min(yb$Preparation_1)	#display the mininun of first column

[1] 7

min(yb$Preparation_2)	#display the minimum of second column

[1] 5

sum(yb)	#display the sum of all values

[1] 208

sum(yb$Preparation_1)	#display the sum of first column

[1] 120

sum(yb$Preparation_2)	#display the sum of second column

[1] 88

#display the percentiles 
quantile(yb$Preparation_1,seq(0,1,.25))

0%    25%   50%   75%   100%
7.00  8.75  13.50  18.50  31.00

#display the percentiles 
quantile(yb$Preparation_2,seq(0,1,.25))

0%   25%   50%   75%   100%
5.00  6.75 10.50  14.75   18.00

#display the percentiles 
quantile(yb$Preparation_2,seq(0,1,.25))

0%  10%  20%  30%  40%  50%  60%  70%  80%  90%  100%
7.0    7.7     8.4    9.1     9.8  13.5   17.2  17.9  19.2   23.3   31.0

quantile(yb$Preparation_2,seq(0,1,.1))

0%   10%   20%  30%   40% 50%  60% 70%  80%  90% 100%
5.0     5.7     6.4      7.3     9.4 10.5   11.6 13.7  15.8   17.3  18.0

length(yb) 	#display the number of items 
ncol(yb) 	#display the number of columns

[1] 2

sort(yb$Preparation_1) #display the sorted values ascendingly 

[1] 7 8 9 10 17 18 20 31

sort(yb$Preparation_1, decreasing = TRUE)

[1] 31 20 18 17 10 9 8 7

#display a vertical poxplot
boxplot(yb, notch=FALSE)
title("A: Vertical Boxplot for Youden-Beale Data")

#display an horizontal poxplot
boxplot(yb, horizontal = TRUE)
title("B: Horizontal Boxplot for Youden-Beale Data")


plot(yb) #scatter diagram
title("Scatter diagram")

lsfit(yb$Preparation_1, yb$Preparation_2)$coefficients #list square fit coefficients 

Intercept         X 
2.8269231 0.5448718 
 
lsfit(yb$Preparation_1, yb$Preparation_2)$residuals #list square fit residuals

[1] -1.7179487  3.2756410  1.3653846 -1.0897436  2.2692308 -0.1858974
[7] -3.2756410 -0.6410256

  Happy coding!

22 December 2019

SQL Server New Features: Using the R Language in SQL Server 2016 (Hello World & Working with Data Frames)

One of the most interesting features coming with SQL Server 2016 is the possibility to run external scripts written in the R language or Python, taking thus advantage of the numerical and statistical packages coming with the respective languages. The next examples are based on the R language.

As the scripts in R are considered as external scripts, is needed first to enable the 'external scripts enabled' configuration option by using the following script (a server restart is required):

-- enable external scripts 
sp_configure 'external scripts enabled', 1;
RECONFIGURE WITH OVERRIDE;

To makes sure that the functionality works as expected, it makes sense to attempt first a "hello world" example:

-- hello world script
EXECUTE sp_execute_external_script 
        @language = N'R',  
        @script = N'print("Hello world")'


The R language come with a few predefined datasets and for the following examples I’ll be using the mtcars dataset. Because the dataset contains several columns, I will use only the first 3. For this one care run a script as the following into the R console:


Usually it’s useful to look first at the structure of the dataset, this by using str(mtcars) command in the R console:


To return the dataset from R one can use the following call to the sp_execute_external_script stored procedure:

  -- returning the first 3 columns 
 EXEC sp_execute_external_script  
       @language = N'R'  
     , @script = N'cars <- mtcars[1:3];'
     , @input_data_1 = N''  
     , @output_data_1_name = N'cars'
     WITH RESULT SETS (("mpg" float not null 
         , "cyl" float not null 
         , "disp" float not null 
       ));  


As can be seen, besides the script is needed to define a variable in which the returning dataset is stored, as well the resulting dataset. Unfortunately, this script doesn’t return rows’ names. To do that I had to use a small trick by concatenating the initial data frame with the one resulting from row’s names. (Please let me know if you have another way of achieving the same.)

The script becomes:

 -- returning the first 3 columns including rows' name
 EXEC   sp_execute_external_script  
       @language = N'R'  
     , @script = N'cars <- data.frame(rownames(mtcars), mtcars[1:3]);'
     , @input_data_1 = N''  
     , @output_data_1_name = N'cars'
     WITH RESULT SETS (("Car" varchar(100)
      , "mpg" float not null 
      , "cyl" float not null 
      , "disp" float not null 
       ));  


To reuse the script, it can be included in a stored procedure, similarly like the examples provided by the Microsoft documentation for the sp_execute_external_script stored procedure.

A few pointers:
1. It’s useful to test your scripts first in the R console.
2. If 'external scripts enabled' was not enabled, then the following error message will appear:
Msg 39023, Level 16, State 1, Procedure sp_execute_external_script, Line 1 [Batch Start Line 22]
'sp_execute_external_script' is disabled on this instance of SQL Server. Use sp_configure 'external scripts enabled' to enable it.

3. It might be needed to start the “SQL Server Launchpad” service manually, a hint in this direction comes from the following error message:
Msg 39011, Level 16, State 1, Line 24
SQL Server was unable to communicate with the LaunchPad service. Please verify the configuration of the service.
 
4. Once the examples tested, it might be recommended to disable the 'external scripts enabled' configuration option as long is not needed anymore.
5. Check the various ways to analyse the mtcars dataset using the R language: https://rpubs.com/BillB/217355
Related Posts Plugin for WordPress, Blogger...

About Me

My photo
IT Professional with more than 24 years experience in IT in the area of full life-cycle of Web/Desktop/Database Applications Development, Software Engineering, Consultancy, Data Management, Data Quality, Data Migrations, Reporting, ERP implementations & support, Team/Project/IT Management, etc.