Showing posts with label silos. Show all posts

06 May 2024

Microsoft Fabric: The Metrics Layer [new feature]

Introduction

One of the announcements of this year's Microsoft Fabric Community first conference was the introduction of a metrics layer in Fabric which "allows organizations to create standardized business metrics, that are rooted in measures and are discoverable and intended for reuse" [1]. As it seems, the information content provided at the conference was kept to a minimum given that the feature is still in private preview, though several webcasts start to catch up on the topic (see [2], [4]). Moreover, as part of their show, the Explicit Measures (@PowerBITips) hosts had Carly Newsome as invitee, the manager of the project, who unveiled more details about the project and the feature, details which became the main source for the information below. 

The idea of a metric layer or metric store is not new, data professionals occasionally refer to their structure(s) of metrics as such. The terms gained weight in their modern conception relatively recently in 2021-2022 (see [5], [6], [7], [8], [10]). Within the modern data stack, a metrics layer or metric store is an abstraction layer available between the data store(s) and end users. It allows to centrally define, store, and manage business metrics. Thus, it allows us to standardize and enforce a single source of truth (SSoT), respectively solve several issues existing in the data stacks. As Benn Stancil earlier remarked, the metrics layer is one of the missing pieces from the modern data stack (see [10]).

Microsoft's Solution

Microsoft's business case for metrics layer's implementation is based on three main ideas (1) duplicate measures contribute to poor data quality, (2) complex data models hinder self-service, (3) reduce data silos in Power BI. In Microsoft's conception the metric layer provides several benefits: consistent definitions and descriptions, easy management via management views, searchable and discoverable metrics, respectively assure trust through indicators. 

For this feature's implementation Microsoft introduces a new Fabric Item called a metric set that allows to group several (business) metrics together as part of a mini-model that can be tailored to the needs of a subset of end-users and accessed by them via the standard tools already available. The metric set becomes thus a mini-model. Such mini-models allow to break down and reduce the overall complexity of semantic models, while being easy to evolve and consume. The challenge will become then on how to break down existing and future semantic models into nonoverlapping mini-models, creating in extremis a partition (see the Lego metaphor for data products). The idea of mini-models is not new, [12] advocating the idea of using a Master Model, a technique for creating derivative tabular models based on a single tabular solution.

A (business) metric is a way to elevate the measures from the various semantic models existing in the organization within the mini-model defined by the metric set. A metric can be reused in other fabric artifacts - currently in new reports on the Power BI service, respectively in notebooks by copying the code. Reusing metrics in other measures can mean that one can chain metrics and the changes made will be further propagated downstream. 
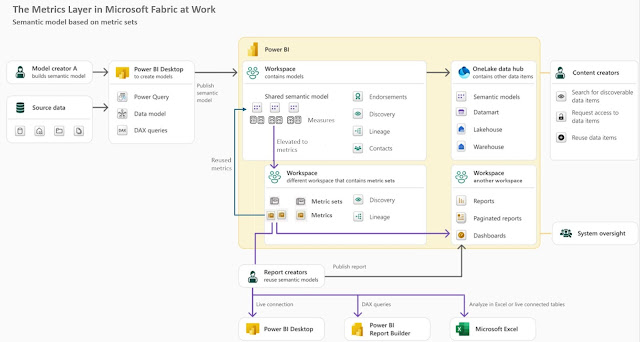
The Metrics Layer in Microsoft Fabric (adapted diagram)

Every metric is tied to the original semantic model which allows thus to track how a metric is used across the solutions and, looking forward to Purview, to identify data's lineage. A measure is related to a "table", the source from which the measure came from.

Users' Perspective

The Metrics Layer feature is available in Microsoft Fabric service for Power BI within the Metrics menu element next to Scorecards. One starts by creating a metric set in an existing workspace, an operation which creates the actual artifact, to which the individual metrics are added. To create a metric, a user with build permissions can navigate through the semantic models across different workspaces he/she has access to, pick a measure from one of them and elevate it to a metric, copying in the process its measure's definition and description. In this way the metric will always point back to the measure from the semantic model, while the metrics thus created are considered as a related collection and can be shared around accordingly. 

Once a metric is added to the metric set, one can add in edit mode dimensions to it (e.g. Date, Category, Product Id, etc.). One can then further explore a metric's output and add filters (e.g. concentrate on only one product or category) point from which one can slice-and-dice the data as needed.

There is a panel where one can see where the metric has been used (e.g. in reports, scorecards, and other integrations), when was last time refreshed, respectively how many times was used. Thus, one has the most important information in one place, which is great for developers as well as for the users. Probably, other metadata will be added, such as whether an increase in the metric would be favorable or unfavorable (like in Tableau Pulse, see [13]) or maybe levels of criticality, an unit of measure, or maybe its type - simple metric, performance indicator (PI), result indicator (RI), KPI, KRI etc.

Metrics can be persisted to the OneLake by saving their output to a delta table into the lakehouse. As demonstrated in the presentation(s), with just a copy-paste and a small piece of code one can materialize the data into a lakehouse delta table, from where the data can be reused as needed. Hopefully, the process will be further automated. 

One can consume metrics and metrics sets also in Power BI Desktop, where a new menu element called Metric sets was added under the OneLake data hub, which can be used to connect to a metric set from a Semantic model and select the metrics needed for the project. 

Tapping into the available Power BI solutions is done via an integration feature based on Sempy fabric package, a dataframe for storage and propagation of Power BI metadata which is part of the python-based semantic Link in Fabric [11].

Further Thoughts

When dealing with a new feature, a natural idea comes to mind: what challenges does the feature involve, respectively how can it be misused? Given that the metrics layer can be built within a workspace and that it can tap into the existing measures, this means that one can built on the existing infrastructure. However, this can imply restructuring, refactoring, moving, and testing a lot of code in the process, hopefully with minimal implications for the solutions already available. Whether the process is as simple as imagined is another story. As misusage, in extremis, data professionals might start building everything as metrics, though the danger might come when the data is persisted unnecessarily. 

From a data mesh's perspective, a metric set is associated with a domain, though there will be metrics and data common to multiple domains. Moreover, a mini-model has the potential of becoming a data product. Distributing the logic across multiple workspaces and domains can add further challenges, especially in what concerns the synchronization and implemented of requirements in a way that doesn't lead to bottlenecks. But this is a general challenge for the development team(s). 

The feature will probably suffer further changes until is released in public review (probably by September or the end of the year). I subscribe to other data professionals' opinion that the feature was for long needed and that can have an important impact on the solutions built. 

Previous Post <<||>> Next Post

Resources:
[1] Microsoft Fabric Blog (2024) Announcements from the Microsoft Fabric Community Conference (link)
[2] Power BI Tips (2024) Explicit Measures Ep. 236: Metrics Hub, Hot New Feature with Carly Newsome (link)
[3] Power BI Tips (2024) Introducing Fabric Metrics Layer / Power Metrics Hub [with Carly Newsome] (link)
[4] KratosBI (2024) Fabric Fridays: Metrics Layer Conspiracy Theories #40 (link)
[5] Chris Webb's BI Blog (2022) Is Power BI A Semantic Layer? (link)
[6] The Data Stack Show (2022) TDSS 95: How the Metrics Layer Bridges the Gap Between Data & Business with Nick Handel of Transform (link)
[7] Sundeep Teki (2022) The Metric Layer & how it fits into the Modern Data Stack (link)
[8] Nick Handel (2021) A brief history of the metrics store (link)
[9] Aurimas (2022) The Jungle of Metrics Layers and its Invisible Elephant (link)
[10] Benn Stancil (2021) The missing piece of the modern data stack (link)
[11] Microsoft Learn (2024) Sempy fabric Package (link)
[12] Michael Kovalsky (2019) Master Model: Creating Derivative Tabular Models (link)
[13] Christina Obry (2023) The Power of a Metrics Layer - and How Your Organization Can Benefit From It (link

25 March 2010

Business Intelligence: A Reporting Guy’s Issues

Business Intelligence
Business Intelligence Series

Introduction

For more than 6 years, between many other tasks (software development, data migrations, support), I was also the "reporting guy", taking care of ad-hoc reporting requirements, building a data warehouse and a reporting solution for the customer I worked for. 99% of the reports were based on the two ERP systems (Oracle e-Business Suite & IFS-iV) the customer had in place during this time, fact that helped me learn a lot about the data architecture of such systems, about processes, data, data quality and many other issues related to data, how to do and how not do things. In this post I just want to highlight some of the issues I was confronted with, and I don’t intend to point the finger at anybody, so I apologize if anybody is offended!

The Lack of Knowledge about the Business

Even if it’s hard to believe, the main issue was revolving around the lack of relevant documentation on applications, especially on database models and processes, or, even if there were such documents, they were not updated and the value of true of the information contained were supposed to be always checked against the data. Of course, there are always knowledge workers from whom valuable information could be elicited though they were not always available and many of them are highly specialized in their field. Therefore, one needs to interview multiple users to build a close to complete picture, and even then, one must check the newly acquired information against the data! From time to time, one may even find out that the newly acquired information doesn’t entirely match the reality, that there are always exceptions and (business) rules forgotten or not known

Sometimes, it’s easier to derive knowledge directly from the data, table structure and other developers’ experience (e.g. blogs, books, forums) rather than hunting down the knowledge workers. Things aren't that bad, despite the reengineering part, in the end one manages to get the job done, though it takes more time. Sometimes it took even 2-3 more time to accomplish a task, time for which one could found better use. However, in time, accumulating more experience, I become proactive by exploring (and mapping) the unknown "territories" in the breaks between tasks, a fact that allowed me to easier fulfill users’ reporting requests.

Oracle e-Business Suite  

During the past 3 years I have been supporting mainly Oracle e-Business Suite (EBS) users with reports and knowledge about the system, and therefore most of the issues were related to it. In addition to its metadata system implemented in system table structure, Oracle tried to build an external metadata system for its ERP system, namely Metalink (I think it was replaced last year), though there were/are still many gaps in documentation. It’s true that many such gaps derive from the customizations performed when implementing the ERP system, though I would estimate that they qualify only for 20% of the gaps and refer mainly to the Flex Fields (customer-defined fields) used for the various purposes. 

A second important issue was related to the Oracle database engine, were several bugs not patched that didn’t allowed me to use SQL ANSI 92 syntax for linking more than 6-7 tables to a parent table, fact that made me abuse of inline views to solve this issue; even if Oracle had for long a patch to address this, it wasn’t deployed by admins, maybe from well supported reasons. A third issue was related to the different naming conventions used for the same attributes from the source system, mainly a result of the fact that solutions brought from other bought vendors were integrated with a minimum of changes. A fourth issue is related to the poor UI and navigation, basic if we consider the advances made in web technologies during the past years. Conversely, given the complexity of an ERP system, it’s challenging to change the UI at this scale.

 Self-Service BI

There's the belief that everybody can write a query and/or of an ad-hoc report. It’s true that writing a query is a simple task and in theory anybody could learn to it without much of effort, though there are other aspects related to Software Engineering and Project Management, respectively related to a data professional's experience than need to be considered. There are aspects like choosing the right data source, right attributes and level of detail, design the query or solution for the best performance (eventually building an index or using database objects that allow better performance) and reuse, use adequate business rules (e.g. ignoring inactive records or special business cases), synchronize the logic with other reports otherwise two people will show the management distinct numbers, mitigate the Data Quality and Deliverables Quality issues, identify the gaps between reports, etc.

In addition, having users create personal solutions instead of using a more standardized approach is quite risky because the result is a web of such siloed solutions over which there's no control from a strategic and/or data security point of view. Conversely, the users need the possibility to analyze the data by themselves (aka self-service BI), to join data coming from multiple sources. Therefore, special focus should be given also to such requirements, though once their reporting needs have been stabilized, they should be moved, if possible, to a more standardized solution.

When multiple developers are approaching reporting requirements they should work as a team and share knowledge not only on the legacy system but also on users’ requirements, techniques used and best practices. Especially when they are dispersed all over the globe, I know it’s difficult to bring cohesion in a team, make people produce deliverables as if they were written by the same person, though not so impossible to achieve with a little effort from all the parties involved. 

Why I’m mentioning this? The problem is that the more variability is introduced in deliverables, greater the risk is to have the quality of deliverables questioned, in time leading to users not adopting a system or preferring to use one resource in the detriment of another. Moreover, must be considered also the effort needed to find the gaps between reports, to modify deliverables to expectations, etc. From this perspective is always a good idea to document at least at minimum all deliverables, detailing the scope and particularities of the respective request. I know that many believe that code is self-explanatory and needs no additional documentation, though when the basic needed documentation is not available, it's occasionally challenging to intuit the context and identify the problem, respectively why a technique or a certain level of detail was preferred, or why some constraints were used. 

Outsourcing  

Outsourcing is a hot topic these days, when in the context of the current economic crisis organizations are forced to reduce the headcount and cut costs, and thus this has inevitably touched also the reporting area. Outsourcing makes sense when the interfaces between service providers and the customers are well designed and implemented. Beyond the many benefits and issues outsourcing approaches come with, people have to consider that for a developer to create a report is needed not only knowledge about the legacy systems and tools used to extract, transform and prepare the data, but also knowledge about the business itself, about users expectations and organization’s culture, the latter two points being difficult to experience in a disconnected and distributed environment. 

Of course, even if delivering the same result and quality is possible as if the developers were onsite, in the end outsourcing implies additional iterations and overwork, the users need to be trained to specify the reporting requirements adequately or a special resource needs to be available to translate the requirements between the parties involved, lot of back-and-forth communication and all the other issues deriving from it. 

Outsourcing makes sense from a reporting perspective, though it might take time to become efficient. Anyway, the decisions for this approach are usually taken at upper management level. From a reporting guy's perspective, if I consider the amount of additional effort and time spent to deliver comparable quality, I will say "No" to an outsourcing model when the time used to build something is just shifted in managing the communication with the outsourcer, writing emails after emails for issues that could have been solved in a 10-minute meeting. Probably the time and money can be invested in other resources that better enable the process. 


Written: Mar-2010, Last Reviewed: Apr-2024
Related Posts Plugin for WordPress, Blogger...

About Me

My photo
IT Professional with more than 24 years experience in IT in the area of full life-cycle of Web/Desktop/Database Applications Development, Software Engineering, Consultancy, Data Management, Data Quality, Data Migrations, Reporting, ERP implementations & support, Team/Project/IT Management, etc.