Showing posts with label data mesh. Show all posts

10 November 2024

🏭🗒️Microsoft Fabric: Data Mesh [Notes]

Disclaimer: This is work in progress intended to consolidate information from various sources for learning purposes. For the latest information please consult the documentation (see the links below)! 

Last updated: 23-May-2024

[Microsoft Fabric] Data Mesh
  • {definition} a type of decentralized data architecture that organizes data based on different business domains [2]
    •   a centrally managed network of decentralized data products
  • {concept} landing zone
    • typically a subscription that needs to be governed by a common policy [7]
      • {downside} creating one landing zone for every project can lead to too many landing zones to manage
        • {alternative} landing zones based on a business domain [7] 
    •  resources must be managed efficiently in a way that each team is given access to only their resources [7]
      •   shared resources might be need with separate management and common access to all [7]
    • need to be linked together into a mesh
      • via peer-to-peer networks
  • {concept} connectivity hub
  • {feature} resource group
    • {definition} a container that holds related resources for an Azure solution 
    • can be associated with a data product
      • when the data product becomes obsolete, the resource group can be deleted [7]
  • {feature} subscription
    • {definition} a logical unit of Azure services that are linked to an Azure account
    • can be associated as a landing zone governed by a policy [7]
  • {feature} tenant (aka Microsoft Fabric tenantMF tenant)
    • a single instance of Fabric for an organization that is aligned with a Microsoft Entra ID
    • can contain any number of workspaces
  • {feature} workspaces
    • {definition} a collection of items that brings together different functionality in a single environment designed for collaboration
    • associated with a domain [3]
  • {feature} domains
    • {definition} a way of logically grouping together data in an organization that is relevant to a particular area or field [1]
    • some tenant-level settings for managing and governing data can be delegated to the domain level [2]
  • {feature} subdomains
    • a way for fine tuning the logical grouping data under a domain [1]
    • subdivisions of a domain
  • {concept} deployment template

References
[1] Microsoft Learn: Fabric (2023) Fabric domains (link)
[2] Establishing Data Mesh architectural pattern with Domains and OneLake on Microsoft Fabric, by Maheswaran Arunachalam (link
[3] Data mesh: A perspective on using Azure Synapse Analytics to build data products, by Amanjeet Singh (link)
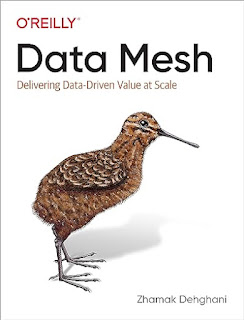
[4] Zhamak Dehghani (2021) Data Mesh: Delivering Data-Driven Value at Scale
[5] Marthe Mengen (2024) How do you set up your Data Mesh in Microsoft Fabric? (link)
[6] Administering Microsoft Fabric - Considering Data Products vs Domains vs Workspaces, by Paul Andrew (link)
[7] Aniruddha Deswandikar (2024) Engineering Data Mesh in Azure Cloud

06 May 2024

🧭🏭Business Intelligence: Microsoft Fabric (Part III: The Metrics Layer [new feature])

Introduction

One of the announcements of this year's Microsoft Fabric Community first conference was the introduction of a metrics layer in Fabric which "allows organizations to create standardized business metrics, that are rooted in measures and are discoverable and intended for reuse" [1]. As it seems, the information content provided at the conference was kept to a minimum given that the feature is still in private preview, though several webcasts start to catch up on the topic (see [2], [4]). Moreover, as part of their show, the Explicit Measures (@PowerBITips) hosts had Carly Newsome as invitee, the manager of the project, who unveiled more details about the project and the feature, details which became the main source for the information below. 

The idea of a metric layer or metric store is not new, data professionals occasionally refer to their structure(s) of metrics as such. The terms gained weight in their modern conception relatively recently in 2021-2022 (see [5], [6], [7], [8], [10]). Within the modern data stack, a metrics layer or metric store is an abstraction layer available between the data store(s) and end users. It allows to centrally define, store, and manage business metrics. Thus, it allows us to standardize and enforce a single source of truth (SSoT), respectively solve several issues existing in the data stacks. As Benn Stancil earlier remarked, the metrics layer is one of the missing pieces from the modern data stack (see [10]).

Microsoft's Solution

Microsoft's business case for metrics layer's implementation is based on three main ideas (1) duplicate measures contribute to poor data quality, (2) complex data models hinder self-service, (3) reduce data silos in Power BI. In Microsoft's conception the metric layer provides several benefits: consistent definitions and descriptions, easy management via management views, searchable and discoverable metrics, respectively assure trust through indicators. 

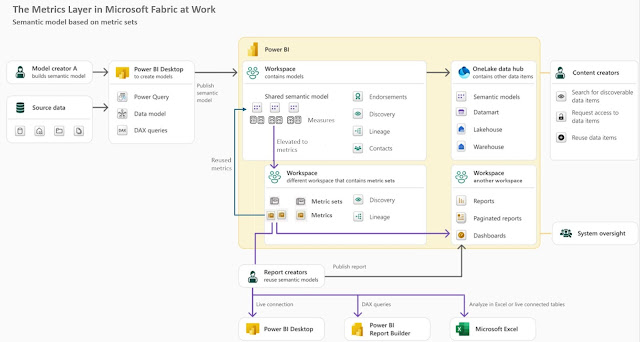
For this feature's implementation Microsoft introduces a new Fabric Item called a metric set that allows to group several (business) metrics together as part of a mini-model that can be tailored to the needs of a subset of end-users and accessed by them via the standard tools already available. The metric set becomes thus a mini-model. Such mini-models allow to break down and reduce the overall complexity of semantic models, while being easy to evolve and consume. The challenge will become then on how to break down existing and future semantic models into nonoverlapping mini-models, creating in extremis a partition (see the Lego metaphor for data products). The idea of mini-models is not new, [12] advocating the idea of using a Master Model, a technique for creating derivative tabular models based on a single tabular solution.

A (business) metric is a way to elevate the measures from the various semantic models existing in the organization within the mini-model defined by the metric set. A metric can be reused in other fabric artifacts - currently in new reports on the Power BI service, respectively in notebooks by copying the code. Reusing metrics in other measures can mean that one can chain metrics and the changes made will be further propagated downstream. 

The Metrics Layer in Microsoft Fabric (adapted diagram)

Every metric is tied to the original semantic model which allows thus to track how a metric is used across the solutions and, looking forward to Purview, to identify data's lineage. A measure is related to a "table", the source from which the measure came from.

Users' Perspective

The Metrics Layer feature is available in Microsoft Fabric service for Power BI within the Metrics menu element next to Scorecards. One starts by creating a metric set in an existing workspace, an operation which creates the actual artifact, to which the individual metrics are added. To create a metric, a user with build permissions can navigate through the semantic models across different workspaces he/she has access to, pick a measure from one of them and elevate it to a metric, copying in the process its measure's definition and description. In this way the metric will always point back to the measure from the semantic model, while the metrics thus created are considered as a related collection and can be shared around accordingly. 

Once a metric is added to the metric set, one can add in edit mode dimensions to it (e.g. Date, Category, Product Id, etc.). One can then further explore a metric's output and add filters (e.g. concentrate on only one product or category) point from which one can slice-and-dice the data as needed.

There is a panel where one can see where the metric has been used (e.g. in reports, scorecards, and other integrations), when was last time refreshed, respectively how many times was used. Thus, one has the most important information in one place, which is great for developers as well as for the users. Probably, other metadata will be added, such as whether an increase in the metric would be favorable or unfavorable (like in Tableau Pulse, see [13]) or maybe levels of criticality, an unit of measure, or maybe its type - simple metric, performance indicator (PI), result indicator (RI), KPI, KRI etc.

Metrics can be persisted to the OneLake by saving their output to a delta table into the lakehouse. As demonstrated in the presentation(s), with just a copy-paste and a small piece of code one can materialize the data into a lakehouse delta table, from where the data can be reused as needed. Hopefully, the process will be further automated. 

One can consume metrics and metrics sets also in Power BI Desktop, where a new menu element called Metric sets was added under the OneLake data hub, which can be used to connect to a metric set from a Semantic model and select the metrics needed for the project. 

Tapping into the available Power BI solutions is done via an integration feature based on Sempy fabric package, a dataframe for storage and propagation of Power BI metadata which is part of the python-based semantic Link in Fabric [11].

Further Thoughts

When dealing with a new feature, a natural idea comes to mind: what challenges does the feature involve, respectively how can it be misused? Given that the metrics layer can be built within a workspace and that it can tap into the existing measures, this means that one can built on the existing infrastructure. However, this can imply restructuring, refactoring, moving, and testing a lot of code in the process, hopefully with minimal implications for the solutions already available. Whether the process is as simple as imagined is another story. As misusage, in extremis, data professionals might start building everything as metrics, though the danger might come when the data is persisted unnecessarily. 

From a data mesh's perspective, a metric set is associated with a domain, though there will be metrics and data common to multiple domains. Moreover, a mini-model has the potential of becoming a data product. Distributing the logic across multiple workspaces and domains can add further challenges, especially in what concerns the synchronization and implemented of requirements in a way that doesn't lead to bottlenecks. But this is a general challenge for the development team(s). 

The feature will probably suffer further changes until is released in public review (probably by September or the end of the year). I subscribe to other data professionals' opinion that the feature was for long needed and that can have an important impact on the solutions built. 

Previous Post <<||>> Next Post

Resources:
[1] Microsoft Fabric Blog (2024) Announcements from the Microsoft Fabric Community Conference (link)
[2] Power BI Tips (2024) Explicit Measures Ep. 236: Metrics Hub, Hot New Feature with Carly Newsome (link)
[3] Power BI Tips (2024) Introducing Fabric Metrics Layer / Power Metrics Hub [with Carly Newsome] (link)
[4] KratosBI (2024) Fabric Fridays: Metrics Layer Conspiracy Theories #40 (link)
[5] Chris Webb's BI Blog (2022) Is Power BI A Semantic Layer? (link)
[6] The Data Stack Show (2022) TDSS 95: How the Metrics Layer Bridges the Gap Between Data & Business with Nick Handel of Transform (link)
[7] Sundeep Teki (2022) The Metric Layer & how it fits into the Modern Data Stack (link)
[8] Nick Handel (2021) A brief history of the metrics store (link)
[9] Aurimas (2022) The Jungle of Metrics Layers and its Invisible Elephant (link)
[10] Benn Stancil (2021) The missing piece of the modern data stack (link)
[11] Microsoft Learn (2024) Sempy fabric Package (link)
[12] Michael Kovalsky (2019) Master Model: Creating Derivative Tabular Models (link)
[13] Christina Obry (2023) The Power of a Metrics Layer - and How Your Organization Can Benefit From It (link
[14] KratosBI (2024) Introducing the Metrics Layer in #MicrosoftFabric with Carly Newsome [link]

03 April 2024

🧭Business Intelligence: Perspectives (Part X: The Top 5 Pains of a BI/Analytics Manager)

Business Intelligence Series

1) Business Strategy

A business strategy is supposed to define an organization's mission, vision, values, direction, purpose, goals, objectives, respectively the roadmap, alternatives, capabilities considered to achieve them. All this information is needed by the BI manager to sketch the BI strategy needed to support the business strategy. 

Without them, the BI manager must extrapolate, and one thing is to base one's decisions on a clearly stated and communicated business strategy, and another thing to work with vague declarations full of uncertainty. In the latter sense, it's like attempting to build castles into thin air and expecting to have a solid foundation. It may work as many BI requirements are common across organizations, but it can also become a disaster. 

2) BI/Data Strategy

Organizations usually differentiate between the BI and the data Strategy because different driving forces and needs are involved, even if there are common goals, needs and opportunities that must be considered from both perspectives. When there's no data strategy available, the BI manager is either forced to address thus many data-related topics (e.g. data culture, data quality, metadata management, data governance), or ignore them with all consequences deriving from this. 

A BI strategy is an extension of the business, data and IT strategies into the BI knowledge areas. Unfortunately, few organizations give it the required attention. Besides the fact that the BI strategy breaks down the business strategy from its perspective, it also adds its own goals and objectives which are ideally aligned with the ones from the other strategies. 

3) Data Culture

Data culture is "the collective beliefs, values, behaviors, and practices of an organization’s employees in harnessing the value of data for decision-making, operations, or insight". Therefore, data culture is an enabler which, when the many aspects are addressed adequately, can have a multiplier effect for the BI strategy and its execution. Conversely, when basic data culture assumptions and requirements aren't addressed, the interrelated issues resulting from this can prove to be a barrier for the BI projects, operations and strategy. 

As mentioned before, an organization’s (data) culture is created, managed, nourished, and destroyed through leadership. If the other leaders aren't playing along, each challenge related to data culture and BI will become a concern for the BI manager.

4) Managing Expectations 

A business has great expectations from the investment in its BI infrastructure, especially when the vendors promise competitive advantage, real-time access to data and insights, self-service capabilities, etc. Even if these promises are achievable, they represent a potential that needs to be harnessed and there are several premises that need to be addressed continuously. 

Some BI strategies and/or projects address these expectations from the beginning, though there are many organizations that ignore or don't give them the required importance. Unfortunately, these expectations (re)surface when people start using the infrastructure and this can easily become an acceptance issue. It's the BI manager's responsibility to ensure expectations are managed accordingly.

5) Building the Right BI Architecture

For the BI architecture the main driving forces are the shifts in technologies from single servers to distributed environments, from relational tables and data warehouses to delta tables and delta lakes built with the data mesh's principles and product-orientation in mind, which increase the overall complexity considerably. Vendors and data professionals' vision of how the architectures of the future will look like still has major milestones and challenges to surpass. 

Therefore, organizations are forced to explore the new architectures and the opportunities they bring, however this involves a considerable effort, skilled resources, and more iterations. Conversely, ignoring these trends might prove to be an opportunity lost and eventually duplicated effort on the long term.

22 March 2024

🧭Business Intelligence: Monolithic vs. Distributed Architecture (Part III: Architectural Applications)


Business Intelligence
Business Intelligence Series

Now considering the 500 houses and the skyscraper model introduced in thee previous post, which do you think will be built first? A skyscraper takes 2-10 years to build, depending on the city in which is built and the architecture characteristics. A house may take 6-12 months depending on similar factors. But one needs to build 500 houses. For sure the process can be optimized when the houses look the same, though there are many constraints one needs to consider - the number of workers, tools, and the construction material available at a given time, the volume of planning, etc. 

Within a rough estimate, it can take 2-5 years for each architecture to be built considering that on the average the advantages and disadvantages from the various areas can balance each other out. Historical data are in general needed for estimating the actual development time. One can start with a rough estimate and reevaluate the estimates up and down as more information are gathered. This usually happens in Software Engineering as well. 

Monolith vs. Distributed Architecture
Monolith vs. Distributed Architecture - 500 families

There are multiple ways in which the work can be assigned to the contractors. When the houses are split between domains, each domain can have its own contractor(s) or the contractors can be specialized by knowledge areas, or a combination of the two. Contractors’ performance should be the same, though in practice no two contractors are the same. Conversely, the chances are higher for some contractors to deliver at the expected quality. It would be useful to have worked before with the contractors and have a partnership that spans years back. There are risks on both sides, even if the risks might favor one architecture over the other, and this depends also on the quality of the contractors, designs, and planning. 

The planning must be good if not perfect to assure smooth development and each day can cost money when contractors are involved. The first planning must be done for the whole project and then split individually for each contractor and/or group of buildings. A back-and-forth check between the various plans is needed. Managing by exception can work, though it can also go terribly wrong. 

Lot of communication must occur between domains to make sure that everything fits together. Especially at the beginning, all the parties must plan together, must make sure that the rules of the games (best practices, policies, procedures, processes, methodologies) are agreed upon. Oversight (governance) needs to happen at a small scale as well on aggregate to makes sure that the rules of the game are followed. 

Now, which of the architectures do you think will fit a data warehouse (DWH)? Probably multiple voices will opt for the skyscraper, at least this is how a DWH looks from the outside. However, when one evaluates the architecture behind it, it can resemble a residential complex in which parts are bound together, but there are parts that can be distributed if needed. For example, in a DWH the HR department has its own area that's isolated from the other areas as it has higher security demands. There can be 2-3 other areas that don't share objects, and they can be distributed as well. The reasons why all infrastructure is on one machine are the costs associated with the licenses, respectively the reporting tools point to only one address. 

In data marts based DWHs, there are multiple buildings within the architecture, and thus the data marts can be distributed across a wider infrastructure, with each domain responsible for its own data mart(s). The data marts are by definition domain-dependent, and this is one of the downsides imputed to this architecture. 

Previous Post <<||>> Next Post

🧭Business Intelligence: Monolithic vs. Distributed Architecture (Part II: Architectural Choices)

Business Intelligence
Business Intelligence Series

One metaphor that can be used to understand the difference between monolith and distributed architectures, respectively between data warehouses and data mesh-based architectures as per Dehghani’s definition [1] - think that you need to accommodate 500 families (the data products to be built). There are several options: (1) build a skyscraper (developing on vertical) (2) build a complex of high buildings and develop by horizontal and vertical but finding a balance between the two; (3) to split (aka distribute) the second option and create several buildings; (4) build for each family a house, creating a village or a neighborhood. 

Monolith vs. Distributed Architecture
Monolith vs. Distributed Architecture - 500 families

(1) and (2) fit the definition of monoliths, whiles (3) and (4) are distributed architectures, though also in (3) one of the buildings can resemble a monolith if one chooses different architectures and heights for the buildings. For houses one can use a single architecture, agree on a set of predefined architectures, or have an architecture for each house, so that houses would look alike only by chance. One can also opt to have the same architecture for the buildings belonging to the same neighborhood (domain or subdomain). Moreover, the development could be split between multiple contractors that adhere to the same standards.

If the land is expensive, for example in big, overpopulated cities, when the infrastructure and the terrain allow it, one can build entirely on vertical, a skyscraper. If the land is cheap one can build a house for each family. The other architectures can be considered for everything in between.

A skyscraper is easier for externals to find (mailmen, couriers, milkmen, and other service providers) though will need a doorman to interact with them and probably a few other resources. Everybody will have the same address except the apartment number. There must be many elevators and the infrastructure must allow the flux of utilities up and down the floors, which can be challenging to achieve.

Within a village every person who needs to deliver or pick up something needs to traverse parts of the village. There are many services that need to be provided for both scenarios though the difference it will be the time that's needed to move in between addresses. In the virtual world this shouldn't matter unless one needs to inspect each house to check and/or retrieve something. The network of streets and the flux of utilities must scale with the population from the area.

A skyscraper will need materials of high quality that resist the various forces that apply on the building even in the most extreme situations. Not the same can be said about a house, which in theory needs more materials though a less solid foundation and the construction specifications are more relaxed. Moreover, a house needs smaller tools and is easier to build, unless each house has own design.

A skyscraper can host the families only when the construction is finished, and the needed certificates were approved. The same can be said about houses but the effort and time is considerably smaller, though the utilities must be also available, and they can have their own timeline.

The model is far from perfect, though it allows us to reason how changing the architecture affects various aspects. It doesn't reflect the reality because there's a big difference between the physical and virtual world. E.g., parts of the monolith can be used productively much earlier (though the core functionality might become available later), one doesn't need construction material but needs tool, the infrastructure must be available first, etc. Conversely, functional prototypes must be available beforehand, the needed skillset and a set of assumptions and other requirements must be met, etc.

Previous Post <<||>> Next Post

References:
[1] Zhamak Dehghani (2021) Data Mesh: Delivering Data-Driven Value at Scale (book review)

19 March 2024

𖣯Strategic Management: Inflection Points and the Data Mesh (Quote of the Day)

Strategic Management
Strategic Management Series

"Data mesh is what comes after an inflection point, shifting our approach, attitude, and technology toward data. Mathematically, an inflection point is a magic moment at which a curve stops bending one way and starts curving in the other direction. It’s a point that the old picture dissolves, giving way to a new one. [...] The impacts affect business agility, the ability to get value from data, and resilience to change. In the center is the inflection point, where we have a choice to make: to continue with our existing approach and, at best, reach a plateau of impact or take the data mesh approach with the promise of reaching new heights." [1]

I tried to understand the "metaphor" behind the quote. As the author through another quote pinpoints, the metaphor is borrowed from Andrew Groove:

"An inflection point occurs where the old strategic picture dissolves and gives way to the new, allowing the business to ascend to new heights. However, if you don’t navigate your way through an inflection point, you go through a peak and after the peak the business declines. [...] Put another way, a strategic inflection point is when the balance of forces shifts from the old structure, from the old ways of doing business and the old ways of competing, to the new. Before" [2]

The second part of the quote clarifies the role of the inflection point - the shift from a structure, respectively organization or system to a new one. The inflection point is not when we take a decision, but when the decision we took, and the impact shifts the balance. If the data mesh comes after the inflection point (see A), then there must be some kind of causality that converges uniquely toward the data mesh, which is questionable, if not illogical. A data mesh eventually makes sense after organizations reached a certain scale and thus is likely improbable to be adopted by small to medium businesses. Even for large organizations the data mesh may not be a viable solution if it doesn't have a proven record of success. 

I could understand if the author would have said that the data mesh will lead to an inflection point after its adoption, as is the case of transformative/disruptive technologies. Unfortunately, the tracking record of BI and Data Analytics projects doesn't give many hopes for such a magical moment to happen. Probably, becoming a data-driven organization could have such an effect, though for many organizations the effects are still far from expectations. 

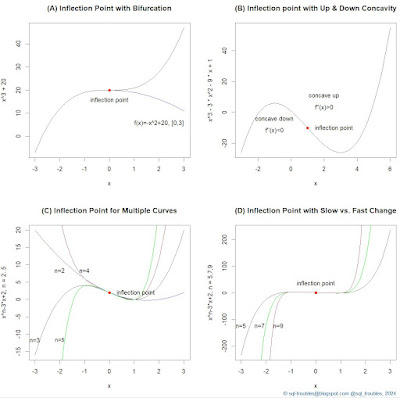
There's another point to consider. A curve with inflection points can contain up and down concavities (see B) or there can be multiple curves passing through an inflection point (see C) and the continuation can be on any of the curves.

Examples of Inflection Points [3]

The change can be fast or slow (see D), and in the latter it may take a long time for change to be perceived. Also [2] notes that the perception that something changed can happen in stages. Moreover, the inflection point can be only local and doesn't describe the future evolution of the curve, which to say that the curve can change the trajectory shortly after that. It happens in business processes and policy implementations that after a change was made in extremis to alleviate an issue a slight improvement is recognized after which the performance decays sharply. It's the case of situations in which the symptoms and not the root causes were addressed. 

More appropriate to describe the change would be a tipping point, which can be defined as a critical threshold beyond which a system (the organization) reorganizes/changes, often abruptly and/or irreversible.

Previous Post <<||>> Next Post

References:
[1] Zhamak Dehghani (2021) Data Mesh: Delivering Data-Driven Value at Scale (book review)
[2] Andrew S Grove (1988) "Only the Paranoid Survive: How to Exploit the Crisis Points that Challenge Every Company and Career"
[3] SQL Troubles (2024) R Language: Drawing Function Plots (Part II - Basic Curves & Inflection Points) (link)

17 March 2024

🧭Business Intelligence: Data Products (Part II: The Complexity Challenge)

Business Intelligence
Business Intelligence Series

Creating data products within a data mesh resumes in "partitioning" a given set of inputs, outputs and transformations to create something that looks like a Lego structure, in which each Lego piece represents a data product. The word partition is improperly used as there can be overlapping in terms of inputs, outputs and transformations, though in an ideal solution the outcome should be close to a partition.

If the complexity of inputs and outputs can be neglected, even if their number could amount to a big number, not the same can be said about the transformations that must be performed in the process. Moreover, the transformations involve reengineering the logic built in the source systems, which is not a trivial task and must involve adequate testing. The transformations are a must and there's no way to avoid them. 

When designing a data warehouse or data mart one of the goals is to keep the redundancy of the transformations and of the intermediary results to a minimum to minimize the unnecessary duplication of code and data. Code duplication becomes usually an issue when the logic needs to be changed, and in business contexts that can happen often enough to create other challenges. Data duplication becomes an issue when they are not in synch, fact derived from code not synchronized or with different refresh rates.

Building the transformations as SQL-based database objects has its advantages. There were many attempts for providing non-SQL operators for the same (in SSIS, Power Query) though the solutions built based on them are difficult to troubleshoot and maintain, the overall complexity increasing with the volume of transformations that must be performed. In data mashes, the complexity increases also with the number of data products involved, especially when there are multiple stakeholders and different goals involved (see the challenges for developing data marts supposed to be domain-specific). 

To growing complexity organizations answer with complexity. On one side the teams of developers, business users and other members of the governance teams who together with the solution create an ecosystem. On the other side, the inherent coordination and organization meetings, managing proposals, the negotiation of scope for data products, their design, testing, etc.  The more complex the whole ecosystem becomes, the higher the chances for systemic errors to occur and multiply, respectively to create unwanted behavior of the parties involved. Ecosystems are challenging to monitor and manage. 

The more complex the architecture, the higher the chances for failure. Even if some organizations might succeed, it doesn't mean that such an endeavor is for everybody - a certain maturity in building data architectures, data-based artefacts and managing projects must exist in the organization. Many organizations fail in addressing basic analytical requirements, why would one think that they are capable of handling an increased complexity? Even if one breaks the complexity of a data warehouse to more manageable units, the complexity is just moved at other levels that are more difficult to manage in ensemble. 

Being able to audit and test each data product individually has its advantages, though when a data product becomes part of an aggregate it can be easily get lost in the bigger picture. Thus, is needed a global observability framework that allows to monitor the performance and health of each data product in aggregate. Besides that, there are needed event brokers and other mechanisms to handle failure, availability, security, etc. 

Data products make sense in certain scenarios, especially when the complexity of architectures is manageable, though attempting to redesign everything from their perspective is like having a hammer in one's hand and treating everything like a nail.

Previous Post <<||>> Next Post

🧭Business Intelligence: Data Products (Part I: A Lego Exercise)

Business Intelligence
Business Intelligence Series

One can define a data product as the smallest unit of data-driven architecture that can be independently deployed and managed (aka product quantum) [1]. In other terms one can think of a data product like a box (or Lego piece) which takes data as inputs, performs several transformations on the data from which result several output data (or even data visualizations or a hybrid between data, visualizations and other content). 

At high-level each Data Analytics solution can be regarded as a set of inputs, a set of outputs and the transformations that must be performed on the inputs to generate the outputs. The inputs are the data from the operational systems, while the outputs are analytics data that can be anything from data to KPIs and other metrics. A data mart, data warehouse, lakehouse and data mesh can be abstracted in this way, though different scales apply. 

For creating data products within a data mesh, given a set of inputs, outputs and transformations, the challenge is to find horizontal and vertical partitions within these areas to create something that looks like a Lego structure, in which each piece of Lego represents a data product, while its color represents the membership to a business domain. Each such piece is self-contained and contains a set of transformations, respectively intermediary inputs and outputs. Multiple such pieces can be combined in a linear or hierarchical fashion to transform the initial inputs into the final outputs. 

Data Products with a Data Mesh

Finding such a partition is possible though it involves a considerable effort, especially in designing the whole thing - identifying each Lego piece uniquely. When each department is on its own and develops its own Lego pieces, there's no guarantee that the pieces from the various domains will fit together to built something cohesive, performant, secure or well-structured. Is like building a house from modules, the pieces must fit together. That would be the role of governance (federated computational governance) - to align and coordinate the effort. 

Conversely, there are transformations that need to be replicated for obtaining autonomous data products, and the volume of such overlapping can be considerable high. Consider for example the logic available in reports and how often it needs to be replicated. Alternatively, one can create intermediary data products, when that's feasible. 

It's challenging to define the inputs and outputs for a Lego piece. Now imagine in doing the same for a whole set of such pieces depending on each other! This might work for small pieces of data and entities quite stable in their lifetime (e.g. playlists, artists, songs), but with complex information systems the effort can increase by a few factors. Moreover, the complexity of the structure increases as soon the Lego pieces expand beyond their initial design. It's like the real Lego pieces would grow within the available space but still keep the initial structure - strange constructs may result, which even if they work, change the gravity center of the edifice in other directions. There will be thus limits to grow that can easily lead to duplication of functionality to overcome such challenges.

Each new output or change in the initial input for this magic boxes involves a change of all the intermediary Lego pieces from input to output. Just recollect the last experience of defining the inputs and the outputs for an important complex report, how many iterations and how much effort was involved. This might have been an extreme case, though how realistic is the assumption that with data products everything will go smoother? No matter of the effort involved in design, there will be always changes and further iterations involved.

Previous Post <<||>> Next Post

References:
[1] Zhamak Dehghani (2021) Data Mesh: Delivering Data-Driven Value at Scale (book review

15 March 2024

🧊🗒️Data Warehousing: Data Mesh [Notes]

Disclaimer: This is work in progress intended to consolidate information from various sources. 

Last updated: 17-Mar-2024

Data Products with a Data Mesh

Data Mesh
  • {definition} "a sociotechnical approach to share, access and manage analytical data in complex and large-scale environments - within or across organizations" [1]
    • ⇐ there is no default standard or reference implementation of data mesh and its components [2]
  • {definition} a type of decentralized data architecture that organizes data based on different business domains [2]
    • ⇐ no centralized data architecture coexists with data mesh, unless in transition [1]
    • distributes the modeling of analytical data, the data itself and its ownership [1]
  • {characteristic} partitions data around business domains and gives data ownership to the domains [1]
    • each domain can model their data according to their context [1]
    • there can be multiple models of the same concept in different domains gives the data sharing responsibility to those who are most intimately familiar with the data [1]
    • endorses multiple models of the data
      • data can be read from one domain, transformed and stored by another domain [1]
  • {characteristic} evolutionary execution process
  • {characteristic} agnostic of the underlying technology and infrastructure [1]
  • {aim} respond gracefully to change [1]
  • {aim} sustain agility in the face of growth [1]
  • {aim} increase the ratio of value from data to investment [1]
  • {principle} data as a product
    • {goal} business domains become accountable to share their data as a product to data users
    • {goal} introduce a new unit of logical architecture that controls and encapsulates all the structural components needed to share data as a product autonomously [1]
    • {goal} adhere to a set of acceptance criteria that assure the usability, quality, understandability, accessibility and interoperability of data products*
    • usability characteristics
  • {principle} domain-oriented ownership
    • {goal} decentralize the ownership of sharing analytical data to business domains that are closest to the data [1]
    • {goal} decompose logically the data artefacts based on the business domain they represent and manage their life cycle independently [1]
    • {goal} align business, technology and analytical data [1]
  • {principle} self-serve data platform
    • {goal} provide a self-serve data platform to empower domain-oriented teams to manage and govern the end-to-end life cycle of their data products* [1]
    • {goal} streamline the experience of data consumers to discover, access, and use the data products [1]
  • {principle} federated computational governance
    • {goal} implement a federated decision making and accountability structure that balances the autonomy and agility of domains, while respecting the global conformance, interoperability and security of the mesh* [1]
    • {goal} codifying and automated execution of policies at a fine-grained level [1]
    • ⇐ the principles represent a generalization and adaptation of practices that address the scale of organization digitization* [1]
  • {concept} decentralization of data products
    • {requirement} ability to compose data across different modes of access and topologies [1]
      • data needs to be agnostic to the syntax of data, underlying storage type, and mode of access to it [1]
        • many of the existing composability techniques that assume homogeneous data won’t work
          • e.g.  defining primary and foreign key relationships between tables of a single schema [1]
    • {requirement} ability to discover and learn what is relatable and decentral [1]
    • {requirement} ability to seamlessly link relatable data [1]
    • {requirement} ability to relate data temporally [1]
  • {concept} data product 
    • the smallest unit of data-based architecture that can be independently deployed and managed (aka product quantum) [1]
    • provides a set of explicitly defined and data sharing contracts
    • provides a truthful portion of the reality for a particular domain (aka single slice of truth) [1]
    • constructed in alignment with the source domain [3]
    • {characteristic} autonomous
      • its life cycle and model are managed independently of other data products [1]
    • {characteristic} discoverable
      • via a centralized registry or catalog that list the available datasets with some additional information about each dataset, the owners, the location, sample data, etc. [1]
    • {characteristic} addressable
      • via a permanent and unique address to the data user to programmatically or manually access it [1] 
    • {characteristic} understandable
      • involves getting to know the semantics of its underlying data and the syntax in which the data is encoded [1]
      • describes which entities it encapsulates, the relationships between them, and their adjacent data products [1]
    • {characteristic} trustworthy and truthful
      • represents the fact of the business correctly [1]
      • provides data provenance and data lineage [1]
    • {characteristic} natively accessible
      • make it possible for various data users to access and read its data in their native mode of access [1]
      • meant to be broadcast and shared widely [3]
    • {characteristic} interoperable and composable
      • follows a set of standards and harmonization rules that allow linking data across domains easily [1]
    • {characteristic} valuable on its own
      • must have some inherent value for the data users [1]
    • {characteristic} secure
      • the access control is validated by the data product, right in the flow of data, access, read, or write [1] 
        • ⇐ the access control policies can change dynamically
    • {characteristic} multimodal 
      • there is no definitive 'right way' to create a data product, nor is there a single expected form, format, or mode that it is expected to take [3] 
    • shares its logs, traces, and metrics while consuming, transforming, and sharing data [1]
    • {concept} data quantum (aka product data quantum, architectural quantum) 
      • unit of logical architecture that controls and encapsulates all the structural components needed to share a data product [1]
        • {component} data
        • {component} metadata
        • {component} code
        • {component} policies
        • {component} dependencies' listing
    • {concept} data product observability
      • monitor the operational health of the mesh
      • debug and perform postmortem analysis
      • perform audits
      • understand data lineage
    • {concept} logs 
      • immutable, timestamped, and often structured events that are produced as a result of processing and the execution of a particular task [1]
      • used for debugging and root cause analysis
    • {concept} traces
      • records of causally related distributed events [1]
    • {concept} metrics
      • objectively quantifiable parameters that continue to communicate build-time and runtime characteristics of data products [1]
  • artefacts 
    • e.g. data, code, metadata, policies
Previous Post <<||>> Next Post

References:
[1] Zhamak Dehghani (2021) Data Mesh: Delivering Data-Driven Value at Scale (book review)
[2] Zhamak Dehghani (2019) How to Move Beyond a Monolithic Data Lake to a Distributed Data Mesh (link)
[3] Adam Bellemare (2023) Building an Event-Driven Data Mesh: Patterns for Designing and Building Event-Driven Architectures

14 March 2024

🧭Business Intelligence: Architecture (Part I: Monolithic vs. Distributed and Zhamak Dehghani's Data Mesh - Debunked)

Business Intelligence
Business Intelligence Series

In [1] the author categorizes data warehouses (DWHs) and lakes as monolithic architectures, as opposed to data mesh's distributed architecture, which makes me circumspect about term's use. There are two general definitions of what monolithic means: (1) formed of a single large block (2) large, indivisible, and slow to change.

In software architecture one can differentiate between monolithic applications where the whole application is one block of code, multi-tier applications where the logic is split over several components with different functions that may reside on the same machine or are split non-redundantly between multiple machines, respectively distributed, where the application or its components run on multiple machines in parallel.

Distributed multi-tire applications are a natural evolution of the two types of applications, allowing to distribute redundantly components across multiple machines. Much later came the cloud where components are mostly entirely distributed within same or across distinct geo-locations, respectively cloud providers.

Data Warehouse vs. Data Lake vs. Lakehouse [2]

From licensing and maintenance convenience, a DWH resides typically on one powerful machine with many chores, though components can be moved to other machines and even distributed, the ETL functionality being probably the best candidate for this. In what concerns the overall schema there can be two or more data stores with different purposes (operational/transactional data stores, data marts), each of them with their own schema. Each such data store could be moved on its own machine though that's not feasible.

DWHs tend to be large because they need to accommodate a considerable number of tables where data is extracted, transformed, and maybe dumped for the various needs. With the proper design, also DWHs can be partitioned in domains (e.g. define one schema for each domain) and model domain-based perspectives, at least from a data consumer's perspective. The advantage a DWH offers is that one can create general dimensions and fact tables and build on top of them the domain-based perspectives, minimizing thus code's redundancy and reducing the costs.  

With this type of design, the DWH can be changed when needed, however there are several aspects to consider. First, it takes time until the development team can process the request, and this depends on the workload and priorities set. Secondly, implementing the changes should take a fair amount of time no matter of the overall architecture used, given that the transformations that need to be done on the data are largely the same. Therefore, one should not confuse the speed with which a team can start working on a change with the actual implementation of the change. Third, the possibility of reusing existing objects can speed up changes' implementation. 

Data lakes are distributed data repositories in which structured, unstructured and semi-structured data are dumped in raw form in standard file formats from the various sources and further prepared for consumption in other data files via data pipelines, notebooks and similar means. One can use the medallion architecture with a folder structure and adequate permissions for domains and build reports and other data artefacts on top. 

A data lake's value increases when is combined with the capabilities of a DWH (see dedicated SQL server pool) and/or analytics engine (see serverless SQL pool) that allow(s) building an enterprise semantic model on top of the data lake. The result is a data lakehouse that from data consumer's perspective and other aspects mentioned above is not much different than the DWH. The resulting architecture is distributed too. 

Especially in the context of cloud computing, referring to nowadays applications metaphorically (for advocative purposes) as monolithic or distributed is at most a matter of degree and not of distinction. Therefore, the reader should be careful!

Previous Post <<||>> Next Post

References:
[1] Zhamak Dehghani (2021) Data Mesh: Delivering Data-Driven Value at Scale (book review)
[2] Databricks (2022) Data Lakehouse (link)

13 March 2024

🔖Book Review: Zhamak Dehghani's Data Mesh: Delivering Data-Driven Value at Scale (2021)

Zhamak Dehghani's "Data Mesh: Delivering Data-Driven Value at Scale" (2021)

Zhamak Dehghani's "Data Mesh: Delivering Data-Driven Value at Scale" (2021) is a must read book for the data professional. So, here I am, finally managing to read it and give it some thought, even if it will probably take more time and a few more reads for the ideas to grow. Working in the fields of Business Intelligence and Software Engineering for almost a quarter-century, I think I can understand the historical background and the direction of the ideas presented in the book. There are many good ideas but also formulations that make me circumspect about the applicability of some assumptions and requirements considered. 

So, after data marts, warehouses, lakes and lakehouses, the data mesh paradigm seems to be the new shiny thing that will bring organizations beyond the inflection point with tipping potential from where organization's growth will have an exponential effect. At least this seems to be the first impression when reading the first chapters. 

The book follows to some degree the advocative tone of promoting that "our shiny thing is much better than previous thing", or "how bad the previous architectures or paradigms were and how good the new ones are" (see [2]). Architectures and paradigms evolve with the available technologies and our perception of what is important for businesses. Old and new have their place in the order of things, and the old will continue to exist, at least until the new proves its feasibility.  

The definition of the data mash as "a sociotechnical approach to share, access and manage analytical data in complex and large-scale environments - within or across organizations" [1] is too abstract even if it reflects at high level what the concept is about. Compared to other material I read on the topic, the book succeeds in explaining the related concepts as well the goals (called definitions) and benefits (called motivations) associated with the principles behind the data mesh, making the book approachable also by non-professionals. 

Built around four principles "data as a product", "domain-oriented ownership", "self-serve data platform" and "federated governance", the data mesh is the paradigm on which data as products are developed; where the products are "the smallest unit of architecture that can be independently deployed and managed", providing by design the information necessary to be discovered, understood, debugged, and audited.

It's possible to create Lego-like data products, data contracts and/or manifests that address product's usability characteristics, though unless the latter are generated automatically, put in the context of ERP and other complex systems, everything becomes quite an endeavor that requires time and adequate testing, increasing the overall timeframe until a data product becomes available. 

The data mesh describes data products in terms of microservices that structure architectures in terms of a collection of services that are independently deployable and loosely coupled. Asking from data products to behave in this way is probably too hard a constraint, given the complexity and interdependency of the data models behind business processes and their needs. Does all the effort make sense? Is this the "agility" the data mesh solutions are looking for?

Many pioneering organizations are still fighting with the concept of data mesh as it proves to be challenging to implement. At a high level everything makes sense, but the way data products are expected to function makes the concept challenging to implement to the full extent. Moreover, as occasionally implied, the data mesh is about scaling data analytics solutions with the size and complexity of organizations. The effort makes sense when the organizations have a certain size and the departments have a certain autonomy, therefore, it might not apply to small to medium businesses.

Previous Post <<||>>  Next Post

References:
[1] Zhamak Dehghani (2021) "Data Mesh: Delivering Data-Driven Value at Scale" (link)
[2] SQL-troubles (2024) Zhamak Dehghani's Data Mesh - Monolithic Warehouses and Lakes (link)

04 March 2024

🧭🏭Business Intelligence: Microsoft Fabric (Part II: Domains and the Data Mesh I -The Challenge of Structure Matching)

Business Intelligence Series

The holy grail of building a Data Analytics infrastructure seems to be nowadays the creation of a data mesh, a decentralized data architecture that organizes data by specific business domains. This endeavor proves to be difficult to achieve given the various challenges faced  – data integration, data ownership, data product creation and ownership, enablement of data citizens, respectively enforcing security and governance in a federated manner. 

Microsoft Fabric promises to facilitate the creation of data mashes with the help of domains and subdomain by providing built-in security, administration, and governance features associated with them. A domain is a way of logically grouping together all the data in an organization that is relevant to a particular area or field. A subdomain is a way for fine tuning the logical grouping of the data.

Business domains
Business domains & their entities

At high level the challenge of building a data mesh is on how to match or aggregate structures. On one side is the high-level structure of the data mesh, while on the other side is the structure of the business data entities. The data entities can be grouped within a taxonomy with multiple levels that expands to the departments. That’s why it seems somehow natural to consider the departments as the top-most domains of the data mesh. The issue is that if the segmentation starts from a high level, iI becomes inflexible in modeling. Moreover, one has only domains and subdomains, and thus a 2-level structure to model the main aspects of the data mesh.

Some organizations allow unrestricted access to the data belonging to a given department, while others breakdown the access to a more granular level. There are also organizations that don’t restrict the access at all, though this may change later. Besides permissions and a way of grouping together the entities, what value brings to set the domains as departments? 

Therefore, I’m not convinced about using an organizations’ departmental structure as domains, especially when such a structure may change and this would imply a full range of further changes. Moreover, such a structure doesn’t reflect the span of processes or how permissions are assigned for the various roles, which are better reflected on how information systems are structured. Most probably the solution needs to accommodate both perspective and be somehow in the middle. 

Take for example the internal structure of the modules from Dynamics 365 (D365). The Finance area is broken down in Accounts Payable, Accounts Receivables, Fixed Assets, General Ledger, etc. In some organizations the departments reflect this delimitation to some degree, while in others are just associated with finance-related roles. Moreover, the permissions are more granular and, reflecting the data entities the users work with. 

Conversely, SCM extends into Finance as Purchase orders, Sales orders and other business documents are the starting or intermediary points of processes that span modules. Similarly, there are processes that start in CRM or other systems. The span of processes seem to be more appropriate for structuring the data mesh, though the system overlapping with the roles involved in the processes and the free definition of process boundaries can overcomplicate the whole design.

It makes sense to define the domains at a level that resembles the structure of the modules available in D365, while the macro data-entities represent the subdomain. The subdomain would represent then master as well as transactional data entities from the perspective of the domains, with there will be entities that need to be shared between multiple domains. Such a structure has less chances to change over time, allowing more flexibility and smaller areas of focus and thus easier to design, develop, test, deploy and maintain.

Previous Post <<||>> Next Post

06 April 2017

⛏️Data Management: Data Mesh (Definitions)

"Data Mesh is a sociotechnical approach to share, access and manage analytical data in complex and large-scale environments - within or across organizations." (Zhamak Dehghani, "Data Mesh: Delivering Data-Driven Value at Scale", 2021)

"A data mesh is an architectural concept in data engineering that gives business domains (divisions/departments) within a large organization ownership of the data they produce. The centralized data management team then becomes the organization’s data governance team." (Margaret Rouse, 2023) [source]

"Data Mesh is a design concept based on federated data and business domains. It applies product management thinking to data management with the outcome being Data Products. It’s technology agnostic and calls for a domain-centric organization with federated Data Governance." (Sonia Mezzetta, "Principles of Data Fabric", 2023)

"A data mesh is a decentralized data architecture with four specific characteristics. First, it requires independent teams within designated domains to own their analytical data. Second, in a data mesh, data is treated and served as a product to help the data consumer to discover, trust, and utilize it for whatever purpose they like. Third, it relies on automated infrastructure provisioning. And fourth, it uses governance to ensure that all the independent data products are secure and follow global rules."(James Serra, "Deciphering Data Architectures", 2024)

"A data mesh is a federated data architecture that emphasizes decentralizing data across business functions or domains such as marketing, sales, human resources, and more. It facilitates organizing and managing data in a logical way to facilitate the more targeted and efficient use and governance of the data across organizations." (Arshad Ali & Bradley Schacht, "Learn Microsoft Fabric", 2024)

"To explain a data mesh in one sentence, a data mesh is a centrally managed network of decentralized data products. The data mesh breaks the central data lake into decentralized islands of data that are owned by the teams that generate the data. The data mesh architecture proposes that data be treated like a product, with each team producing its own data/output using its own choice of tools arranged in an architecture that works for them. This team completely owns the data/output they produce and exposes it for others to consume in a way they deem fit for their data." (Aniruddha Deswandikar,"Engineering Data Mesh in Azure Cloud", 2024)

"A data mesh is a decentralized data architecture that organizes data by a specific business domain - for example, marketing, sales, customer service and more - to provide more ownership to the producers of a given data set." (IBM) [source]

"A data mesh is a new approach to designing data architectures. It takes a decentralized approach to data storage and management, having individual business domains retain ownership over their datasets rather than flowing all of an organization’s data into a centrally owned data lake." (Alteryx) [source]

"A Data Mesh is a solution architecture for the specific goal of building business-focused data products without preference or specification of the technology involved." (Gartner)

"A data mesh is an architectural framework that solves advanced data security challenges through distributed, decentralized ownership." (AWS) [source]

"Data mesh defines a platform architecture based on a decentralized network. The data mesh distributes data ownership and allows domain-specific teams to manage data independently." (TIBCO) [source]

"Data mesh refers to a data architecture where data is owned and managed by the teams that use it. A data mesh decentralizes data ownership to business domains–such as finance, marketing, and sales–and provides them a self-serve data platform and federated computational governance." (Qlik) [source]

25 December 2015

🪙Business Intelligence: Data Mesh (Just the quotes)

"Another myth is that we shall have a single source of truth for each concept or entity. […] This is a wonderful idea, and is placed to prevent multiple copies of out-of-date and untrustworthy data. But in reality it’s proved costly, an impediment to scale and speed, or simply unachievable. Data Mesh does not enforce the idea of one source of truth. However, it places multiple practices in place that reduces the likelihood of multiple copies of out-of-date data." (Zhamak Dehghani, "Data Mesh: Delivering Data-Driven Value at Scale", 2021)

"Data Mesh attempts to strike a balance between team autonomy and inter-term interoperability and collaboration, with a few complementary techniques. It gives domain teams autonomy to have control of their local decision making, such as choosing the best data model for their data products. While it uses the computational governance policies to impose a consistent experience across all data products; for example, standardizing on the data modeling language that all domains utilize." (Zhamak Dehghani, "Data Mesh: Delivering Data-Driven Value at Scale", 2021)

"Data mesh is a solution for organizations that experience scale and complexity, where existing data warehouse or lake solutions have become blockers in their ability to get value from data at scale and across many functions of their business, in a timely fashion and with less friction." (Zhamak Dehghani, "Data Mesh: Delivering Data-Driven Value at Scale", 2021)

"Data Mesh must allow for data models to change continuously without fatal impact to downstream data consumers, or slowing down access to data as a result of synchronizing change of a shared global canonical model. Data Mesh achieves this by localizing change to domains by providing autonomy to domains to model their data based on their most intimate understanding of the business without the need for central coordinations of change to a single shared canonical model." (Zhamak Dehghani, "Data Mesh: Delivering Data-Driven Value at Scale", 2021)

"Data mesh [...] reduces points of centralization that act as coordination bottlenecks. It finds a new way of decomposing the data architecture without slowing the organization down with synchronizations. It removes the gap between where the data originates and where it gets used and removes the accidental complexities - aka pipelines - that happen in between the two planes of data. Data mesh departs from data myths such as a single source of truth, or one tightly controlled canonical data model." (Zhamak Dehghani, "Data Mesh: Delivering Data-Driven Value at Scale", 2021)

"Data mesh relies on a distributed architecture that consists of domains. Each domain is an independent unit of data and its associated storage and compute components. When an organization contains various product units, each with its own data needs, each product team owns a domain that is operated and governed independently by the product team. […] Data mesh has a unique value proposition, not just offering scale of infrastructure and scenarios but also helping shift the organization’s culture around data," (Rukmani Gopalan, "The Cloud Data Lake: A Guide to Building Robust Cloud Data Architecture", 2022)

"Data has historically been treated as a second-class citizen, as a form of exhaust or by-product emitted by business applications. This application-first thinking remains the major source of problems in today’s computing environments, leading to ad hoc data pipelines, cobbled together data access mechanisms, and inconsistent sources of similar-yet-different truths. Data mesh addresses these shortcomings head-on, by fundamentally altering the relationships we have with our data. Instead of a secondary by-product, data, and the access to it, is promoted to a first-class citizen on par with any other business service." (Adam Bellemare,"Building an Event-Driven Data Mesh: Patterns for Designing and Building Event-Driven Architectures", 2023)

"Data mesh architectures are inherently decentralized, and significant responsibility is delegated to the data product owners. A data mesh also benefits from a degree of centralization in the form of data product compatibility and common self-service tooling. Differing opinions, preferences, business requirements, legal constraints, technologies, and technical debt are just a few of the many factors that influence how we work together." (Adam Bellemare, "Building an Event-Driven Data Mesh: Patterns for Designing and Building Event-Driven Architectures", 2023)

"The data mesh is an exciting new methodology for managing data at large. The concept foresees an architecture in which data is highly distributed and a future in which scalability is achieved by federating responsibilities. It puts an emphasis on the human factor and addressing the challenges of managing the increasing complexity of data architectures." (Piethein Strengholt, "Data Management at Scale: Modern Data Architecture with Data Mesh and Data Fabric" 2nd Ed., 2023)

"A data mesh splits the boundaries of the exchange of data into multiple data products. This provides a unique opportunity to partially distribute the responsibility of data security. Each data product team can be made responsible for how their data should be accessed and what privacy policies should be applied." (Aniruddha Deswandikar,"Engineering Data Mesh in Azure Cloud", 2024)

"A data mesh is a decentralized data architecture with four specific characteristics. First, it requires independent teams within designated domains to own their analytical data. Second, in a data mesh, data is treated and served as a product to help the data consumer to discover, trust, and utilize it for whatever purpose they like. Third, it relies on automated infrastructure provisioning. And fourth, it uses governance to ensure that all the independent data products are secure and follow global rules."(James Serra, "Deciphering Data Architectures", 2024)

"At its core, a data fabric is an architectural framework, designed to be employed within one or more domains inside a data mesh. The data mesh, however, is a holistic concept, encompassing technology, strategies, and methodologies." (James Serra, "Deciphering Data Architectures", 2024)

"It is very important to understand that data mesh is a concept, not a technology. It is all about an organizational and cultural shift within companies. The technology used to build a data mesh could follow the modern data warehouse, data fabric, or data lakehouse architecture - or domains could even follow different architectures." (James Serra, "Deciphering Data Architectures", 2024)

"To explain a data mesh in one sentence, a data mesh is a centrally managed network of decentralized data products. The data mesh breaks the central data lake into decentralized islands of data that are owned by the teams that generate the data. The data mesh architecture proposes that data be treated like a product, with each team producing its own data/output using its own choice of tools arranged in an architecture that works for them. This team completely owns the data/output they produce and exposes it for others to consume in a way they deem fit for their data." (Aniruddha Deswandikar,"Engineering Data Mesh in Azure Cloud", 2024)

"With all the hype, you would think building a data mesh is the answer to all of these 'problems' with data warehousing. The truth is that while data warehouse projects do fail, it is rarely because they can’t scale enough to handle big data or because the architecture or the technology isn’t capable. Failure is almost always because of problems with the people and/or the process, or that the organization chose the completely wrong technology." (James Serra, "Deciphering Data Architectures", 2024)

Related Posts Plugin for WordPress, Blogger...

About Me

My photo
Koeln, NRW, Germany
IT Professional with more than 24 years experience in IT in the area of full life-cycle of Web/Desktop/Database Applications Development, Software Engineering, Consultancy, Data Management, Data Quality, Data Migrations, Reporting, ERP implementations & support, Team/Project/IT Management, etc.