Showing posts with label correlated query. Show all posts

17 May 2020

💎🏭SQL Reloaded: Query Patterns in SQL Server (Part III: Aggregate Functions)

As their names denote, aggregate functions are used to summarize information across the whole data set or based on several attributes. The following queries exemplify the use of aggregates based on the tables created in a previous post:

-- aggreates over the whole table 
SELECT COUNT(*) NoRecords 
, MIN(StartDate) StartDate
, MAX(EndDate) EndDate
, DateDiff(d, MIN(StartDate), MAX(EndDate)) [DiffDays]
FROM dbo.T_Allocations A

-- aggregates based on several several attributes 
 SELECT A.CourseId
 , A.StudentId 
 , COUNT(*) NoRecords 
 , MIN(StartDate) StartDate
 , MAX(EndDate) EndDate
 , DateDiff(d, MIN(StartDate), MAX(EndDate)) [DiffDays]
 FROM dbo.T_Allocations A
GROUP BY A.CourseId
 , A.StudentId 

Correlated subqueries can be of help either inside of a SELECT or an CROSS, respectively OUTER APPLY: 

-- correlated subquery within a SELECT 
 SELECT *
 , (SELECT COUNT(*) NoRecords 
     FROM dbo.T_Allocations A
     WHERE C.CourseId = A.CourseId
     GROUP BY A.CourseId) NoRecords 
 FROM dbo.T_Courses C


 -- CROSS APPLY (correlated subquery)
 SELECT *
 , A.NoRecords
 , A.StartDate
 FROM dbo.T_Courses C
      CROSS APPLY (
         SELECT A.CourseId
         , COUNT(*) NoRecords 
         , MIN(StartDate) StartDate
         FROM dbo.T_Allocations A
         WHERE C.CourseId = A.CourseId
         GROUP BY A.CourseId
     ) A
 ORDER BY C.CourseName

-- OUTER APPLY (correlated subquery)
 SELECT *
 , A.NoRecords
 , A.StartDate
 FROM dbo.T_Courses C
      OUTER APPLY (
         SELECT A.CourseId
         , COUNT(*) NoRecords 
         , MIN(StartDate) StartDate
         FROM dbo.T_Allocations A
         WHERE C.CourseId = A.CourseId
         GROUP BY A.CourseId
     ) A
 ORDER BY C.CourseName

Aggregates are useful in a series of techniques like the listing of duplicates:

-- identifying duplicates via an aggregate 
SELECT A.*
FROM dbo.T_Allocations A
     JOIN (
  SELECT A.CourseId
  , A.StudentId 
  , COUNT(*) NoRecords 
  FROM dbo.T_Allocations A
  GROUP BY A.CourseId
  , A.StudentId 
  HAVING COUNT(*)>1
  ) DUP
   ON A.CourseId = DUP.CourseId 
  AND A.StudentId = DUP.Studentid
ORDER BY A.CourseId
, A.StudentId 

A similar technique can be used to remove the duplicates from the base table:

-- removing the duplicates except the last record  
 DELETE dbo.T_Allocations 
 FROM (
 SELECT A.StudentId 
 , A.CourseId
 , A.StartDate
 , A.EndDate
 , Max(A.AllocationId) AllocationId
 FROM dbo.T_Allocations A
 GROUP BY A.StudentId 
 , A.CourseId
 , A.StartDate
 , A.EndDate
 HAVING count(*)>1
  ) A
WHERE dbo.T_Allocations.CourseId = A.CourseId
  AND dbo.T_Allocations.StudentId = A.StudentId
  AND dbo.T_Allocations.StartDate = A.StartDate
  AND dbo.T_Allocations.EndDate = A.EndDate
  AND dbo.T_Allocations.AllocationId <> A.AllocationId

When the number of values is fixed and unique within a grouping, one can use aggregate functions to display the values within a matrix:

-- Matrix display via aggregates 
SELECT S.StudentId 
, S.StudentName 
, CASE WHEN A.Course1 = 1 THEN 'x' ELSE '-' END Course1
, CASE WHEN A.Course2 = 1 THEN 'x' ELSE '-' END Course2
, CASE WHEN A.Course3 = 1 THEN 'x' ELSE '-' END Course3
, CASE WHEN A.Course4 = 1 THEN 'x' ELSE '-' END Course4
, CASE WHEN A.Course5 = 1 THEN 'x' ELSE '-' END Course5
FROM dbo.T_Students S
     LEFT JOIN (
  SELECT A.StudentId 
  , Max(CASE WHEN A.CourseId = 1 THEN 1 ELSE 0 END) Course1
  , Max(CASE WHEN A.CourseId = 2 THEN 1 ELSE 0 END) Course2
  , Max(CASE WHEN A.CourseId = 3 THEN 1 ELSE 0 END) Course3
  , Max(CASE WHEN A.CourseId = 4 THEN 1 ELSE 0 END) Course4
  , Max(CASE WHEN A.CourseId = 5 THEN 1 ELSE 0 END) Course5
  FROM dbo.T_Allocations A
  GROUP BY A.StudentId
    ) A
   ON S.StudentId = A.StudentId 
ORDER BY S.StudentName 


Notes:
The queries work also in SQL databases in Microsoft Fabric.

Happy coding!

16 May 2020

💎🏭SQL Reloaded: Query Patterns in SQL Server (Part II: Joins and Subqueries)

The basis for being able to manipulate data via SQL scripting is a good knowledge of using joins and subqueries as seems fit for the purpose and data models. The following scripts are based on the tables created in a previous post.

-- FULL JOIN
SELECT *
FROM dbo.T_Courses C
     JOIN dbo.T_Students S
        ON C.CourseId = S.CourseId
 ORDER BY C.CourseName
 , S.StudentName 

-- FULL JOIN (deprecated)
 SELECT *
 FROM dbo.T_Courses C
 , dbo.T_Students S
 WHERE C.CourseId = S.CourseId
 ORDER BY C.CourseName
 , S.StudentName 

--LEFT JOIN
 SELECT *
 FROM dbo.T_Courses C
      LEFT JOIN dbo.T_Students S
        ON C.CourseId = S.CourseId 
 WHERE S.CourseId IS NULL
 ORDER BY C.CourseName
 , S.StudentName 

-- RIGHT JOIN
 SELECT *
 FROM dbo.T_Courses C
      RIGHT JOIN dbo.T_Students S
       ON C.CourseId = S.CourseId 
 WHERE C.CourseId IS NULL
 ORDER BY C.CourseName
 , S.StudentName 

-- FULL OUTER JOIN
 SELECT *
 FROM dbo.T_Courses C
      FULL OUTER JOIN dbo.T_Students S
        ON C.CourseId = S.CourseId 
 --WHERE C.CourseId IS NULL
 --WHERE S.CourseId IS NULL
 --WHERE (C.CourseId IS NULL OR S.StudentId IS NULL)
 --WHERE (C.CourseId IS NULL AND S.StudentId IS NULL)
 ORDER BY C.CourseName
 , S.StudentName 

The IN, NOT IN, EXISTS and NOT EXISTS allow using correlated queries, their use being indicated when there are no actual data needed from the tables involved in the correlated queries:

-- EXISTS (correlated subquery)
SELECT *
FROM dbo.T_Courses C
WHERE EXISTS (SELECT StudentId 
        FROM dbo.T_Students S
        WHERE C.CourseId = S.CourseId)
ORDER BY C.CourseName

-- NOT EXISTS (correlated subquery)
 SELECT *
 FROM dbo.T_Courses C
 WHERE EXISTS (SELECT StudentId 
        FROM dbo.T_Students S
        WHERE C.CourseId = S.CourseId)
 ORDER BY C.CourseName

-- IN (subquery)
 SELECT *
 FROM dbo.T_Courses C
 WHERE CourseId IN (SELECT CourseId 
        FROM dbo.T_Students S)
 ORDER BY C.CourseName

Joining multiples tables is done using the same principles as above:

-- joins with more tables 
SELECT A.CourseId 
, C.CourseName 
, A.StudentId 
, S.StudentName 
 , A.StartDate 
 , A.EndDate 
FROM dbo.T_Allocations A
      JOIN dbo.T_Courses C
        ON A.CourseId = C.CourseId 
      JOIN dbo.T_Students S
        ON A.StudentId = S.StudentId 
 ORDER BY C.CourseName 
 , S.StudentName 

One can obtain the same result via correlated subqueries (a technique often met between Oracle developers). From readability reasons I avoid writing such queries, unless there’s a special purpose to do so.

-- correlated subquery for individual values
SELECT A.CourseId 
, (SELECT C.CourseName 
    FROM dbo.T_Courses C
    WHERE A.CourseId = C.CourseId) CourseName
 , A.StudentId 
 , (SELECT S.StudentName 
    FROM dbo.T_Students S
    WHERE A.StudentId = S.StudentId) StudentName
 , A.StartDate 
 , A.EndDate 
FROM dbo.T_Allocations A
 ORDER BY CourseName 
 , StudentName 

When displaying values within a SELECT via a correlated subqueries, some developers feel the need to use MAX or MIN functions to make sure only one value will be returned. For data analysis it may be acceptable, however if the data model imposes it, then a redesign of the solution is more likely necessary.

-- correlated subquery for individual values
 SELECT A.CourseId 
 , (SELECT Max(C.CourseName)
    FROM dbo.T_Courses C
    WHERE A.CourseId = C.CourseId) CourseName
 , A.StudentId 
 , (SELECT Max(S.StudentName)
    FROM dbo.T_Students S
    WHERE A.StudentId = S.StudentId) StudentName
 , A.StartDate 
 , A.EndDate 
 FROM dbo.T_Allocations A
 ORDER BY CourseName 
 , StudentName 

Another technique not recommended is displaying one or more attributes from the same table with the same conditions via individual correlated queries. The use of aggregate functions is more appropriate however with numerical or date values.

Notes:
The queries work also in SQL databases in Microsoft Fabric.

Happy coding!

Previous Post <<||>> Next Post

11 March 2010

💎SQL Reloaded: Oracle vs. SQL Server: Averages I

   For many people working with averages is not a complicated topic at all, and that’s quite true, though as always it depends on how much you want to complicate everything. The average or the arithmetic mean is defined as the middle value of the values within a data set calculated as the sum of the values divided by the number of values: 
AVG - Simple Average 
   RDBMS vendors provide similar functionality within the AVG aggregate function, and even if in theory the result could be calculated using the SUM and COUNT aggregate functions, as per the above definition, given its importance in statistics, to provide an AVG function seems to be a natural choice. AVG could be used across the whole data set or within a given “partition” determined by the GROUP BY clause.

-- Oracle/SQL Server: Simple Averages 
SELECT ProductID 
, AVG(UnitPrice) AverageUnitPrice 
, SUM(UnitPrice)/COUNT(1) AverageUnitPriceDef 
FROM Purchasing.PurchaseOrderDetail 
GROUP BY ProductID 


    For most of the data analysis requirements the simple average function would be enough, though there are cases in which is required to address the sensitivity of values to certain modifiers – for example quantities or the number of lines. For such cases is used the weighted average (weighted arithmetic mean) calculated as the sum of values and quantifiers products, the total being divided by the sum of quantifiers:
AVG - Weighted Average
Note:
     In case the quantifiers are all 1 then the weighted average equates with the simple average, the output being the same also when the values are constant.

      The weighted average is quite a useful tool when performing PO Price Analysis in which often needs to be be considered also the volume of purchased quantities with a given Price Unit: 
 
-- Oracle/SQL Server: Simple/Weighted Averages 
SELECT ProductID 
, AVG(UnitPrice) AverageUnitPrice 
, SUM(UnitPrice*OrderQty)/SUM(OrderQty) WeightedAverageUnitPrice 
FROM Purchasing.PurchaseOrderDetail 
GROUP BY ProductID  

   The actual implementation in a query might differ based on requirements and preferences – as multiple left joins, inline view or correlated query, each of the mentioned approaches coming with their downsides and strengths: 
 
-- Oracle/SQL Server: Averages (inline view) 
SELECT ITM.ProductID 
, ITM.Name ProductName 
, ITM.ProductNumber 
, DAT.AverageUnitPrice 
, DAT.WeightedAverageUnitPrice 
FROM Production.Product ITM 
LEFT JOIN ( --calculated averages 
    SELECT POD.ProductID 
    , AVG(POD.UnitPrice) AverageUnitPrice 
    , SUM(POD.UnitPrice*OrderQty)/SUM(POD.OrderQty) WeightedAverageUnitPrice 
    FROM Purchasing.PurchaseOrderDetail POD 
       JOIN Purchasing.PurchaseOrderHeader POH 
          ON POD.PurchaseOrderID = POH.PurchaseOrderID 
    WHERE POH.Status IN (2, 4) -- 2-Approved, 4-Complete 
   GROUP BY POD.ProductID)DAT 
    ON ITM.ProductID = DAT.ProductID 
ORDER BY ITM.Name 

-- Oracle/SQL Server: Averages (multiple left joins) 
SELECT ITM.ProductID 
, ITM.Name ProductName 
, ITM.ProductNumber 
, AVG(POD.UnitPrice) AverageUnitPrice 
, SUM(POD.UnitPrice*OrderQty)/SUM(POD.OrderQty) WeightedAverageUnitPrice 
FROM Production.Product ITM 
   LEFT JOIN Purchasing.PurchaseOrderDetail POD 
      ON ITM.ProductID = POD.ProductID 
   LEFT JOIN Purchasing.PurchaseOrderHeader POH 
      ON POD.PurchaseOrderID = POH.PurchaseOrderID  
WHERE POH.Status IN (2, 4) -- 2-Approved, 4-Complete 
GROUP BY ITM.ProductID 
,ITM.Name 
,ITM.ProductNumber 
ORDER BY ITM.Name  

-- SQL Server 2005: Averages (OUTER APPLY) 
SELECT ITM.ProductID 
, ITM.Name ProductName 
, ITM.ProductNumber 
, DAT.AverageUnitPrice 
, DAT.WeightedAverageUnitPrice 
FROM Production.Product ITM 
OUTER APPLY ( -- calculated averages 
    SELECT AVG(POD.UnitPrice) AverageUnitPrice 
    , SUM(POD.UnitPrice*OrderQty)/SUM(POD.OrderQty) WeightedAverageUnitPrice 
    FROM Purchasing.PurchaseOrderDetail POD  
       JOIN Purchasing.PurchaseOrderHeader POH 
          ON POD.PurchaseOrderID = POH.PurchaseOrderID  
    WHERE ITM.ProductID = POD.ProductID  
        AND POH.Status IN (2, 4) -- 2-Approved, 4-Complete 
) DAT 
ORDER BY ITM.Name 

      A different type of approach could be focused on calculating the simple or weighted average based only on the last n PO Lines, for example the last 3 PO Lines: 
  
-- Oracle/SQL Server 2005: last 3 PO average prices 
SELECT DAT.ProductID 
, MAX(DAT.RANKING) NumberRecords 
, AVG(DAT.UnitPrice) AveragePrice 
, SUM(DAT.UnitPrice* DAT.OrderQty)/SUM(DAT.OrderQty) WeightedAveragePrice 
FROM (-- ranked PO Prices 
    SELECT POD.ProductID 
    , POD.UnitPrice 
    , POD.OrderQty 
    , RANK() OVER(PARTITION BY POD.ProductID ORDER BY POH.OrderDate DESC,   POD.PurchaseOrderDetailID DESC) RANKING 
    FROM Purchasing.PurchaseOrderDetail POD 
       JOIN Purchasing.PurchaseOrderHeader POH 
          ON POD.PurchaseOrderID = POH.PurchaseOrderID 
    WHERE POH.Status IN (2, 4) -- 2-Approved, 4-Complete 
) DAT 
WHERE DAT.RANKING BETWEEN 1 AND 3 
GROUP BY DAT.ProductID


    The problem could be complicated even more by selecting all the POs corresponding to the last 3 distinct Prices used; not sure if it brings any value but the formulation is perfectly valid and don’t despair if a user comes with such a request.

    Occasionally it might be needed to study the evolution of prices over time, the previous problem becoming a simple moving average or weighted moving average problem, in which the average is calculated in report with a moving point on the time scale with respect to the previous k points or concerning the previous and following k points including the current point:
AVG - Simple Moving Average
AVG - Weighted Moving Average
     G. Priester shows in his Calculating Moving Averages with T-SQL article a nice solution for simple moving averages calculation exemplifying it on stock market data. Frankly, given its flexibility, I prefer to use the CROSS APPLY operator in combination with fGetDatesInInterval function introduced in More Date-related Functionality – Part I post, the function returning all the dates falling in a certain interval. Because in case of POs there could be multiple transactions per day for the same Product, the problem is slightly changed, the averages being based within a 31 window:

-- SQL Server 2005: 31 days moving averages 
SELECT ITM.ProductNumber 
, ITM.Name ProductName 
, DIN.DateSequence ReportingDate 
, DAT.AverageUnitPrice 
, DAT.WeightedAverageUnitPrice 
FROM dbo.fGetDatesInInterval('2003-01-01', '2003-12-31') DIN 
CROSS APPLY (--calculated averages 
    SELECT POD.ProductID 
    , AVG(POD.UnitPrice) AverageUnitPrice 
    , SUM(POD.UnitPrice*OrderQty)/SUM(POD.OrderQty) WeightedAverageUnitPrice 
    FROM Purchasing.PurchaseOrderDetail POD 
       JOIN Purchasing.PurchaseOrderHeader POH 
          ON POD.PurchaseOrderID = POH.PurchaseOrderID 
     WHERE DATEDIFF(d, POH.OrderDate, DIN.DateSequence) BETWEEN 0 AND 30 -- 31 days 
     --WHERE DATEDIFF(d, POH.OrderDate, DIN.DateSequence) BETWEEN -15 AND 15 -- 31 days 
         AND POH.Status IN (2, 4) -- 2-Approved, 4-Complete 
GROUP BY POD.ProductID) DAT 
LEFT JOIN Production.Product ITM 
   ON DAT.ProductID = ITM.ProductID 
WHERE DATEPART(dw, DIN.DateSequence) BETWEEN 2 AND 6 -- Working Days 
ORDER BY ITM.Name 
, DIN.DateSequence 

05 February 2010

💎SQL Reloaded: Just in CASE IV (Other Scenarios)

    Two days ago I was looking on the Web on random posts to see whether I missed something important related to CASE function and I stumble over an old post of Craig S. Mullins, in one of the examples (See SQL Statement #5) there is a query similar with the one below:
    As can be seen on more than one branch of a CASE there is a correlated sub-query based on the same table, the aggregated value being used for further calculations. Most probably the respective query had only the purpose to demonstrate a technique, though I’m having mainly two observations related to it:
1. The query returns a label of whether the Stock is High, Normal, Low or there is no Stock, though I have no measure of what the Stock actually is, thus in a first phase I can’t validate whether the query shows the correct data. In case a report is based on the respective query this reduces considerably also report's usability.
2. A select is replicated across several CASE branches fact that I find it complicates query’s complexity reflected in query’s understanding and maintainability, while considering that the logic needs to be kept in synchronization increases the chances for making a mistake. At least in this situation, being involved only one table, the logic is quite simple though what do you do when the correlated sub-query is more complex?

    How about encapsulating query’s logic in a sub-query and join it to the main tables using a left join? This approach would address both issues mentioned above:
    When creating a query there is always an important facts that needs to be considered - query’s performance. The second query is simpler and in theory it should be easier to process, expecting to have at least similar performance as the first version. In this case the ProductID is a foreign key in Production.ProductInventory, the search performed on the respective table having minimum impact on performance. If no index is available on the searched attribute, more likely first query’s performance will decrease considerably. The best approach for mitigating the performance differences between the two queries is to look at Client Statistics and Execution Plan. In what concerns the Client Statistics both queries are having similar performance, while the Execution Plan of the second query excepting the fact that is simpler and, without going into details, it seems the second plan is better.

    Maybe it makes sense to use correlated sub-queries in a CASE only when the correlated sub-queries have distinct logic, though even then I would recommend using a left join instead, this technique allowing more flexibility being possible to show the actual values in the query and even reuse them if needed in additional calculations.

    Talking about correlated queries, I found cases in which two distinct correlated sub-queries with the same logic were used to pull two distinct attributes available in the same table, something like in the below example.
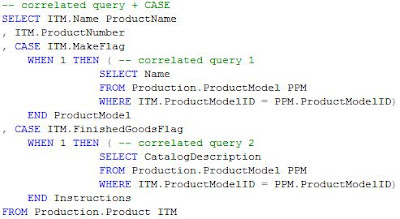
    What if the correlated sub-queries are used again with the CASE function like in the below example?
    Even if maybe the number of calls to the correlated sub-queries is reduced by using a CASE, I would recommend using a left join instead, this technique offering more flexibility, the logic becoming also much easier to maintain and debug.
Related Posts Plugin for WordPress, Blogger...

About Me

My photo
Koeln, NRW, Germany
IT Professional with more than 24 years experience in IT in the area of full life-cycle of Web/Desktop/Database Applications Development, Software Engineering, Consultancy, Data Management, Data Quality, Data Migrations, Reporting, ERP implementations & support, Team/Project/IT Management, etc.