Showing posts with label notebook. Show all posts

17 September 2024

#️⃣Software Engineering: Mea Culpa (Part V: All-Knowing Developers are Back in Demand?)

Software Engineering Series

I’ve been reading many job descriptions lately related to my experience and curiously or not I observed that many organizations look for developers with Microsoft Dynamics experience in the CRM, respectively Finance and Operations (F&O) and Business Central (BC) areas. It’s a good sign that the adoption of Microsoft solutions for CRM and ERP increases, especially when one considers the progress made in the BI and AI areas with the introduction of Microsoft Fabric, which gives Microsoft a considerable boost. Conversely, it seems that the "developers are good for everything" syntagma is back, at least from what one reads in job descriptions. 

Of course, it’s useful to have an inhouse developer who can address all the aspects of an implementation, though that’s a lot to ask considering the different non-programming areas that need to be addressed. It’s true that a developer with experience can handle Requirements, Data and Process Management, respectively Data Migrations and Business Intelligence topics, though if one considers that each of the topics can easily become a full-time job before, during and post-project implementations. I’ve been there and I (hopefully) know that the jobs imply. Even if an experienced programmer can easily handle the different aspects, there will be also times when all the topics combined will be too much for a person!

It's not a novelty that job descriptions are treated like Christmas lists, but it’s difficult to differentiate between essential and nonessential skillset. I read many jobs descriptions lately in which among a huge list of demands, one of the requirements is to program in the F&O framework, sign that D365 programmers are in high demand. I worked for many years as programmer and Software Engineer, respectively in the BI area, where SQL and non-SQL code is needed. Even if I can understand the code in F&O, does it make sense to learn now to program in X++ and the whole framework? 

It's never too late to learn new tricks, respectively another programming language and/or framework. It even helps to provide better solutions in other areas, though frankly I would invest my time in other areas, and AI-related topics like AI prompting or Data Science seem to be more interesting in the long term, especially when they are already in demand!

There seems to be a tendency for Data Science professionals to do everything, building their own solutions, ignoring the experience accumulated respectively the data models built in BI and Data Analytics areas, as if the topics and data models are unrelated! It’s also true that AI-modeling comes with its own requirements in what concerns data modeling (e.g. translating non-numeric to numeric values), though I believe that common ground can be found!

Similarly, the notebook-based programming seems to replicate logic in each solution, which occasionally makes sense, though personally I wouldn’t recommend it as practice! The other day, I was looking at code developed in Python to mimic the joining of tables, when a view with the same could be easier (re)used, maintained, read and probably more efficient, even if different engines will be used. It will be interesting to see how the mix of spaghetti solutions will evolve over time. There are developers already complaining of the number of objects used in the process by building logic for each layer from the medallion architecture! Even if it makes sense from architectural considerations, it will become a nightmare in time.

One can wonder also about nomenclature used – Data Engineer or Prompt Engineering for the simple manipulation of data between structures in data transformations, respectively for structuring the prompts for AI. I believe that engineering involves more than this, no matter the context! 

Previous Post <<||>> Next Post

07 August 2024

🧭Business Intelligence: Perspectives (Part XII: From Data to Data Models)

Business Intelligence Series

A data model can be defined as an abstract, self-contained, logical definition of the data structures available in a database or similar repositories. It’s typically an abstraction of the data structures underpinning a set of processes, procedures and business logic used for a predefined purpose. A data model can be formed also of unrelated micromodels, depicting thus various aspects of a business. 

The association between data and data models is bidirectional. Given a set of data, a data model can be built to underpin the respective data. Conversely, one can create or generate data based on a data model. However, in business setups a bidirectional relationship between data and the data model(s) underpinning them is more realistic as the business evolves. In extremis, the data model can be used to reflect a business’ needs, at least when the respective needs are addressed accordingly by extending the data model(s).

Given a set of data (e.g. the data stored in one or more spreadsheets or other type of files) there can be defined in theory multiple data models to reflect the respective data. Within a data model, the fields (aka attributes) are partitioned into a set of data entities, where a data entity is thus a nonunique grouping of attributes that attempt to define together one unitary aspect of the world. Customers, Vendors, Products, Invoices or Sales Orders are examples of such data entities, though entities can have a broader granularity (e.g. Customers can be modeled over several tables like Entity, Addresses, Contact information, etc.). 

From an operational database’s perspective, a data entity is based on one or more tables, though several entities can share some of the tables. From a BI artifact’s perspective, an entity should be easy to create from the underlying tables, with a minimal set of transformations. Ideally, the BI data model should be as close as possible to the needed entity for reporting, however an optimal solution lies usually somewhere in between. In this resides the complexity of modeling BI solutions – providing an optimal data model which can be easily built on the source tables, and which allows addressing all or at least most of the BI requirements.

In other words, we deal with two optimization problems of two distinct data models. On one side the business data model must be flexible enough to provide fast read/write operations while keeping the referential data’s granularity efficient. Conversely, a BI data model needs to abstract these entities and provide a fast way of processing the data, while making data reads extremely efficient. These perspectives must apply when we move to Microsoft Fabric too. 

The operational data layer must provide this abstraction, and in this resides the complexity of building optimal BI solutions. This is the layer at which the modeling problems need to be tackled. The challenge of BI and Analytics resides in finding an optimal data model that allows us to address most or ideally all the BI requirements. Several overlapping layers of abstraction may be built in the process.

Looking at the data modeling techniques used in notebooks and other similar solutions, data modeling has the chance of becoming a redundant practice prone to errors. Moreover, data models have a tendency of being multilayered and of being based on certain perspectives into the processes they model. Providing reliable flexible models involves finding the right view into the data for modeling aspects of the business. Database views allow us to easily model such perspectives, often in a unique way. Moving away from them just shifts the burden on the multiple solutions built around the base data, which can create other important challenges. 

Previous Post <<||>>  Next Post

07 May 2024

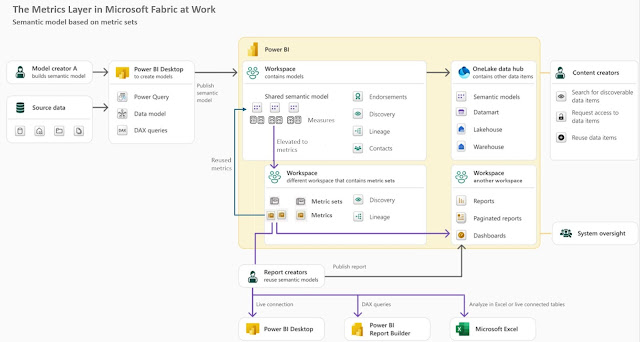
🏭🗒️Microsoft Fabric: The Metrics Layer [Notes] [new feature]

Disclaimer: This is work in progress intended to consolidate information from various sources for learning purposes. For the latest information please consult the documentation (see the links below)! 

Last updated: 07-May-2024

The Metrics Layer in Microsoft Fabric (adapted diagram)

[new feature] Metrics Layer (Metrics Store)

  • {definition}an abstraction layer available between the data store(s) and end users which allows organizations to create standardized business metrics, that are rooted in measures and are discoverable and intended for reuse
    • ⇐ {important} feature still in private preview 
  • {goal} extend existing infrastructure 
    • {benefit} leverages and extends existing features
  • {goal} provide consistent definitions and descriptions [1]
    • consistent definitions that include besides business logic additional dimensions and filters [1]
    • ⇒ {benefit} allows to standardize the metrics across the organization
    • ⇒ {benefit} enforce to enforce a SSoT
  • {goal} easy management 
    • via management views 
    • [feature] lineage 
    • [feature] source control
    • [feature] duplicate identification
    • [feature] push updates to downstream uses of the metrics 
  • {goal}searchable and discoverable metrics 
    • {feature} integration
      • based on Sempy fabric package
        • ⇐ a dataframe for storage and propagation of Power BI metadata which is part of the python-based semantic Link in Fabric
  • {goal}trust
    • [feature] trust indicators
    • {benefit} facilitates report's adoption
  • {feature} metric set 
    • {definition} a Fabric item that groups together a set of metrics into a mini-model
    • {benefit} allows to reduce the overall complexity of semantic models, while being easy to evolve and consume
    • associated with a single domain
      • ⇒ supports the data mesh architecture
    • shareable 
      • can be shared with other users
    • {action} create metric set
      • creates the actual artifact, to which metrics can be added 
  • {feature} metric
    •  {definition} a way to elevate the measures from the various semantic models existing in the organization
    • tied to the original semantic model
      • ⇒ {benefit} allows to see how a metric is used across the solutions 
    • reusable
      • can be reused in other fabric artifacts
        • new reports on the Power BI service
        • notebooks 
          • by copying the code
      • can be reused in Power BI
        • via OneLake data hub menu element
      • can be chained 
        • changes are propagated downstream 
    • materializable 
      • its output can be persisted to OneLake by saving it a delta table into a lakehouse
      • {misuse} data is persisted unnecessarily
    • {action} elevate metric
      • copies measure's definition and description
      • ⇒  implies restructuring, refactoring, moving, and testing a lot of code in the process
      • {misuse} data professionals build everything as metrics
    • {action} update metric
    • {action} add filters to metric 
    • {action} add dimensions to metric
    • {action} materialize metric 

Acronyms:
SSoT - single source of truth ()

References:
[1] Power BI Tips (2024) Explicit Measures Ep. 236: Metrics Hub, Hot New Feature with Carly Newsome (link)
[2] Power BI Tips (2024) Introducing Fabric Metrics Layer / Power Metrics Hub [with Carly Newsome] (link)

13 April 2024

📊R Language: Using the lessR Package in Microsoft Fabric's Notebooks (Test Drive)

I've started to use again the R languages for data visualizations. Discovering the lessR package, which simplifies considerably the verbose syntax of the R language by encapsulating the functionality behind simple functions, I wondered whether it can be installed in Microsoft Fabric and used from notebooks. Besides the available documentation, for learning I used also David W Berging's book on R visualizations [3].

Into a new notebook, I used one cell for each installation or package retrieval (see [1], [2]):

#installing packages
#install.packages("tidyverse") #is in Microsoft Fabric preinstalled
install.packages("lessR")

#retrieve packages from library
library("tidyverse")
library("lessR")

I attempted to read the data from a http location via the lessR Read function and it worked 

d <- Read("http://lessRstats.com/data/employee.xlsx")

head(d)

However, attempting to use any of the lessR functions used for visualization displayed only the text output and not the visualizations. No matter what I did - suppressing the text, suppressing the generation of PDF files, the result was the same. It seems to be a problem with the output device, though I'm not sure how to solve this yet. 

# supressing the text
style(quiet=TRUE)

# reenabling the text
style(quiet=FALSE)

# supressing PDF  generation
pdf(NULL)

# retrieving current device used 
options()$device

I was able to run the ggplot2 scripts from [3] though only when the lessR was also installed (each script should be run in its own cell, otherwise only the last plot is shown):

# bard charts 
ggplot(d) + geom_bar(aes(Dept)) 

# histogram
ggplot(d, aes(Salary)) + geom_histogram(binwidth=10000) 

# integrated violin/box/scatterplot
ggplot(d, aes(x="", y=Salary)) +
geom_violin(fill="gray90", bw=9500, alpha=.3) +
geom_boxplot(fill="gray75", outlier.color="black", width=0.25) +
geom_jitter(shape=16, position=position_jitter(0.05)) +
theme(axis.title.y=element_blank()) +
coord_flip()

# enhanced scatterplot 
ggplot(d, aes(Years, Salary)) + geom_point() +
geom_smooth(method=lm, color="black") +
stat_ellipse(type="norm") +
geom_vline(aes(xintercept=mean(Years, na.rm=TRUE)), color="gray70") +
geom_hline(aes(yintercept=mean(Salary), na.rm=TRUE), color="gray70")

Similar results could be obtained by using the following lessR syntax in RStudio:

# bard charts 
BarChart(Dept)

# histogram
Histogram(Salary) 

# integrated violin/box/scatterplot
Plot(Salary)

# enhanced scatterplot 
Plot(Years, Salary, enhance=TRUE)

Trying to see whether I can access the data from a lakehouse via SparkR, I've downloaded the file from the support website [3], loaded the data into an available lakehouse (e.g. UAT), respectiveley loaded the data to a new table:

-- creating the table
CREATE TABLE [dbo].[employee](
	[Name] [varchar](8000) NULL,
	[Years] [int] NULL,
	[Gender] [varchar](8000) NULL,
	[Dept] [varchar](8000) NULL,
	[Salary] [float] NULL,
	[JobSat] [varchar](8000) NULL,
	[Plan] [int] NULL,
	[Pre] [int] NULL,
	[Post] [int] NULL
) ON [PRIMARY]
GO

-- checking the data
SELECT *
FROM [dbo].[employee]

I was able to access the content of the imported file via the following script:

#access the file from lakehouse
#csv_file <- "https://onelake.dfs.fabric.microsoft.com/<file_system>/<account_name>/Files/OpenSource/employee.csv"
#csv_file <- "abfss://<file_system>.dfs.fabric.microsoft.com/<account_name>/Files/OpenSource/employee.csv"

csv_file <- "Files/OpenSource/employee.csv"

df <- read.df(csv_file, source= "csv", header = "true", inferSchema = "true")

display(df)

Initially, I wasn't able to access the table directly, though in the end I was able to retrieve the data (without and with the catalog's name):

# creating a data frame via SparkSQL
dfEmp <- sql("SELECT * FROM Employee")

head(dfEmp)

Comments:
1) Once the sessions timeout, it seems that one needs to rerun the scripts, which proves to be time-consuming as the installation takes about 5 minutes. 
2) Being able to use lessR directly in Microsoft Fabric could be a real win given its simple syntax. I run most of the tests from the book [3] plus some of the recommended scripts and the results are satisfactory. 
3) The connection via the ABFS path to the lakehouse works as well, but not via URL. 

References:
[1] Microsoft Learn - Microsoft Fabric (2023) R library management(link)
[2] lessR (2024) Data (link)
[3] David W Gerbing (2020) R Visualizations: Derive Meaning from Data
[4] CRAN=R (2024) Package lassR (link)

22 March 2024

🧭Business Intelligence: Perspectives (Part IX: Dashboards Are Dead & Other Crap)

Business Intelligence
Business Intelligence Series

I find annoying the posts that declare that a technology is dead, as they seem to seek the sensational and, in the end, don't offer enough arguments for the positions taken; all is just surfing though a few random ideas. Almost each time I klick on such a link I find myself disappointed. Maybe it's just me - having too great expectations from ad-hoc experts who haven't understood the role of technologies and their lifecycle.

At least until now dashboards are the only visual tool that allows displaying related metrics in a consistent manner, reflecting business objectives, health, or other important perspective into an organization's performance. More recently notebooks seem to be getting closer given their capabilities of presenting data visualizations and some intermediary steps used to obtain the data, though they are still far away from offering similar capabilities. So, from where could come any justification against dashboard's utility? Even if I heard one or two expert voices saying that they don't need KPIs for managing an organization, organizations still need metrics to understand how the organization is doing as a whole and taken on parts. 

Many argue that the design of dashboards is poor, that they don't reflect data visualization best practices, or that they are too difficult to navigate. There are so many books on dashboard and/or graphic design that is almost impossible not to find such a book in any big library if one wants to learn more about design. There are many resources online as well, though it's tough to fight with a mind's stubbornness in showing no interest in what concerns the topic. Conversely, there's also lot of crap on the social networks that qualify after the mainstream as best practices. 

Frankly, design is important, though as long as the dashboards show the right data and the organization can guide itself on the respective numbers, the perfectionists can say whatever they want, even if they are right! Unfortunately, the numbers shown in dashboards raise entitled questions and the reasons are multiple. Do dashboards show the right numbers? Do they focus on the objectives or important issues? Can the number be trusted? Do they reflect reality? Can we use them in decision-making? 

There are so many things that can go wrong when building a dashboard - there are so many transformations that need to be performed, that the chances of failure are high. It's enough to have several blunders in the code or data visualizations for people to stop trusting the data shown.

Trust and quality are complex concepts and there’s no standard path to address them because they are a matter of perception, which can vary and change dynamically based on the situation. There are, however, approaches that allow to minimize this. One can start for example by providing transparency. For each dashboard provide also detailed reports that through drilldown (or also by running the reports separately if that’s not possible) allow to validate the numbers from the report. If users don’t trust the data or the report, then they should pinpoint what’s wrong. Of course, the two sources must be in synch, otherwise the validation will become more complex.

There are also issues related to the approach - the way a reporting tool was introduced, the way dashboards flooded the space, how people reacted, etc. Introducing a reporting tool for dashboards is also a matter of strategy, tactics and operations and the various aspects related to them must be addressed. Few organizations address this properly. Many organizations work after the principle "build it and they will come" even if they build the wrong thing!

Previous Post <<||>> Next Post

17 February 2024

🧭🏭Business Intelligence: Microsoft Fabric (Part I: Notebooks)

Business Intelligence Series
Business Intelligence Series 

When several technologies make their entrance in a data-related field like Data Warehousing, Data Analitics or Data Science, one is forced to understand how the respective technologies can be used or misused, respectively what's their place in the bigger picture. Microsoft Fabric introduces several important technologies that will change the way data are stored, processed and consumed. 

The first important technology is the notebook - a web document-like cell-based container for writing and executing code in a collaborative manner. The concept is not new, Jupyter notebooks have been around for almost a decade. In Microsof Fabric, notebooks support multiple languages, from which a default one applies to the whole notebook, while on cell level any of the supported languages can be used. 

One can execute a single cell, multiple cells or the entire notebook in a sequential manner, mix languages for the various operations - load, transform, save, and visualize data when needed. Notebooks can be parametrized and run via the homonymous activity in Data Factory pipelines, automating thus data processing. Probably more functionality is to come. 

Data engineers seems to have great flexibility, though usually flexibility implies constraints and/or mischiefs in other areas. I see for example in presentations the overuse of temporary data objects (mainly views) in Spark SQL as part of complex logic. That's acceptable during prototyping, though such code becomes a danger as soon the logic is deployed into production. Data objects should be created outside of the logic that uses them and should be treated as artifacts, with version control and proper documentation. It's maybe true that temporary objects reduce the volume of objects in the metastore, though is this the way to go?

Temporary objects tend to lead to wheel's reinvention or they get duplicated across multiple notebooks, which can easily create a maintenance nightmare. One needs to consider that the business logic changes a lot, the requirements and the data sources change, and on the long term, the cost of maintaining the code can easily overweight the benefits. 

Notebooks remind me of the beginnings of web programming when HTML was mixed up with client scripting languages like VB Script or Javascript, CSS, respectively server-side scripting languages. It was kind of a spaghetti code, modified repeatedly by multiple programmers, unendingly duplicated, and through a miracle it worked, until it stopped working unexpectedly in strangest situations. The strangest part was when after removing  commented code from a section made the code run again. 

The debugging of another person's code was a nightmare. Code developed by two people for similar purposes was looking unrecognizable different in terms of structure, programming techniques and layout. The technical debt was high, increasing in exponential manner. One was aware that the code needed refactoring, though there were more important things to do or no time allocated for it.

In the meantime the maturity of programming languages, frameworks, methodologies, best practices, and hopefully of programmers improved the overall quality of software (at least on average). Thinking of software from an Engineer's perspective improved the efficiency and effectiveness of a programmer's endeavor. The average programmer is able to write quality code, though there's a considerable minimum of "engineering" knowledge involved beside the mere knowledge of languages and tools. 

Notebooks are good up to a point, beyond which one needs to take a step back, restructure, move the code where it belongs, take a few more steps back and review the good practices and their application, disseminate the knowledge inside the team and use it in the next iterations, respectively refractor the code when needed! Hopefully, people learned from the mistakes of the past. 

Resources:
[1] Microsoft Learn (2023) How to use Microsoft Fabric notebooks (link

07 February 2024

💎🏭SQL Reloaded: Microsoft Fabric's Delta Tables in Action - Views and other Data Objects

One reads in the training material that the SQL Endpoint provides a read-only experience [1], meaning that no data can be written back to the delta lake tables. Playing with the metadata available in Spark SQL via Notebooks and the SQL Endpoint (see post), I realized that there is more to the statement! Even if one can query via the SQL Endpoint only delta tables, this doesn't mean that one can't build a semantic model on top of it, much like one was able to do via the Serverless SQL pool in Azure Synapse.

In Spark one can create via SQL, PySpark and the other supported languages views and functions, though they will not be available to the SQL Endpoint! To use the data generated in the process, the respective data needs to be saved to delta tables. Conversely, one can still create views, functions and stored procedures via the SQL Endpoint though the objects won't be available in Spark SQL! 

This has important implications, though in this post let's focus on the syntax and create several objects for testing purposes in the two environments. I'll use the Assets delta table created in a previous post. The Spark SQL code should be run in a notebook (e.g. one cell per group of statements), while the code for the SQL Endpoint should be run in SQL Server Management Studio.

Views

/* test view's creation in the SQL Endpoint */

-- drop the test view 
DROP VIEW IF EXISTS dbo.vAssets_Microsoft2;
GO

-- create the test view
CREATE VIEW dbo.vAssets_Microsoft2
AS
--Microsoft assets
SELECT Id, CreationDate, Vendor, Asset, Model, Owner, Tag, Quantity
FROM dbo.Assets
WHERE Vendor = 'Microsoft';
GO

-- test the viwe
SELECT *
FROM dbo.vAssets_Microsoft2;

/* test view's creation in Spark SQL */

-- drop test view 
DROP VIEW IF EXISTS vAssets_Microsoft;

-- create test view
CREATE VIEW vAssets_Microsoft COMMENT 'Microsoft assets in scope (view)'
AS
SELECT Id, CreationDate, Vendor, Asset, Model, Owner, Tag, Quantity
FROM assets
WHERE Vendor = 'Microsoft';

-- review data
SELECT *
FROM vAssets_Microsoft;

Table-Valued Functions

/* test function's creation in the SQL Endpoint */

-- drop the test function 
DROP FUNCTION IF EXISTS dbo.fAssets_Microsoft2;
GO

-- create the test function
CREATE FUNCTION dbo.fAssets_Microsoft2(
    @Vendor nvarchar(max))
RETURNS TABLE 
AS 
RETURN (
    SELECT Id, CreationDate, Vendor, Asset, Model, Owner, Tag, Quantity
    FROM dbo.Assets
    WHERE Vendor = @Vendor
);
GO

-- test the function
SELECT *
FROM dbo.fAssets_Microsoft2('Microsoft');

SELECT *
FROM dbo.fAssets_Microsoft2('Dell');

Unfortunately, the Spark SQL code doesn't seem to work, its execution returning a PARSE_SYNTAX_ERROR error no matter how simple the code was (see also [2]).
 
/* test function's creation in Spark SQL */

-- drop test function 
DROP FUNCTION IF EXISTS fAssets_Microsoft;

-- create test function
CREATE FUNCTION fAssets_Microsoft(
    pVendor string)
RETURNS TABLE
AS 
RETURN 
    SELECT Id, CreationDate, Vendor, Asset, Model, Owner, Tag, Quantity
    FROM assets
    WHERE Vendor = pVendor;

-- review data
SELECT *
FROM fAssets_Microsoft('Microsoft');

Stored Procedure

Stored procedures aren't available in Spark SQL, though this doesn't mean that we can't test the code in the SQL Endpoint:

/* test procedure's creation in the SQL Endpoint */

-- drop the test procedure 
DROP PROCEDURE IF EXISTS dbo.spAssets_Microsoft2;
GO

-- create the test procedure
CREATE PROCEDURE dbo.spAssets_Microsoft2(
@Vendor nvarchar(max) = NULL)
AS
--Microsoft assets
SELECT Id, CreationDate, Vendor, Asset, Model, Owner, Tag, Quantity
FROM dbo.Assets
WHERE Vendor = IsNull(@Vendor, Vendor);
GO

-- test the procedure
EXEC dbo.spAssets_Microsoft2 'Microsoft';
EXEC dbo.spAssets_Microsoft2 'Dell';
EXEC dbo.spAssets_Microsoft2;

Notes:
1) I observed in documentation and some presentations that the common practice of prefixing data objects based on their type is seldom considered. I still find it useful when building solutions, even if object's type can be derived from the context and/or metadata. 
2) The examples were chosen to test the minimal functionality so that the differences between the two platforms are minimal - using the dbo schema and the GO command in the SQL Endpoint, COMMENT in Spark SQL. However, as soon specific functionality is used, extra code is needed to mitigate the differences.
3) The names between environments were kept different, just in case one needs to test objects' availability between platforms.

Happy coding!

Previous Post  <<||>>  Next Post

Resources:
[1] Microsoft Learn (2023) Work with Delta Lake tables in Microsoft Fabric (link)
[2] Databricks (2023) CREATE FUNCTION (SQL and Python) (link)

06 February 2024

💎🏭SQL Reloaded: Microsoft Fabric's Delta Tables in Action - Data Objects Metadata

There seem to be four main sources for learning about the functionality available in the Delta Lake especially in what concerns the SQL dialect used by the Spark SQL: Databricks [1], Delta Lake [2], Azure Databricks [3], respectively the Data Engineering documentation in Microsoft Fabric [4] and the afferent certification material. Unfortunately, the latter focuses more on PySpark. So, until Microsoft addresses the gap, one can consult the other sources, check what's working and built thus the required knowledge for handling the various tasks. 

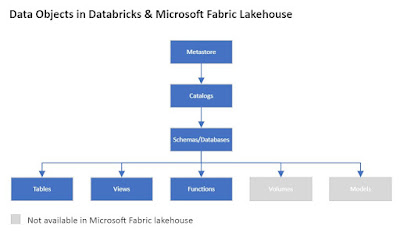
First of all, it's important to understand which the data objects available in Microsoft Fabric are. Based on [5] I could identify the following hierarchy:


According to the same source [5] the metastore contains all of the metadata that defines data objects in the lakehouse, while the catalog is the highest abstraction in the lakehouse. The database, called also a schema, keeps its standard definition - a collection of data objects, such as tables or views (aka relations) and functions. The tables, views and functions keep their standard definitions. Except the metastore, these are also the (securable) objects on which permissions can be set. 

One can explore the structure in Spark SQL by using the SHOW command:

-- explore the data objects from the lakehouse
SHOW CATALOGS;

SHOW DATABASES;

SHOW SCHEMAS;

SHOW CATALOGS;

SHOW VIEWS;

SHOW TABLES;

SHOW FUNCTIONS;

Moreover, one can list only the objects from an object from the parent (e.g. the tables existing in a database):
 
-- all tables from a database
SHOW TABLES FROM Testing;

-- all tables from a database matching a pattern
SHOW TABLES FROM Testing LIKE 'Asset*';

-- all tables from a database matching multiple patterns
SHOW TABLES FROM Testing LIKE 'Asset*|cit*';

Notes:
1) Same syntax applies for views and functions, respectively for the other objects in respect to their parents (from the hierarchy). 
2) Instead of FROM one can use the IN keyword, though I'm not sure what's the difference given that they seem to return same results.
3) For databases and tables one can use also the SQL Server to export the related metadata. Unfortunately, it's not the case for views and functions because when the respective objects are created in Spark SQL, they aren't visible over the SQL Endpoint, and vice versa.

4) Given that there are multiple environments that deal with delta tables, to minimize the confusion that might result from their use, it makes sense to use database as term instead of schema. 

References:
[1] Databricks (2024) SQL language reference (link)
[2] Delta Lake (2023) Delta Lake documentation (link)
[3] Microsoft Learn (2023) Azure Databricks documentation (link)
[4] Microsoft Learn (2023) Data Engineering documentation in Microsoft Fabric (link)
[5] Databricks (2023) Data objects in the Databricks lakehouse (link)

💎🏭SQL Reloaded: Microsoft Fabric's Delta Tables in Action - Table Metadata II (Updating a table's COMMENT attributes)

While using the DESCRIBE TABLE metadata I observed that its output shown also a Comment attribute which was NULL for all the columns. Browsing through the Databricks documentation (see [1]), I found that the Comment can be provided in a delta table's definition as follows (code to be run in a notebook):

-- drop the table (if already exists)
DROP TABLE IF EXISTS Assets2;

--create the table
CREATE TABLE Assets2 (
 Id int NOT NULL COMMENT 'Asset UID',
 CreationDate timestamp NOT NULL COMMENT 'Creation Date',
 Vendor string NOT NULL COMMENT 'Vendors name',
 Asset string NOT NULL COMMENT 'Asset type',
 Model string NOT NULL COMMENT 'Asset model',
 Owner string NOT NULL COMMENT 'Current owner',
 Tag string NOT NULL COMMENT 'Assets tag',
 Quantity decimal(13, 2) NOT NULL COMMENT 'Quantity'
) 
USING DELTA
COMMENT 'Vendor assets';

-- show table's definition
DESCRIBE TABLE Assets2;

-- show table's details
DESCRIBE DETAIL Assets;

So, I thought there must be a way to update Assets table's definition as well. And here's the solution split into two steps, as different syntax is required for modifying the columns, respectively the table:

-- modify columns' COMMENT for an existing table
ALTER TABLE Assets ALTER COLUMN ID COMMENT 'Asset UID';
ALTER TABLE Assets ALTER COLUMN CreationDate COMMENT 'Creation Date';
ALTER TABLE Assets ALTER COLUMN Vendor COMMENT 'Vendors name';
ALTER TABLE Assets ALTER COLUMN Asset COMMENT 'Asset type';
ALTER TABLE Assets ALTER COLUMN Model COMMENT 'Asset model';
ALTER TABLE Assets ALTER COLUMN Owner COMMENT 'Current owner';
ALTER TABLE Assets ALTER COLUMN Tag COMMENT 'Assets tag';
ALTER TABLE Assets ALTER COLUMN Quantity COMMENT 'Quantity';

-- show table's definition
DESCRIBE TABLE Assets;

The operation generated a log file with the following content:

{"commitInfo":{"timestamp":1707180621522,"operation":"CHANGE COLUMN","operationParameters":{"column":"{\"name\":\"Quantity\",\"type\":\"decimal(13,2)\",\"nullable\":false,\"metadata\":{\"comment\":\"Quantity\"}}"},"readVersion":13,"isolationLevel":"Serializable","isBlindAppend":true,"operationMetrics":{},"engineInfo":"Apache-Spark/3.4.1.5.3-110807746 Delta-Lake/2.4.0.8","txnId":"42590d18-e04a-4fb2-bbfa-94414b23fb07"}}
{"metaData":{"id":"83e87b3c-28f4-417f-b4f5-842f6ba6f26d","description":"Vendor assets","format":{"provider":"parquet","options":{}},"schemaString":"{\"type\":\"struct\",\"fields\":[
{\"name\":\"Id\",\"type\":\"integer\",\"nullable\":false,\"metadata\":{\"comment\":\"Asset UID\"}},
{\"name\":\"CreationDate\",\"type\":\"timestamp\",\"nullable\":false,\"metadata\":{\"comment\":\"Creation Date\"}},
{\"name\":\"Vendor\",\"type\":\"string\",\"nullable\":false,\"metadata\":{\"comment\":\"Vendors name\"}},
{\"name\":\"Asset\",\"type\":\"string\",\"nullable\":false,\"metadata\":{\"comment\":\"Asset type\"}},
{\"name\":\"Model\",\"type\":\"string\",\"nullable\":false,\"metadata\":{\"comment\":\"Asset model\"}},
{\"name\":\"Owner\",\"type\":\"string\",\"nullable\":false,\"metadata\":{\"comment\":\"Current owner\"}},
{\"name\":\"Tag\",\"type\":\"string\",\"nullable\":false,\"metadata\":{\"comment\":\"Assets tag\"}},
{\"name\":\"Quantity\",\"type\":\"decimal(13,2)\",\"nullable\":false,\"metadata\":{\"comment\":\"Quantity\"}}]}","partitionColumns":[],"configuration":{},"createdTime":1707149934697}}

And the second step (see [2]):

-- modify a table's COMMENT
COMMENT ON TABLE Assets IS 'Vendor assets';

-- describe table's details
DESCRIBE DETAIL Assets;

    The operation generated a log file with the following content:

{"commitInfo":{"timestamp":1707180808138,"operation":"SET TBLPROPERTIES","operationParameters":{"properties":"{\"comment\":\"Vendor assets\"}"},"readVersion":14,"isolationLevel":"Serializable","isBlindAppend":true,"operationMetrics":{},"engineInfo":"Apache-Spark/3.4.1.5.3-110807746 Delta-Lake/2.4.0.8","txnId":"21c315b5-a81e-4107-8a19-6256baee7bd5"}}
{"metaData":{"id":"83e87b3c-28f4-417f-b4f5-842f6ba6f26d","description":"Vendor assets","format":{"provider":"parquet","options":{}},"schemaString":"{\"type\":\"struct\",\"fields\":[
{\"name\":\"Id\",\"type\":\"integer\",\"nullable\":false,\"metadata\":{\"comment\":\"Asset UID\"}}
,{\"name\":\"CreationDate\",\"type\":\"timestamp\",\"nullable\":false,\"metadata\":{\"comment\":\"Creation Date\"}}
,{\"name\":\"Vendor\",\"type\":\"string\",\"nullable\":false,\"metadata\":{\"comment\":\"Vendors name\"}}
,{\"name\":\"Asset\",\"type\":\"string\",\"nullable\":false,\"metadata\":{\"comment\":\"Asset type\"}}
,{\"name\":\"Model\",\"type\":\"string\",\"nullable\":false,\"metadata\":{\"comment\":\"Asset model\"}}
,{\"name\":\"Owner\",\"type\":\"string\",\"nullable\":false,\"metadata\":{\"comment\":\"Current owner\"}}
,{\"name\":\"Tag\",\"type\":\"string\",\"nullable\":false,\"metadata\":{\"comment\":\"Assets tag\"}}
,{\"name\":\"Quantity\",\"type\":\"decimal(13,2)\",\"nullable\":false,\"metadata\":{\"comment\":\"Quantity\"}}]}","partitionColumns":[],"configuration":{},"createdTime":1707149934697}}

Notes:
1) Don't forget to remove the Assets2 table!
2) Updating the COMMENT for a single delta table is simple, though for updating the same for a list of tables might be task for a PySpark job. It makes sense to provide the respective metadata from the start, when that's possible. Anyway, the information should be available in lakehouse's data dictionary.
3) One can reset the COMMENT to NULL or to an empty string.

Happy coding!

Resources:
[1] Databaricks (2023) ALTER TABLE (link)
[2] Databaricks (2023) COMMENT ON (link)

💎🏭SQL Reloaded: Microsoft Fabric's Delta Tables in Action - Table Metadata I (General Information)

In a previous post I've created a delta table called Assets. For troubleshooting and maintenance tasks it would be useful to retrieve a table's metadata - properties, definition, etc. There are different ways to extract the metadata, depending on the layer and method used.

INFORMATION_SCHEMA in SQL Endpoint

Listing all the delta tables available in a Lakehouse can be done using the INFORMATION_SCHEMA via the SQL Endpoint:

-- retrieve the list of tables
SELECT * 
FROM INFORMATION_SCHEMA.TABLES
WHERE TABLE_TYPE = 'BASE TABLE'
ORDER BY TABLE_SCHEMA  

Output:
TABLE_CATALOG TABLE_SCHEMA TABLE_NAME TABLE_TYPE
Testing dbo city BASE TABLE
Testing dbo assets BASE TABLE

The same schema can be used to list columns' definition:
 
-- retrieve column metadata
SELECT TABLE_CATALOG
, TABLE_SCHEMA
, TABLE_NAME
, COLUMN_NAME
, ORDINAL_POSITION
, DATA_TYPE
, CHARACTER_MAXIMUM_LENGTH
, NUMERIC_PRECISION
, NUMERIC_SCALE
, DATETIME_PRECISION
, CHARACTER_SET_NAME
FROM INFORMATION_SCHEMA.COLUMNS
WHERE TABLE_NAME = 'assets'
ORDER BY ORDINAL_POSITION

Note:
Given that the INFORMATION_SCHEMA is an ANSI-standard schema for providing metadata about a database's objects (including views, schemata), probably this is the best way to retrieve general metadata as the above (see [3]). More information over the SQL Endpoint can be obtained by querying directly the SQL Server metadata.

Table's Properties

The Delta Lake documentation reveals that a table's properties can be retrieved via the DESCRIBE command, which can be used in a notebook's cell (see [1] for attributes' definition):

-- describe table's details
DESCRIBE DETAIL Assets;

Output (transposed):
Attribute Value
format delta
id 83e87b3c-28f4-417f-b4f5-842f6ba6f26d
name spark_catalog.testing.assets
description NULL
location abfss://[…]@onelake.dfs.fabric.microsoft.com/[…]/Tables/assets
createdAt 2024-02-05T16:18:54Z
lastModified 2024-02-05T16:29:52Z
partitionColumns
numFiles 1
sizeInBytes 3879
properties [object Object]
minReaderVersion 1
minWriterVersion 2
tableFeatures appendOnly,invariants

One can export the table metadata also from the sys.tables via the SQL Endpoint, though will be considered also SQL Server based metadata:

-- table metadata
SELECT t.object_id
, schema_name(t.schema_id) schema_name
, t.name table_name
, t.type_desc
, t.create_date 
, t.modify_date
, t.durability_desc
, t.temporal_type_desc
, t.data_retention_period_unit_desc
FROM sys.tables t
WHERE name = 'assets'

Output (transposed):
Attribute Value
object_id 1264723558
schema_name dbo
table_name assets
type_desc USER_TABLE
create_date 2024-02-05 16:19:04.810
modify_date 2024-02-05 16:19:04.810
durability_desc SCHEMA_AND_DATA
temporal_type_desc NON_TEMPORAL_TABLE
data_retention_period_unit_desc INFINITE

Note:
1) There seem to be thus two different repositories for storing the metadata, thing reflected also in the different timestamps.

Table's Definition 

A table's definition can be easily exported via the SQL Endpoint in SQL Server Management Studio. Multiple tables' definition can be exported as well via the Object explorer details within the same IDE. 

In Spark SQL you can use the DESCRIBE TABLE command:

-- show table's definition
DESCRIBE TABLE Assets;

Output:
col_name data_type comment
Id int NULL
CreationDate timestamp NULL
Vendor string NULL
Asset string NULL
Model string NULL
Owner string NULL
Tag string NULL
Quantity decimal(13,2) NULL

Alternatively, you can use the EXTENDED keyword with the previous command to show further table information:
 
-- show table's definition (extended)
DESCRIBE TABLE EXTENDED Assets;

Output (only the records that appear under '# Detailed Table Information'):
Label Value
Name spark_catalog.testing.assets
Type MANAGED
Location abfss://[...]@onelake.dfs.fabric.microsoft.com/[...]/Tables/assets
Provider delta
Owner trusted-service-user
Table Properties [delta.minReaderVersion=1,delta.minWriterVersion=2]

Note that the table properties can be listed individually via the SHOW TBLPROPERTIES command:
 
--show table properties
SHOW TBLPROPERTIES Assets;

A column's definition can be retrieved via a DESCRIBE command following the syntax:

-- retrieve column metadata
DESCRIBE Assets Assets.CreationDate;

Output:
info_name info_value
col_name CreationDate
data_type timestamp
comment NULL

In PySpark it's trickier to retrieve a table's definition (code adapted after Dennes Torres' presentation at Toboggan Winter edition 2024):

%%pyspark
import pyarrow.dataset as pq
import os
import re

def show_metadata(file_path, table_name):
    #returns a delta table's metadata 

    print(f"\{table_name}:")
    schema_properties = pq.dataset(file_path).schema.metadata
    if schema_properties:
        for key, value in schema_properties.items():
            print(f"{key.decode('utf-8')}:{value.decode('utf-8')}")
    else:
        print("No properties available!")

#main code
path = "/lakehouse/default/Tables"
tables = [f for f in os.listdir(path) if re.match('asset',f)]

for table in tables:
    show_metadata(f"/{path}/"+ table, table)

Output:
\assets:
org.apache.spark.version:3.4.1
org.apache.spark.sql.parquet.row.metadata:{"type":"struct","fields":[
{"name":"Id","type":"integer","nullable":true,"metadata":{}},
{"name":"CreationDate","type":"timestamp","nullable":true,"metadata":{}},
{"name":"Vendor","type":"string","nullable":true,"metadata":{}},
{"name":"Asset","type":"string","nullable":true,"metadata":{}},
{"name":"Model","type":"string","nullable":true,"metadata":{}},
{"name":"Owner","type":"string","nullable":true,"metadata":{}},
{"name":"Tag","type":"string","nullable":true,"metadata":{}},
{"name":"Quantity","type":"decimal(13,2)","nullable":true,"metadata":{}}]}
com.microsoft.parquet.vorder.enabled:true
com.microsoft.parquet.vorder.level:9

Note:
One can list the metadata for all tables by removing the filter on the 'asset' table:

tables = os.listdir(path)

Happy coding!

References:
[1] Delta Lake (2023) Table utility commands (link)
[2] Databricks (2023) DESCRIBE TABLE (link)
[3] Microsoft Learn (2023) System Information Schema Views (link)

Related Posts Plugin for WordPress, Blogger...

About Me

My photo
Koeln, NRW, Germany
IT Professional with more than 24 years experience in IT in the area of full life-cycle of Web/Desktop/Database Applications Development, Software Engineering, Consultancy, Data Management, Data Quality, Data Migrations, Reporting, ERP implementations & support, Team/Project/IT Management, etc.