Showing posts with label buffers. Show all posts

31 December 2023

SQL Server: The Buffer Pool (Notes)

Disclaimer: This is work in progress intended to consolidate information from various sources (some unfortunately not available anymore).

Buffer Pool  [aka BP, BPool]

  • main memory component in SQL Server [2]
    • ⇐ preferred memory allocator for the whole server [1]
    • ⇐ the biggest consumer of SQL Server 
  • area of memory that SQL Server used to store
      • cached data (aka data pages)
      • cached execution plans 
      • algebrizer trees for views, constraints and defaults
      • lock memory
      • ⇐ anything with a non-zero value in sys.dm_os_memory_clerks.single_pages_kb
    • ⇐ caching data in the buffer pool reduces the load on the I/O subsystem and improves performance [6]
    • ⇐ all pages must be copied into the buffer pool before they can be used in a query
      •  ⇒ it is needed to scan the buffer pool for a number of operations [3]
    • single-page allocator
      • it commits and decommits memory blocks of 8KB granularity only
    • manages disk I/O functions for bringing data and index pages into the data cache so data can be shared among users [2]
    • all memory not used by another memory component remains in the buffer pool to be used as a data cache for pages read in from the database files on disk [2]
      • when other components require memory, they can request a buffer from the buffer pool [2]
        • most of the buffers taken from the buffer pool for other memory components go to other kinds of memory caches [2]
      • ⇐ they can only get blocks of 8KB in size [1]
        • these blocks are not continues in memory[1]
        • allocation for large buffers will be satisfied by memory node's multi-page allocator or by virtual allocator [1]
          • ⇒ memory will be allocated outside of Buffer Pool [1]
        • BP can be used as underneath memory manager for SQL Server components as long as they allocate buffers of 8KB [1]
          • pages allocated from BP are referred as stolen[1]
    • first decides how much of VAS it needs to reserve for its usage (aka target memory)
      • decision based on internal memory requirements and external memory state
      • it calculates its target amount of memory it thinks it should commit before it can get into memory pressure [1]
        • ⇐ to keep the system out of paging the target memory is constantly recalculated [1]
        • {restriction} the target memory can't exceed max memory that represents max server memory settings [1]
        • even if the min server memory equals the max server memory BP commits its memory on demand [1]
          • ⇐ monitor the corresponding profiler event to observe this behavior [1]
    • reserves all of it right a way
        • ⇐ check monitor SQL Server's virtual bytes from perfmon or use vasummary view to observe this behavior 
        • ⇐ normally can't get all the needed memory in one region
          • ⇒ several large regions reserved ← by design behavior 
    • commits pages on demand
  • during startup the memory manager configures BP to be SQLOS's single page allocator
    • from that point on all dynamic single page allocations are provided by BP[1]
  • has its own memory clerk
    • is leveraged to respond to external and VAS memory pressure only [47]
  • leverages only Virtual and AWE SQLOS's interfaces
    • never uses any type of page allocator from SQLOS [1]
  • {operation} dropping buffers 
    • likely results in some degree of performance degradation
      • ⇐ any subsequent query executions will have to reread the data from the database files increasing I/O
    • via: DBCC DROPCLEANBUFFERS
  • {concept} page
    • the fundamental unit of data storage in SQL Server
  • {concept} buffer
    • page in memory that's the same size as a data or index page [2]
      • ⇐ page frame that can hold one page from a database [2]
  • {concept} buffer pool scan
    • common internal operation that iterates through the entire buffer descriptor array to find any buffers that belong to a specific database [3]
    • [<SQL Server 2022] serial operation
      • on large memory machines operations that require scanning the buffer pool can be slow [3]
        • ⇐ the larger the machine, the greater the impact 
        • ⇐ it doesn’t necessarily matter about the size of the operation [3]
    • [SQL Server 2022] {feature}Buffer Pool Parallel Scan
      • parallelized by utilizing multiple cores
        • adds processing power to scan the buffer pool more efficiently [3]
          • ⇐ benefits both small and large database operations on larger memory machines
            • 10-30x improvement in executions
            • customers running mission-critical OLTP, hosted service providers, and data warehouse environments will witness the most improvements in overall processing speed [3]
          • uses one task per 8 million buffers (64 GB) 
            • ⇐ a serial scan will still be used if there are less than 8 million buffers [3]
        • uses buffer pool scan diagnostics to improve supportability and insights with new buffer pool scan events [3]
      • can significantly improve the performance of database workloads
        • operations benefiting from it
          • database startup/shutdown
          • creating a new database
          • file drop operations
          • backup/restore operations
          • Always On failover events
          • DBCC CHECKDB and DBCC Check Table
          • log restore operations
          • other internal operations (e.g., checkpoint) 
References:
[1] Slava Oaks (2005) SQLOS's memory manager and SQL Server's Buffer Pool (link) [something similar seems to be available here]
[2] Kalen Delaney (2006) Inside Microsoft® SQL Server™ 2005: The Storage Engine
[3] Microsoft SQL Server Blog (2022) Improve scalability with Buffer Pool Parallel Scan in SQL Server 2022, by David Pless (link)
[4] Microsoft learn (2022) Operations that trigger a buffer pool scan may run slowly on large-memory computers (link)
[5] Microsoft Docs (2023) DBCC TRACEON - Trace Flags (link)
[6] Dmitri Korotkevitch (2015) Expert SQL Server: In-Memory OLTP
[7] Slava Oaks (2005) SQLOS's memory manager: responding to memory pressure (link)

06 July 2020

SQL Server Administration: Undocumented III (SQL Server CPU Utilization via the Ring Buffer)

Introduction

If no proper monitoring solution of the SQL Server and the hosting server is in place to review the CPU utilization, one can use the Scheduler Monitor buffer provided by the undocumented sys.dm_os_ring_buffers data management view (DMV). Introduced with SQL Server 2005, the DMV provides significant amount of diagnostic memory information in XML form via several buffers: Resource Monitor, Out-of-Memory, Memory Broker, Buffer Pool, respectively Scheduler Monitor buffer [2]. A ring buffer is a recorded response to a notification [1].

The view changed between the various versions of SQL Server, while with the introduction of Always On availability groups in SQL Server 2017 further buffer rings were made available (see [5]).

Warning:
According to Microsoft (see [4] the sys.dm_os_ring_buffers is provided only for information purposes, the future compatibility post SQL Server 2019 being not guaranteed!

Querying the Scheduler Monitor Buffer

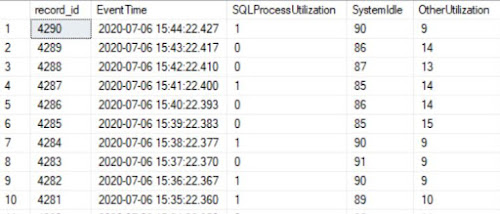
Within the Scheduler Monitor buffer, the DMV stores a history of 4 hours uptime with minute by minute data points (in total 256 entries) with the CPU utilization for the SQL Server, other processes, respectively the system idle time as percentages. It allows thus to identify the peaks in CPU utilization and thus to determine the intervals of focus for further troubleshooting. As the data are stored within an XML structure, the values can be queried via the XQuery syntax as follows: 

-- cpu utilization for SQL Server and other applications
DECLARE @ts_now bigint = (SELECT cpu_ticks/(cpu_ticks/ms_ticks)
        FROM sys.dm_os_sys_info); 

SELECT DAT.record_id
, DAT.EventTime
, DAT.SQLProcessUtilization 
, DAT.SystemIdle 
, 100 - (DAT.SystemIdle + DAT.SQLProcessUtilization) OtherUtilization
FROM ( 
	SELECT record.value('(./Record/@id)[1]', 'int') record_id
	, record.value('(./Record/SchedulerMonitorEvent/SystemHealth/SystemIdle)[1]', 'int') SystemIdle 
	, record.value('(./Record/SchedulerMonitorEvent/SystemHealth/ProcessUtilization)[1]', 'int') SQLProcessUtilization
	, EventTime 
	FROM ( 
		SELECT DATEADD(ms, -1 * (@ts_now - [timestamp]), GETDATE()) EventTime
		, [timestamp]
		, CONVERT(xml, record) AS [record] 
		FROM sys.dm_os_ring_buffers 
		WHERE ring_buffer_type = N'RING_BUFFER_SCHEDULER_MONITOR' 
		  AND record LIKE N'%<SystemHealth>%') AS x 
	) AS DAT
ORDER BY DAT.record_id DESC;

If the SQL Server is not busy as all, the SQL Server utilization time may tend to 0%, while the system idle time to 90%. (It's the case of my SQL Server lab.)

CPU Utilization for my home lab
CPU Utilization for my home SQL Server lab

Notes:
If the server was restarted within the last 4 hours, then the points will have a gap between two readings corresponding to the downtime interval.
The query is supposed to run also on Linux machines, though the SystemIdle time will be 0. One can thus consider the SQL and non-SQL CPU utilization.

Storing the History

The above query can be run on a regular basis (e.g. every 3-4 hours) via a SSIS package and push the data into a table for historical purposes. Because is needed to have a continuous history of the readings, it's better if the gap between runs is smaller than the 4 hours. No matter of the approach used is better to check for overlappings when storing the data:

-- dropping the table
-- DROP TABLE IF EXISTS dbo.T_RingBufferReadings 

-- reinitilizing the history
-- TRUNCATE TABLE dbo.T_RingBufferReadings

-- creating the table
CREATE TABLE dbo.T_RingBufferReadings (
  Id bigint IDENTITY (1,1) NOT NULL
, RecordId bigint 
, EventTime datetime2(3) NOT NULL
, SQLProcessUtilization int NOT NULL
, SystemIdle int NOT NULL
, OtherUtilization int NOT NULL
)


-- reviewing the data
SELECT *
FROM dbo.T_RingBufferReadings 
ORDER BY EventTime DESC

If there are many records, to improve the performance, one can create also an index, which can include the reading points as well:

-- creating a unique index with an include 
CREATE UNIQUE NONCLUSTERED INDEX [UI_T_RingBufferReadings_EventTime] ON dbo.T_RingBufferReadings
(
	EventTime ASC,
    RecordId ASC
) INCLUDE (SQLProcessUtilization, SystemIdle, OtherUtilization)
GO

The above query based on the DMV becomes:

-- cpu utilization by SQL Server and other applications
DECLARE @ts_now bigint = (SELECT cpu_ticks/(cpu_ticks/ms_ticks)
        FROM sys.dm_os_sys_info); 

INSERT INTO dbo.T_RingBufferReadings
SELECT record_id
, DAT.EventTime
, DAT.SQLProcessUtilization 
, DAT.SystemIdle 
, 100 - (DAT.SystemIdle + DAT.SQLProcessUtilization) OtherUtilization
FROM ( 
	SELECT record.value('(./Record/@id)[1]', 'int') record_id
	, record.value('(./Record/SchedulerMonitorEvent/SystemHealth/SystemIdle)[1]', 'int') SystemIdle 
	, record.value('(./Record/SchedulerMonitorEvent/SystemHealth/ProcessUtilization)[1]', 'int') SQLProcessUtilization
	, EventTime 
	FROM ( 
		SELECT DATEADD(ms, -1 * (@ts_now - [timestamp]), GETDATE()) EventTime
		, [timestamp]
		, CONVERT(xml, record) AS [record] 
		FROM sys.dm_os_ring_buffers 
		WHERE ring_buffer_type = N'RING_BUFFER_SCHEDULER_MONITOR' 
		  AND record LIKE N'%<SystemHealth>%') AS x 
	) AS DAT
	LEFT JOIN dbo.T_RingBufferReadings RBR
	  ON DAT.record_id = RBR.Recordid 
WHERE RBR.Recordid IS NULL
ORDER BY DAT.record_id DESC;

Note:
A ServerName column can be added to the table if is needed to store the values for different SQL Servers. Then the LEFT JOIN has to consider the new added column. 
Either of the two queries can be used to display the data points within a chart via SSRS, Power BI or any reporting tool available. 

Happy coding!

References:
[1] Grant Fritchey (2014) SQL Server Query Performance Tuning: Troubleshoot and Optimize Query Performance in SQL Server 2014, 4th Ed.
[2] Sunil Agarwal et al (2005), Troubleshooting Performance Problems in SQL Server 2005, Source: TShootPerfProbs.docx
[3] Sunil Agarwal et al (2008), Troubleshooting Performance Problems in SQL Server 2008, Source: TShootPerfProbs2008.docx
[4] Microsoft SQL Docs (2018) Related Dynamic Management Views, Source
[5] Microsoft SQL Docs (2017) Use ring buffers to obtain health information about Always On availability groups, Source

18 April 2009

DBMS: Buffer Pool (Definitions)

"A buffer pool is a group of buffers logically connected so that a file using the pool has access to any of the available buffers." (F Peter Fisher & ‎George F Swindle, "Computer Programming Systems", 1964)

"A buffer pool is an area of storage that is segmented to provide a specific number of buffers. Buffers are obtained from the pool when needed and returned when no longer needed. Once returned to the pool, the buffer is then free to be used for another purpose." (Michael P Bouros, "Getting Into VSAM: An Introduction and Technical Reference", 1987)

"The buffer pool is a group of shared memory pages in the resident memory. It is used whenever a data page is read from disk." (Ron Flannery, "The Informix Handbook", 2000)

"A fixed-size allocation of memory, used to store an in-memory copy of a bunch of pages." (Peter Gulutzan & Trudy Pelzer, "SQL Performance Tuning", 2002)

"A buffer pool […] is simply a part of the total buffer cache that is subject to different retention criteria for database objects like tables." (Sam Alapati, "Expert Oracle Database 11g Administration" , 2009)

"A buffer pool is an area of memory into which database pages are read, modified, and held during processing." (IBM, "Business Process Management Performance teams", 2010)

"A block of memory reserved for index and table data pages." (SQL Server 2012 Glossary, "Microsoft", 2012)

"An area of memory set aside and used to avoid I/O operations when actual data is being read from the database. Also referred to as a data cache." (Craig S Mullins, "Database Administration: The Complete Guide to DBA Practices and Procedures" 2nd Ed., 2012)

"The buffer pool is a caching mechanism for managing transactions and writing and reading data to or from disks […]" (Charles Bell et al, MySQL High Availability: Tools for Building Robust Data Centers, 2014) 

"An area of memory into which data pages are read and in which they are modified and held during processing." (Sybase, "Open Server Server-Library/C Reference Manual", 2019)

"A buffer pool is an area of main memory that has been allocated by the database manager for the purpose of caching table and index data as it is read from disk." (IBM, DB2 documentation)

"The memory area that holds cached InnoDB data for both tables and indexes." (MySQL, "MySQL 8.0 Reference Manual Glossary")

Related Posts Plugin for WordPress, Blogger...

About Me

My photo
IT Professional with more than 24 years experience in IT in the area of full life-cycle of Web/Desktop/Database Applications Development, Software Engineering, Consultancy, Data Management, Data Quality, Data Migrations, Reporting, ERP implementations & support, Team/Project/IT Management, etc.