Showing posts with label pie chart. Show all posts

07 February 2025

🌌🏭KQL Reloaded: First Steps (Part VII: Basic Data Visualizations)

One of the greatest aspects of KQL and its environment is that creating a chart is just one instruction away from the dataset generated in the process. Of course, the data still need to be in an appropriate form to be used as source for a visual, though the effort is minimal. Let's consider the example used in the previous post based ln the ContosoSales data, where the visualization part is everything that comes after "| render":

// visualizations by Country: various charts
NewSales
| where SalesAmount <> 0 and ProductCategoryName == 'TV and Video'
| where DateKey >=date(2023-02-01) and DateKey < datetime(2023-03-01)
| summarize count_customers = count_distinct(CustomerKey) by RegionCountryName
| order by count_customers desc
//| render table
//| render linechart
//| render areachart 
//| render stackedchart
//| render columnchart | render piechart with (xtitle="Country", ytitle="# Customers", title="# Customers by Country (pie chart)", legend=hidden)
Output:
# Customers by Country (various charts)

It's enough to use "render" with the chart type without specifying the additional information provided under "with", though the legend can facilitate data's understanding. Unfortunately, the available properties are relatively limited, at least for now. 

Adding one more dimension is quite simple, even if the display may be sometimes confusing as there's no clear delimitation between the entities represented while the legend grows linearly with the number of points. It might be a good idea to use additional charts for the further dimensions in scope. 

// visualizations by Region & Country: various charts
NewSales
| where SalesAmount <> 0 and ProductCategoryName == 'TV and Video'
| where DateKey >=date(2023-02-01) and DateKey < datetime(2023-03-01)
| summarize count_customers = count_distinct(CustomerKey) by ContinentName, RegionCountryName
| order by count_customers desc   
//| render stackedareachart 
//| render linechart 
//| render table 
//| render areachart 
//| render piechart
| render columnchart 
    with (xtitle="Region/Country", ytitle="# Customers",
    title="#Customers by Continent & Country", legend=hidden)
Output:
# Customers by Continent & Country (column chart)

Sometimes, it makes sense to reduce the number of values, recommendation that applies mainly to pie charts:

// visualizations by Zone: pie chart
NewSales
| where SalesAmount <> 0 and ProductCategoryName == 'TV and Video'
| where DateKey >=date(2023-02-01) and DateKey < datetime(2023-03-01)
| summarize count_customers = count_distinct(CustomerKey) by iif(RegionCountryName in ('United States', 'Canada'), RegionCountryName, 'Others')
| render piechart
    with (xtitle="Country", ytitle="Sales volume",
    title="Sales volume by Zone")
Output:
# Customers by Zone (pie chart)

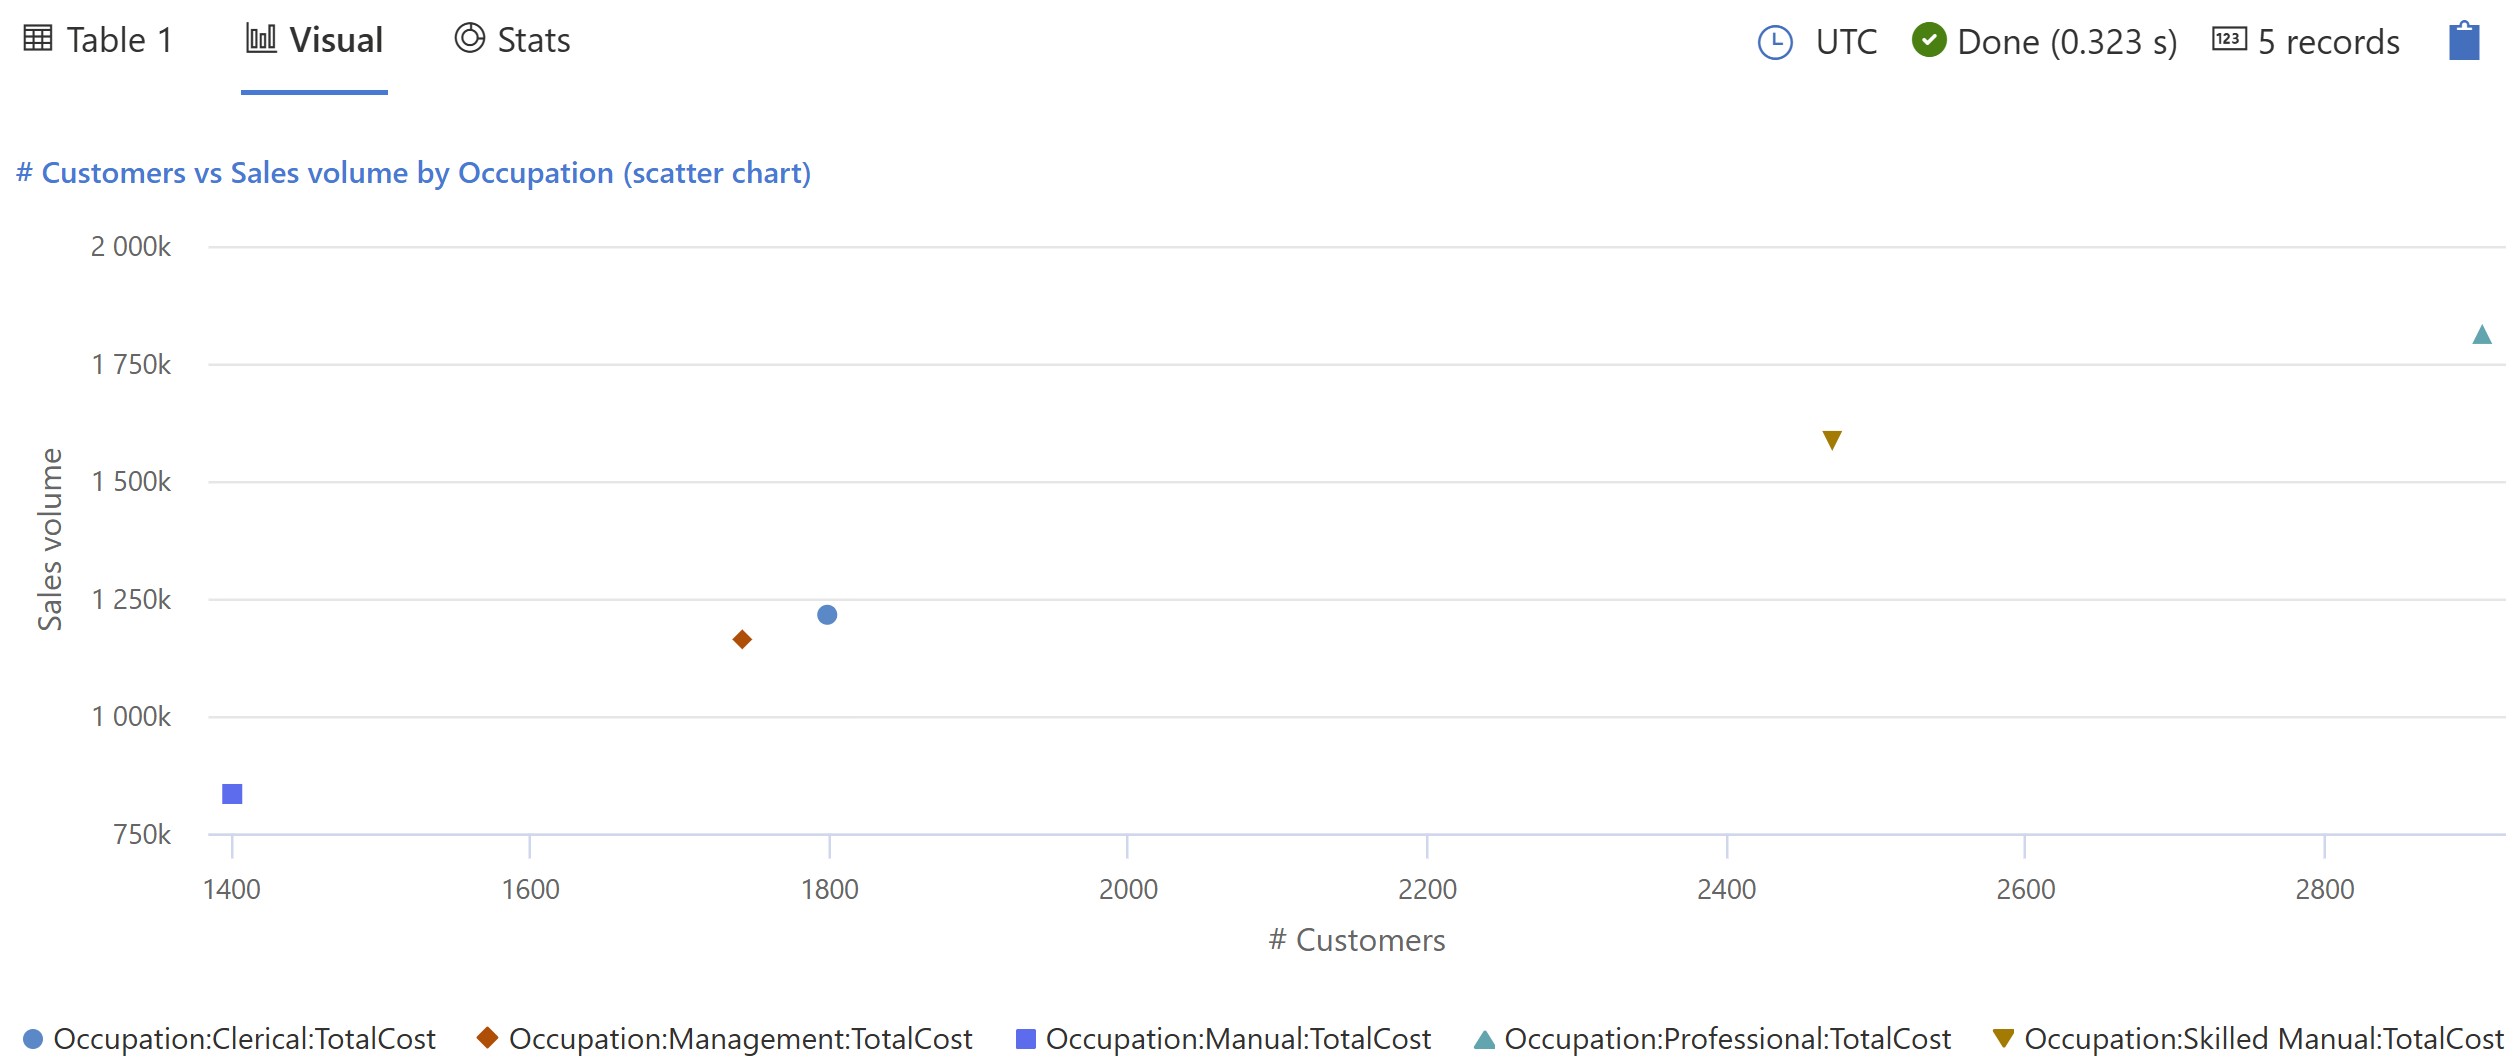
Adding a second set of values (e.g. Total cost) allows to easily create a scatter chart:

// visualization by Occupation: scatter chart
NewSales
| where SalesAmount <> 0 and ProductCategoryName == 'TV and Video'
| where DateKey >=date(2023-02-01) and DateKey < datetime(2023-03-01)
| summarize count_customers = count_distinct(CustomerKey) 
    , TotalCost = sum(TotalCost) by Occupation
| order by count_customers desc
| render scatterchart 
    with (xtitle="# Customers", ytitle="Sales volume",
    title="# Customers vs Sales volume by Occupation", legend=visible )
Output:
# Customers vs Sales volume by Occupation (scatter chart)

The visualizations are pretty simple to build, though one shouldn't expect that one can build a visualization on top of any dataset, at least not without further formatting and eventually code changes. For example, considering the query from the previous post, with a small change one can use the data with a column chart, though this approach might have some limitation (e.g. it doesn't work pie charts):

// calculating percentages from totals: column chart
NewSales
| where SalesAmount <> 0 and ProductCategoryName == 'TV and Video'
//| where DateKey >=date(2023-02-01) and DateKey < datetime(2023-03-01)
| summarize count_customers = count_distinct(CustomerKey)
    , count_customers_US = count_distinctif(CustomerKey, RegionCountryName == 'United States')
    , count_customers_CA = count_distinctif(CustomerKey, RegionCountryName == 'Canada')
    , count_customers_other = count_distinctif(CustomerKey, not(RegionCountryName in ('United States', 'Canada')))
| project Charting = "Country"
    , US = count_customers_US
    , CA = count_customers_CA
    , other = count_customers_other
| render columnchart
    with (xtitle="Region", ytitle="# Customers",
    title="# Customers by Region")
Output:
# Customers by Region (column chart)

There are a few more visuals that will be considered in a next post. Despite the relatively limited set of visuals and properties, the visualizations are useful to get a sense of data's shape, and this with a minimum of changes. Ad-hoc visualizations can help also in data modeling, validating the logic and/or identifying issues in the data when creating the queries, which makes it a great feature. 

Happy coding!

Previous Post <<||>> Next Post

04 August 2024

📊Graphical Representation: Graphics We Live By (Part X: Pie and Donut Charts in Power BI and Excel)

Graphical Representation Series

Pie charts are loved and hated by many altogether, and there are many entitled reasons to use them and avoid them, though the most important criteria to evaluate them is whether they do the intended job in an acceptable manner, especially when compared to other representational means. The most important aspect they depict is the part to whole ratio, which even if can be depicted by other graphical tools, few tools are efficient in representing it. 

The pie chart works well as a visualization tool when it has only 3-5 values that are easily recognizable in the visualization, however as soon the size or the number of pieces vary considerably, the more difficult it is to visualize and interpret them, in case their representation has more negative than positive effects. There are many topics that form something like a long tail - the portion of the distribution having many occurrences far from the head or beginning. Displaying the items from the long tail together with the other components together can totally obscure the distribution of the items from the long tail as they become unrecognizable in the diagram. 

One approach to handle this is to group all the items from the long tail together under a piece (e.g. Other) and use a second form of representation to display them separately. For example,  Microsoft Excel offers a way to zoom in the section of a pie chart with small percentages by displaying them in a second pie chart (pie of pie) or bar chart (bar of pie), something like a "zoom in" perspective (see image below). Unfortunately, the feature seems to limit itself only to small percentages, and thus can't be used currently to offer a broader perspective. Ideally, it would be useful to zoom in on any piece of the pie, especially when the items are categorized as a hierarchy with two or even more levels. 


Unfortunately, even modern visualization tools offer limited features in displaying this kind of perspective into a flexible unitary visualization, and thus users are forced to use their creativity in providing proper solutions. In the below example the "Renewables" piece of pie is further broken down into several components of a full pie, an ensemble supposed to function as a single form of representation. With a bit of effort, the reader probably will understand the meaning behind the two pie charts, however the encoding of colors and other elements used are suboptimal in the decoding process. 

Pie Charts - Original Solution

In the above example, the arrow may suggest that in between the two donut charts exists a relationship, reflected also in the description provided, however the readers may still have difficulties in correctly interpreting the diagrams, especially when there's some kind of overlapping or other type of implied or unimplied resemblance. If the colors overlap or have other similarities, are they intentional? If the circles have the same size, does this observed resemblance have a meaning? The reader shouldn't bother himself with this type of questions, but see the resemblance and the meaning of the various elements with a minimum of effort while decoding a chart's elements. Of course, when the meaning is not clear, some guidance should be ideally provided!

Unfortunately, Power BI doesn't seem to have a similar visual like the one from Excel yet, however with a bit of effort one can obtain similar results, even if there are other minor or important limitations. For example, the lines between the two pie charts can't be drawn, so one is forced to use other encodings to show that there's a connection between the Renewable slice and the small pie chart. Moreover, the ensemble thus created isn't treated unitary and handled accordingly. Frankly, the maturity of a graphical representation environment can and should be judged also from this perspective!

The below representation built in Power BI uses a few tricks to display two pie charts together. The smaller pie chart representing the breakdown and pieces' colors are variations of parent's color, attempting to show that there's a relationship between the slice from the first chart and the pie chart with the details. Unfortunately, it wasn't possible to use similar lines like in Excel to show the relation between the two sections. 

Pie of Pie in Power BI

Instead of a pie chart, one can use a donut, like in the original representation. Even if the donut uses a smaller area for representation, in theory the pie chart offers a better basis for comparisons, at least in theory. Stacked column charts can be used as well (see C), however one loses the certainty that the pieces must add up to 100%. Further limitations can appear when one wants to achieve more with the visualizations.

Custom charts can be used as well. The pie chart coming from xViz (see D) allows to increase the size of a pie piece by using another radius, technique which could be used to highlight the piece represented in the second chart. Frankly, sunburst diagrams (see E) are better at representing the parent to child proportions, where the same color encoding has been used. Unfortunately, the more information is shown, the more loaded the visualization seems to be.

Pie of Pie Alternatives in Power BI I

A treemap can prove to be a better representation alternative because it encodes proportions in a unitary way, much like pie charts do, though it takes more space if one wants to make the labels visible. Radial charts (see G) and Aster plots (see I) can be occasionally better choices, especially because they use less space as they display only the main categories. A second diagram chart can be used to display the subcategories, much like in A and B. Sankey charts (see H) can be used as well, even if they don't allow representing any quantitative values unless one encodes them directly in the labels. 

Pie of Pie Alternatives in Power BI II

When one dives into the world of diagrams and goes behind the still limited representational choices provided by the standard tools, one can be surprised by the additional representational choices. However, their appropriateness should be considered against readers' skillset to read and interpret them! Frankly, the alternatives considered above could be a better choice when they will reach a representational maturity. 

Many thanks to Christopher Chin, who in his weekly post on data visualization blunders, suggested the examples used as basis for this post (see [1])!

Previous Post <<||>> Next Post

References:
[1] LinkedIn (2024) Christopher Chin's post (link)

Related Posts Plugin for WordPress, Blogger...

About Me

My photo
Koeln, NRW, Germany
IT Professional with more than 24 years experience in IT in the area of full life-cycle of Web/Desktop/Database Applications Development, Software Engineering, Consultancy, Data Management, Data Quality, Data Migrations, Reporting, ERP implementations & support, Team/Project/IT Management, etc.