Showing posts with label metrics. Show all posts

21 August 2024

Business Intelligence: Data Modeling (Part IV: From Data to Storytelling II)

Business Intelligence Series

Being snapshots in people and organizations’ lives, data arrive to tell a story, even if the story might not be worth telling or might be important only in certain contexts. In fact each record in a dataset has the potential of bringing a story to life, though business people are more interested in the hidden patterns and “stories” the data reveal through more or less complex techniques. Therefore, data are usually tortured until they confess something, and unfortunately people stop analyzing the data with the first confession(s). 

Even if it looks like torture, data need to be processed to reveal certain characteristics, trends or patterns that could help us in sense-making, decision-making or similar specific business purposes. Unfortunately, the volume of data increases with an incredible velocity to which further characteristics like variety, veracity, volume, velocity, value, veracity and variability may add up. 

The data in a dashboard, presentation or even a report should ideally tell a story otherwise the data might not be worthy looking at, at least from some people’s perspective. Probably, that’s one of the reason why man dashboards remain unused shortly after they were made available, even if considerable time and money were invested in them. Seeing the same dull numbers gives the illusion that nothing changed, that nothing is worth reviewing, revealing or considering, which might be occasionally true, though one can’t take this as a rule! Lot of important facts could remain hidden or not considered. 

One can suppose that there are businesses in which something important seldom happens and an alert can do a better job than reviewing a dashboard or a report frequently. Probably an alert is a better choice than reporting metrics nobody looks at! 

Organizations usually define a set of KPIs (key performance indicators) and other types of metrics they (intend to) review periodically. Ideally, the numbers collected should define and reflect the critical points (aka pain points) of an organization, if they can be known in advance. Unfortunately, in dynamic businesses the focus can change considerably from one day to another. Moreover, in systemic contexts critical points can remain undiscovered in time if the set of metrics defined doesn’t consider them adequately. 

Typically only one’s experience and current or past issues can tell what one should consider or ignore, which are the critical/pain points or important areas that must be monitored. Ideally, one should implement alerts for the critical points that require a immediate response and use KPIs for the recurring topics (though the two approaches may overlap). 

Following the flow of goods, money and other resources one can look at the processes and identify the areas that must be monitored, prioritize them and identify the metrics that are worth tracking, respectively that reflect strengths, weaknesses, opportunities, threats and the risks associated with them. 

One can start with what changed by how much, what caused the change(s) and what further impact is expected directly or indirectly, by what magnitude, respectively why nothing changed in the considered time unit. Causality diagrams can help in the process even if the representations can become quite complex. 

The deeper one dives and the more questions one attempts to answer, the higher the chances to find a story. However, can we find a story that’s worth telling in any set of data? At least this is the point some adepts of storytelling try to make. Conversely, the data can be dull, especially when one doesn’t track or consider the right data. There are many aspects of a business that may look boring, and many metrics seem to track the boring but probably important aspects. 

07 May 2024

Microsoft Fabric: The Metrics Layer (Notes) [new feature]

Disclaimer: This is work in progress intended to consolidate information from various sources.
Last updated: 07-May-2024

The Metrics Layer in Microsoft Fabric (adapted diagram)

[new feature] Metrics Layer (Metrics Store)

  • {definition}an abstraction layer available between the data store(s) and end users which allows organizations to create standardized business metrics, that are rooted in measures and are discoverable and intended for reuse
    • ⇐ {important} feature still in private preview 
  • {goal} extend existing infrastructure 
    • {benefit} leverages and extends existing features
  • {goal} provide consistent definitions and descriptions [1]
    • consistent definitions that include besides business logic additional dimensions and filters [1]
    • ⇒ {benefit} allows to standardize the metrics across the organization
    • ⇒ {benefit} enforce to enforce a SSoT
  • {goal} easy management 
    • via management views 
    • [feature] lineage 
    • [feature] source control
    • [feature] duplicate identification
    • [feature] push updates to downstream uses of the metrics 
  • {goal}searchable and discoverable metrics 
    • {feature} integration
      • based on Sempy fabric package
        • ⇐ a dataframe for storage and propagation of Power BI metadata which is part of the python-based semantic Link in Fabric
  • {goal}trust
    • [feature] trust indicators
    • {benefit} facilitates report's adoption
  • {feature} metric set 
    • {definition} a Fabric item that groups together a set of metrics into a mini-model
    • {benefit} allows to reduce the overall complexity of semantic models, while being easy to evolve and consume
    • associated with a single domain
      • ⇒ supports the data mesh architecture
    • shareable 
      • can be shared with other users
    • {action} create metric set
      • creates the actual artifact, to which metrics can be added 
  • {feature} metric
    •  {definition} a way to elevate the measures from the various semantic models existing in the organization
    • tied to the original semantic model
      • ⇒ {benefit} allows to see how a metric is used across the solutions 
    • reusable
      • can be reused in other fabric artifacts
        • new reports on the Power BI service
        • notebooks 
          • by copying the code
      • can be reused in Power BI
        • via OneLake data hub menu element
      • can be chained 
        • changes are propagated downstream 
    • materializable 
      • its output can be persisted to OneLake by saving it a delta table into a lakehouse
      • {misuse} data is persisted unnecessarily
    • {action} elevate metric
      • copies measure's definition and description
      • ⇒  implies restructuring, refactoring, moving, and testing a lot of code in the process
      • {misuse} data professionals build everything as metrics
    • {action} update metric
    • {action} add filters to metric 
    • {action} add dimensions to metric
    • {action} materialize metric 

Acronyms:
SSoT - single source of truth ()

References:
[1] Power BI Tips (2024) Explicit Measures Ep. 236: Metrics Hub, Hot New Feature with Carly Newsome (link)
[2] Power BI Tips (2024) Introducing Fabric Metrics Layer / Power Metrics Hub [with Carly Newsome] (link)

06 May 2024

Microsoft Fabric: The Metrics Layer [new feature]

Introduction

One of the announcements of this year's Microsoft Fabric Community first conference was the introduction of a metrics layer in Fabric which "allows organizations to create standardized business metrics, that are rooted in measures and are discoverable and intended for reuse" [1]. As it seems, the information content provided at the conference was kept to a minimum given that the feature is still in private preview, though several webcasts start to catch up on the topic (see [2], [4]). Moreover, as part of their show, the Explicit Measures (@PowerBITips) hosts had Carly Newsome as invitee, the manager of the project, who unveiled more details about the project and the feature, details which became the main source for the information below. 

The idea of a metric layer or metric store is not new, data professionals occasionally refer to their structure(s) of metrics as such. The terms gained weight in their modern conception relatively recently in 2021-2022 (see [5], [6], [7], [8], [10]). Within the modern data stack, a metrics layer or metric store is an abstraction layer available between the data store(s) and end users. It allows to centrally define, store, and manage business metrics. Thus, it allows us to standardize and enforce a single source of truth (SSoT), respectively solve several issues existing in the data stacks. As Benn Stancil earlier remarked, the metrics layer is one of the missing pieces from the modern data stack (see [10]).

Microsoft's Solution

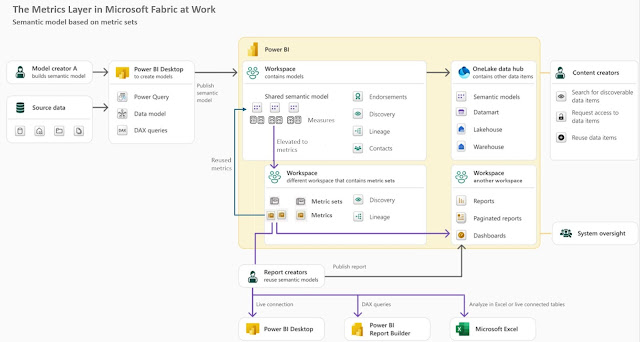
Microsoft's business case for metrics layer's implementation is based on three main ideas (1) duplicate measures contribute to poor data quality, (2) complex data models hinder self-service, (3) reduce data silos in Power BI. In Microsoft's conception the metric layer provides several benefits: consistent definitions and descriptions, easy management via management views, searchable and discoverable metrics, respectively assure trust through indicators. 

For this feature's implementation Microsoft introduces a new Fabric Item called a metric set that allows to group several (business) metrics together as part of a mini-model that can be tailored to the needs of a subset of end-users and accessed by them via the standard tools already available. The metric set becomes thus a mini-model. Such mini-models allow to break down and reduce the overall complexity of semantic models, while being easy to evolve and consume. The challenge will become then on how to break down existing and future semantic models into nonoverlapping mini-models, creating in extremis a partition (see the Lego metaphor for data products). The idea of mini-models is not new, [12] advocating the idea of using a Master Model, a technique for creating derivative tabular models based on a single tabular solution.

A (business) metric is a way to elevate the measures from the various semantic models existing in the organization within the mini-model defined by the metric set. A metric can be reused in other fabric artifacts - currently in new reports on the Power BI service, respectively in notebooks by copying the code. Reusing metrics in other measures can mean that one can chain metrics and the changes made will be further propagated downstream. 
The Metrics Layer in Microsoft Fabric (adapted diagram)

Every metric is tied to the original semantic model which allows thus to track how a metric is used across the solutions and, looking forward to Purview, to identify data's lineage. A measure is related to a "table", the source from which the measure came from.

Users' Perspective

The Metrics Layer feature is available in Microsoft Fabric service for Power BI within the Metrics menu element next to Scorecards. One starts by creating a metric set in an existing workspace, an operation which creates the actual artifact, to which the individual metrics are added. To create a metric, a user with build permissions can navigate through the semantic models across different workspaces he/she has access to, pick a measure from one of them and elevate it to a metric, copying in the process its measure's definition and description. In this way the metric will always point back to the measure from the semantic model, while the metrics thus created are considered as a related collection and can be shared around accordingly. 

Once a metric is added to the metric set, one can add in edit mode dimensions to it (e.g. Date, Category, Product Id, etc.). One can then further explore a metric's output and add filters (e.g. concentrate on only one product or category) point from which one can slice-and-dice the data as needed.

There is a panel where one can see where the metric has been used (e.g. in reports, scorecards, and other integrations), when was last time refreshed, respectively how many times was used. Thus, one has the most important information in one place, which is great for developers as well as for the users. Probably, other metadata will be added, such as whether an increase in the metric would be favorable or unfavorable (like in Tableau Pulse, see [13]) or maybe levels of criticality, an unit of measure, or maybe its type - simple metric, performance indicator (PI), result indicator (RI), KPI, KRI etc.

Metrics can be persisted to the OneLake by saving their output to a delta table into the lakehouse. As demonstrated in the presentation(s), with just a copy-paste and a small piece of code one can materialize the data into a lakehouse delta table, from where the data can be reused as needed. Hopefully, the process will be further automated. 

One can consume metrics and metrics sets also in Power BI Desktop, where a new menu element called Metric sets was added under the OneLake data hub, which can be used to connect to a metric set from a Semantic model and select the metrics needed for the project. 

Tapping into the available Power BI solutions is done via an integration feature based on Sempy fabric package, a dataframe for storage and propagation of Power BI metadata which is part of the python-based semantic Link in Fabric [11].

Further Thoughts

When dealing with a new feature, a natural idea comes to mind: what challenges does the feature involve, respectively how can it be misused? Given that the metrics layer can be built within a workspace and that it can tap into the existing measures, this means that one can built on the existing infrastructure. However, this can imply restructuring, refactoring, moving, and testing a lot of code in the process, hopefully with minimal implications for the solutions already available. Whether the process is as simple as imagined is another story. As misusage, in extremis, data professionals might start building everything as metrics, though the danger might come when the data is persisted unnecessarily. 

From a data mesh's perspective, a metric set is associated with a domain, though there will be metrics and data common to multiple domains. Moreover, a mini-model has the potential of becoming a data product. Distributing the logic across multiple workspaces and domains can add further challenges, especially in what concerns the synchronization and implemented of requirements in a way that doesn't lead to bottlenecks. But this is a general challenge for the development team(s). 

The feature will probably suffer further changes until is released in public review (probably by September or the end of the year). I subscribe to other data professionals' opinion that the feature was for long needed and that can have an important impact on the solutions built. 

Previous Post <<||>> Next Post

Resources:
[1] Microsoft Fabric Blog (2024) Announcements from the Microsoft Fabric Community Conference (link)
[2] Power BI Tips (2024) Explicit Measures Ep. 236: Metrics Hub, Hot New Feature with Carly Newsome (link)
[3] Power BI Tips (2024) Introducing Fabric Metrics Layer / Power Metrics Hub [with Carly Newsome] (link)
[4] KratosBI (2024) Fabric Fridays: Metrics Layer Conspiracy Theories #40 (link)
[5] Chris Webb's BI Blog (2022) Is Power BI A Semantic Layer? (link)
[6] The Data Stack Show (2022) TDSS 95: How the Metrics Layer Bridges the Gap Between Data & Business with Nick Handel of Transform (link)
[7] Sundeep Teki (2022) The Metric Layer & how it fits into the Modern Data Stack (link)
[8] Nick Handel (2021) A brief history of the metrics store (link)
[9] Aurimas (2022) The Jungle of Metrics Layers and its Invisible Elephant (link)
[10] Benn Stancil (2021) The missing piece of the modern data stack (link)
[11] Microsoft Learn (2024) Sempy fabric Package (link)
[12] Michael Kovalsky (2019) Master Model: Creating Derivative Tabular Models (link)
[13] Christina Obry (2023) The Power of a Metrics Layer - and How Your Organization Can Benefit From It (link

11 March 2024

Business Intelligence: Key Performance Indicators (Between Certainty and Uncertainty)

Business Intelligence
Business Intelligence Series

Despite the huge collection of documented Key Performance Indicators (KPIs) and best practices on which KPIs to choose, choosing a reliable set of KPIs that reflect how the organization performs in achieving its objectives continues to be a challenge for many organizations. Ideally, for each objective there should be only one KPIs that reflects the target and the progress made, though is that realistic?

Let's try to use the driver's metaphor to exemplify several aspects related to the choice of KPIs. A driver's goal is to travel from point A to point B over a distance d in x hours. The goal is SMART (Specific, Measurable, Achievable, Relevant, and Time-bound) if the speed and time are realistic and don't contradict Physics, legal or physical laws. The driver can define the objective as "arriving on time to the destination". 

One can define a set of metrics based on the numbers that can be measured. We have the overall distance and the number of hours planned, from which one can derive an expected average speed v. To track a driver's progress over time there are several metrics that can be thus used: e.g., (1) the current average speed, (2) the number of kilometers to the destination, (3) the number of hours estimated to the destination. However, none of these metrics can be used alone to denote the performance alone. One can compare the expected with the current average speed to get a grasp of the performance, and probably many organizations will use only (1) as KPI, though it's needed to use either (2) or (3) to get the complete picture. So, in theory two KPIs should be enough. Is it so?

When estimating (3) one assumes that there are no impediments and that the average speed can be attained, which might be correct for a road without traffic. There can be several impediments - planned/unplanned breaks, traffic jams, speed limits, accidents or other unexpected events, weather conditions (that depend on the season), etc. Besides the above formula, one needs to quantify such events in one form or another, e.g., through the perspective of the time added to the initial estimation from (3). However, this calculation is based on historical values or navigator's estimation, value which can be higher or lower than the final value. 

Therefore, (3) is an approximation for which is needed also a confidence interval (± t hours). The value can still include a lot of uncertainty that maybe needs to be broken down and quantified separately upon case to identify the deviation from expectations, e.g. on average there are 3 traffic jams (4), if the road crosses states or countries there may be at least 1 control on average (5), etc. These numbers can be included in (3) and the confidence interval, and usually don't need to be reported separately, though probably there are exceptions. 

When planning, one needs to also consider the number of stops for refueling or recharging the car, and the average duration of such stops, which can be included in (3) as well. However, (3) slowly becomes  too complex a formula, and even if there's an estimation, the more facts we're pulling into it, the bigger the confidence interval's variation will be. Sometimes, it's preferable to have instead two-three other metrics with a low confidence interval than one with high variation. Moreover, the longer the distance planned, the higher the uncertainty. One thing is to plan a trip between two neighboring city, and another thing is to plan a trip around the world. 

Another assumption is that the capability of the driver/car to drive is the same over time, which is not always the case. This can be neglected occasionally (e.g. one trip), though it involves a risk (6) that might be useful to quantify, especially when the process is repeatable (e.g. regular commuting). The risk value can increase considering new information, e.g. knowing that every a few thousand kilometers something breaks, or that there's a traffic fine, or an accident. In spite of new information, the objective might also change. Also, the objective might suffer changes, e.g. arrive on-time safe and without fines to the destination. As the objective changes or further objectives are added, more metrics can be defined. It would make sense to measure how many kilometers the driver covered in a lifetime with the car (7), how many accidents (8) or how many fines (9) the driver had. (7) is not related to a driver's performance, but (8) and (9) are. 

As can be seen, simple processes can also become very complex if one attempts to consider all the facts and/or quantify the uncertainty. The driver's metaphor applies to a simple individual, though once the same process is considered across the whole organization (a group of drivers), the more complexity is added and the perspective changes completely. E.g., some drivers might not even reach the destination or not even have a car to start with, and so on. Of course, with this also the objectives change and need to be redefined accordingly. 

The driver's metaphor is good for considering planning activities in which a volume of work needs to be completed in a given time and where a set of constraints apply. Therefore, for some organizations, just using two numbers might be enough for getting a feeling for what's happening. However, as soon one needs to consider other aspects like safety or compliance (considered in aggregation across many drivers), there might be other metrics that qualify as KPIs.

It's tempting to add two numbers and consider for example (8) and (9) together as the two are events that can be cumulated, even if they refer to different things that can overlap (an accident can result in a fine and should be counted maybe only once). One needs to make sure that one doesn't add apples with juice - the quantified values must have the same unit of measure, otherwise they might need to be considered separately. There's the tendency of mixing multiple metrics in a KPI that doesn't say much if the units of measure of its components are not the same. Some conversions can still be made (e.g. how much juice can be obtained from apples), though that's seldom the case.

Previous Post <<||>> Next Post

15 June 2020

Strategic Management: Quality Acceptance Criteria for Strategies and Concepts

Strategic Management

Quality acceptance criteria for concept documents in general, and for strategies in particular, are not straightforward for all, behind the typical request of completeness hiding other criteria like flexibility, robustness, predictability, implementable, specificity, fact-based, time-boundedness, clearness, comprehensibility or measurability.

Flexible: once the strategy approved, one must be able to change the strategy as may seem fit, especially to address changes in risks, opportunities, goals and objectives, respectively the identification of new facts. A strategy implies a roadmap on how to arrive from the starting point to destination. As the intermediary or final destinations change, the strategy must reflect these changes (and it’s useful to document these changes accordingly). This also implies that the strategy must be periodically reviewed, the new facts accordingly analyzed and decided whether they must be part of the strategy.
Robust: a strategy must handle variability (aka changes) and remain effective (producing the desired/intended results).

Predictable: the strategy needs to embrace the uncertainty and complexity of the world. Even if one can’t predict the future, the strategy must consider the changes foreseen in the industry and technologies. Is not necessarily about imagining the future, even if this would be ideal, but to consider the current trends in the industry.

Implementable: starting with the goals and ending with the roadmap, the strategy must be realistic and address organization’s current, respectively future capabilities. If the organization need to acquire further capabilities, they need to be considered as well.

Specific: the strategy must address the issues, goals and objectives specific for the organization. As long these are not reflected in it, the strategy is more likely to fail. It is true that many of the issues and goals considered can be met in other organizations, however there are always important aspects that need to be made explicit.

Fact-based: the strategy must be based on facts rooted in internal or market analysis, however the strategy is not a research paper to treat in detail the various concepts and findings – definitions, summaries of the findings with their implications, and references to further literature are enough, if needed.

Time-bound:  in contrast to other concepts, the strategy must specify the timeframe considered for its implementation. Typically a strategy addresses a time interval of 3 to 5 years, though upon case, the interval may be contracted or dilated to consider business specifics. The strategy can further break down the roadmap per year or biannually.

Complete: the strategy must be complete in respect to the important topics it needs to address. It’s not only about filing out a template with information, the reader must get a good understanding of what the strategy is about. Complete doesn’t mean perfect, but providing a good enough description of the intent.

Clear: especially when there are competing interests, the strategy must describe what is in scope and what was left out. What was left out is as important as what is considered, including the various presumptions. A test of clearness is whether the why, how, who, when and by what means were adequately considered.

Comprehensible: the targeted audience must be able to read and understand the strategy at the appropriate level of detail or scope.

Measurable: the progress of a strategy must be measurable, and there are two aspects to consider. On one side the goals and objectives considered must be measurable by definition (see SMART criteria), while on the other, one must be able to track the progress and various factors related to it (e.g. implementation costs, impact of the changes made, etc.). Therefore, a strategy must include a set of metrics that will allow quantifying the mentioned aspects.

29 November 2019

Business Intelligence: Data Soup – From Business Intelligence to Analytics

Business Intelligence Series

The days when everything was reduced to simple terminology like reports or queries are gone. One can see it in the market trends related to reporting or data, as well in the jargon soup the IT people use on the daily basis – Business Intelligence (BI), Data Mining (DM), Analytics, Data Science, Data Warehousing (DW), Machine Learning (ML), Artificial Intelligence (AI) and so on. What’s more confusing for the users and other spectators is the easiness with which all these concepts are used, sometimes interchangeably, and often it feels like nothing makes sense.

BI is used nowadays to refer to the technologies, architectures, methodologies, processes and practices used to transform data into what is desired as meaningful and useful information.  From its early beginnings in the 60s, the intelligence from Business Intelligence (BI) refers to the ability to apprehend the interrelationships of the facts to be processed (aka data) in such a way as to guide action towards a desired goal.

The main purpose of BI was and is to guide actions and provide a solid basis for decision making, aspect not necessarily reflected in the way organizations use their BI infrastructure. Except basic operational/tactical/strategic reports and metrics that reflect to a higher or lower degree organizations’ goals, BI often fails to provide the expected value. The causes are multiple ranging from an organizations maturity in devising a strategy and dividing it into SMART goals and objectives, to the misuse of technologies for the wrong purposes.

Despite the basic data analysis techniques, the rich visualizations and navigation functionality, BI fails often to deliver by itself more than ordinary and already known information. Information becomes valuable when it brings novelty, when it can be easily transformed into knowledge, or even better, when knowledge is extracted directly. To address the limitations of the BI a series of techniques appeared in parallel and coined in the 90s as Data Mining.

Mining is the process of obtaining something valuable from a resource. What DM tries to achieve as process is the extraction of knowledge in form patterns from the data by categorizing, clustering, identifying dependencies or anomalies. When compared with data analysis, the main characteristics of DM is the fact that is used to test models and hypotheses, and that it uses a set of semiautomatic and automatic out-of-the-box statistics packages, AI or predictive algorithms with applicability in different areas – Web,  text, speech, business processes, etc.

DM proved to be useful by allowing to build models rooted in historical data, models which allowed predicting outcome or behavior, however the models are pretty basic and there’s always a threshold beyond which they can’t go. Furthermore, the costs of preparing the data and of the needed infrastructure seem to be high compared with the benefits data mining provides. There are scenarios in which DM proves to bring benefit, while in others it raises more challenges than can solve. Privacy, security, misuse of information and the blind use of techniques without understanding the data or the models behind, are just some of such challenges.  

Information seems too common, while knowledge can become expensive to obtain. The middle way between the two found its future into another buzzword – analyticsthe systematic analysis of data or statistics using specific mathematical methods. Analytics combine the agility of data analysis techniques with the power of predictive and prescriptive techniques used in DM in discovering patterns into the data. Analytics attempts to identify why it happens by using a chain of inferences resulted from data’s analyzing and understanding. From another perspective analytics seems to be a rebranded and slightly enhanced version of BI.

26 July 2019

IT: Efficiency (Definitions)

"A measure of the degree to which a system or component performs designated functions with respect to the resources it consumes to perform those functions." (Richard D Stutzke, "Estimating Software-Intensive Systems: Projects, Products, and Processes", 2005)

"a measure of the cost per time or cost per effort." (Bruce P Douglass, "Real-Time Agility: The Harmony/ESW Method for Real-Time and Embedded Systems Development", 2009)

"A quasimetric used throughout this book to describe how well memory and other resources of the processor and platform are utilized by a concurrent implementation." (Clay Breshears, "The Art of Concurrency", 2009)

"Efficiency measures the return on investment in using additional hardware to operate in parallel." (Michael McCool et al, "Structured Parallel Programming", 2012)

"A set of software characteristics (for example, execution speed, response time) relating to performance of the software and use of resources (for example, memory) under stated conditions (normally increasing load)." (Tilo Linz et al, "Software Testing Foundations" 4th Ed., 2014)

"In relation to performance/operational auditing, the use of financial, human, physical, and information resources such that output is maximized for any given set of resource inputs, or input is minimized for any given quantity and quality of output." (Sally-Anne Pitt, "Internal Audit Quality", 2014)

"Efficiency is the degree to which a resource is utilized for the intended task." (Hari K Kondaveeti et al, "Deep Learning Applications in Agriculture: The Role of Deep Learning in Smart Agriculture", 2021)

"a measure of whether the right amount of resources has been used à to deliver a process, service or activity" (ITIL)

"Resources expended in relation to the accuracy and completeness with which users achieve goals." (NISTIR 8040)

"The capability of the software product to provide appropriate performance, relative to the amount of resources used under stated conditions." (ISO 9126)

16 July 2019

IT: Quality of Service (Definitions)

"The guaranteed performance of a network connection." (Tom Petrocelli, "Data Protection and Information Lifecycle Management", 2005)

"QoS (Quality of Service) is a metric for quantifying desired or delivered degree of service reliability, priority, and other measures of interest for its quality." (Bo Leuf, "The Semantic Web: Crafting infrastructure for agency", 2006)

"a criterion of performance of a service or element, such as the worst-case execution time for an operation." (Bruce P Douglass, "Real-Time Agility: The Harmony/ESW Method for Real-Time and Embedded Systems Development", 2009)

"The QoS describes the non-functional aspects of a service such as performance." (Martin Oberhofer et al, "The Art of Enterprise Information Architecture", 2010)

"QoS (Quality of Service) Networking technology that enables network administrators to manage bandwidth and give priority to desired types of application traffic as it traverses the network." (Mark Rhodes-Ousley, "Information Security: The Complete Reference" 2nd Ed., 2013)

"A negotiated contract between a user and a network provider that renders some degree of reliable capacity in the shared network." (Gartner)

"Quality of service (QoS) is the description or measurement of the overall performance of a service, especially in terms of the user’s experience. Typically it is used in reference to telephony or computer networks, or to online and cloud-hosted services." (Barracuda) [source]

"The measurable end-to-end performance properties of a network service, which can be guaranteed in advance by a Service Level Agreement between a user and a service provider, so as to satisfy specific customer application requirements. Note: These properties may include throughput (bandwidth), transit delay (latency), error rates, priority, security, packet loss, packet jitter, etc." (CNSSI 4009-2015)

09 July 2019

IT: Resilience (Definitions)

"The ability to cope with adversity and recover quickly from setbacks." (PMI, "Navigating Complexity: A Practice Guide", 2014)

"System resilience is an ability of the system to withstand a major disruption within acceptable degradation parameters and to recover within an acceptable time." (Denis Čaleta, "Cyber Threats to Critical Infrastructure Protection: Public Private Aspects of Resilience", 2016)

"The ability of an information system to continue to (1) operate under adverse conditions or stress, even if in a degraded or debilitated state, while maintaining essential operational capabilities; and (2) recover to an effective operational posture in a time frame consistent with mission needs." (William Stallings, "Effective Cybersecurity: A Guide to Using Best Practices and Standards", 2018)

"The ability of a project to readily resume from unexpected events, threats or actions." (Phil Crosby, "Shaping Mega-Science Projects and Practical Steps for Success", 2019)

"The ability of an infrastructure to resist, respond and overcome adverse events" (Konstantinos Apostolou et al, "Business Continuity of Critical Infrastructures for Safety and Security Incidents", 2020)

"The word resilience refers to the ability to overcome critical moments and adapt after experiencing some unusual and unexpected situation. It also indicates return to normal." (José G Vargas-Hernández, "Urban Socio-Ecosystems Green Resilience", 2021)

"Adaptive capacity of an organisation in a complex and changing environment’ (ISO Guide 73:2009)

"The ability to resist failure or to recover quickly following a failure" (ITIL)

"The ability of an information system to continue to: (i) operate under adverse conditions or stress, even if in a degraded or debilitated state, while maintaining essential operational capabilities; and (ii) recover to an effective operational posture in a time frame consistent with mission needs." (NIST SP 800-39)

"The ability to prepare for and adapt to changing conditions and withstand and recover rapidly from disruptions. Resilience includes the ability to withstand and recover from deliberate attacks, accidents, or naturally occurring threats or incidents." (NIST SP 800-37)

"The ability to quickly adapt and recover from any known or unknown changes to the environment through holistic implementation of risk management, contingency, and continuity planning." (NIST SP 800-34 Rev. 1)

06 May 2019

Business Intelligence: Key Performance Indicators (An Introduction)

Business Intelligence

Key Performance Indicators (KPIs) are quantifiable measurements (aka metrics) that reflect the critical success factor of an organization in respect to their strategic goals and objectives. They allow measuring the progress toward reaching the defined goals and, to some degree, forecasting the further  evolution. They help keeping the focus on the goals, increases awareness in what concerns the goals and provide visibility into the business.

As they reflect an organization’s objectives, KPIs need to be anchored and aligned with them. If there’s no association with an objective then one doesn’t deal with a KPI but with other form of performance metric. Therefore KPIs need to change with the objectives, they are not fix.

One important requirement for a KPI is to be defined using SMART (specific, measurable, attainable, relevant, time-bound) criteria. Thus a KPI needs to be clear and unambiguous (specific), needs to measure the progress against a goal (measurable), needs to be realistic (attainable), needs to be relevant for the business and its current strategy (relevant), and needs to specify when the result(s) can be achieved (time-bound). To the SMART criteria some consider also the requirement for a KPI to be periodically and consistently evaluated and reviewed (trackable) and agreed between the parties afected by it (agreed).

A KPI needs to be visible within an organization, understandable and non-redundant. Even if KPIs are a tool for the upper management, their definition and impact needs to be visible and understood by all the people working with it, even if this can lead to unexpected behavior. The requirement for non-redundancy implies a partition of the KPIs to limit the cases in which two or more KPIs provide the same information.

A KPI needs to be supported by actions and needs to trigger actions. It’s nice to have KPIs reported periodically to the upper management, though as long no action is triggered, there’s no value in it. A KPI is kind of reinforcement for questions like: “why are we doing good/bad?”. The negative variations must trigger some form of action, however also the positive variation could involve further analysis to understand what caused the improvement.

The variation of a KPI needs to be supported by facts – each variation needs to be explainable in one form or another. A number without a story remains a number that can or not be trusted. Therefore, it might be needed to have further metrics or reports that support the KPIs, that can be used to identify the sources for variation, in order to understand the data.

Last but not the least KPIs need to be documented. The documentation needs to include at minimum a rough definition that includes the rationale, the boundary as well the critical values, metric’s owners, unit of measure, etc. In addition, one can add historical information about the KPI in respect to when and what caused variations, respectively how the variations were brought under control.

KPIs vary from an organization to another, the variation in not only influenced by the different goals organizations might have, but also based on the fact that organizations tend to measure different things, often the wrong things. It’s in general recommended to have a small number of KPIs that reflect in one dasboard how the business is doing and what is important for the business.

KPIs provide a basis for change by providing insights into what needs to change to improve some aspects of the business. When adequately defined and measured, KPIs provide a good perspective over an organization’s effort in achieving its goals and objectives, and therefore a good tool for monitoring and stirring organization’s strategy.

05 May 2019

Strategic Management: Defining the Strategy

Strategic Management

In a previous post an organization’s strategy was defined as a set of coordinated and sustainable actions following a set of well-defined goals, actions devised into a plan and designed to create value and overcome an organization’s challenges. In what follows are described succinctly the components of the strategy.

A strategy’s definition should start with the identification of organization’s vision, where the organization wants to be in the future, its mission statement, a precise description of what an organization does in turning the vision from concept to reality, its values - traits and qualities that are considered as representative, and its principlesthe guiding laws and truths for action. All these components have the purpose at defining at high-level the where (the vision), the why (the mission), the what (the core values) and by which means (the principles) of the strategy.

One of the next steps that can be followed in parallel is to take inventory of the available infrastructure: systems, processes, procedures, practices, policies, documentation, resources, roles and their responsibilities, KPIs and other metrics, ongoing projects and initiatives. Another step resumes in identifying the problems (challenges), risks and opportunities existing in the organization as part of a SWOT analysis adjusted to organization’s internal needs. One can extend the analysis to the market and geopolitical conditions and trends to identify further opportunities and risks. Within another step but not necessarily disconnected from the previous steps is devised where the organization could be once the problems, risks, threats and opportunities were addressed.

Then the gathered facts are divided into two perspectives – the “IS” perspective encompasses the problems together with the opportunities and threats existing in organization that define the status quo, while the “TO BE” perspective encompasses the wished state. A capability maturity model can be used to benchmark an organization’s current maturity in respect to industry practices, and, based on the wished capabilities, to identify organization’s future maturity.

Based on these the organization can start formulating its strategic goalsa set of long-range aims for a specific time-frame, from which are derived a (hierarchical) set of objectives, measurable steps an organization takes in order to achieve the goals. Each objective carries with it a rational, why the objective exists, an impact, how will the objective change the organization once achieved, and a target, how much of the objective needs to be achieved. In addition, one can link the objectives to form a set of hypothesis - predictive statements of cause and effect that involve approaches of dealing with the uncertainty. In order to pursue each objective are devised methods and means – the tactics (lines of action) that will be used to approach the various themes. It’s important to prioritize the tactics and differentiate between quick winners and long-term tactics, as well to define alternative lines of actions.

Then the tactics are augmented in a strategy plan (roadmap) that typically covers a minimum of 3 to 5 years with intermediate milestones. Following the financial cycles the strategy is split in yearly units for each objective being assigned intermediate targets. Linked to the plan are estimated the costs, effort and resources needed. Last but not the least are defined the roles, management and competency structures, with their responsibilities, competencies and proper level of authority, needed to support strategy’s implementation. Based on the set objectives are devised the KPIs used to measure the progress (success) and stir the strategy over its lifecycle.

By addressing all these aspects is created thus a first draft of the strategy that will need several iterations to mature, further changes deriving from the contact with the reality.

12 February 2018

Data Science: Correlation (Definitions)

[correlation coefficient:] "A measure to determine how closely a scatterplot of two continuous variables falls on a straight line." (Glenn J Myatt, "Making Sense of Data: A Practical Guide to Exploratory Data Analysis and Data Mining", 2006)

"A metric that measures the linear relationship between two process variables. Correlation describes the X and Y relationship with a single number (the Pearson’s Correlation Coefficient (r)), whereas regression summarizes the relationship with a line - the regression line." (Lynne Hambleton, "Treasure Chest of Six Sigma Growth Methods, Tools, and Best Practices", 2007)

[correlation coefficient:] "A measure of the degree of correlation between the two variables. The range of values it takes is between −1 and +1. A negative value of r indicates an inverse relationship. A positive value of r indicates a direct relationship. A zero value of r indicates that the two variables are independent of each other. The closer r is to +1 and −1, the stronger the relationship between the two variables." (Jae K Shim & Joel G Siegel, "Budgeting Basics and Beyond", 2008)

"The degree of relationship between business and economic variables such as cost and volume. Correlation analysis evaluates cause/effect relationships. It looks consistently at how the value of one variable changes when the value of the other is changed. A prediction can be made based on the relationship uncovered. An example is the effect of advertising on sales. A degree of correlation is measured statistically by the coefficient of determination (R-squared)." (Jae K Shim & Joel G Siegel, "Budgeting Basics and Beyond", 2008)

"A figure quantifying the correlation between risk events. This number is between negative one and positive one." (Annetta Cortez & Bob Yehling, "The Complete Idiot's Guide® To Risk Management", 2010)

"A mechanism used to associate messages with the correct workflow service instance. Correlation is also used to associate multiple messaging activities with each other within a workflow." (Bruce Bukovics, "Pro WF: Windows Workflow in .NET 4", 2010)

"Correlation is sometimes used informally to mean a statistical association between two variables, or perhaps the strength of such an association. Technically, the correlation can be interpreted as the degree to which a linear relationship between the variables exists (i.e., each variable is a linear function of the other) as measured by the correlation coefficient." (Herbert I Weisberg, "Bias and Causation: Models and Judgment for Valid Comparisons", 2010)

"The degree of relationship between two variables; in risk management, specifically the degree of relationship between potential risks." (Annetta Cortez & Bob Yehling, "The Complete Idiot's Guide® To Risk Management", 2010)

"A predictive relationship between two factors, such that when one factor changes, you can predict the nature, direction and/or amount of change in the other factor. Not necessarily a cause-and-effect relationship." (DAMA International, "The DAMA Dictionary of Data Management", 2011)

"Organizing and recognizing one related event threat out of several reported, but previously distinct, events." (Mark Rhodes-Ousley, "Information Security: The Complete Reference" 2nd Ed., 2013)

"Association in the values of two or more variables." (Meta S Brown, "Data Mining For Dummies", 2014)

[correlation coefficient:] "A statistic that quantifies the degree of association between two or more variables. There are many kinds of correlation coefficients, depending on the type of data and relationship predicted." (K  N Krishnaswamy et al, "Management Research Methodology: Integration of Principles, Methods and Techniques", 2016)

"The degree of association between two or more variables." (K  N Krishnaswamy et al, "Management Research Methodology: Integration of Principles, Methods and Techniques", 2016)

"A statistical measure that indicates the extent to which two variables are related. A positive correlation indicates that, as one variable increases, the other increases as well. For a negative correlation, as one variable increases, the other decreases." (Jonathan Ferrar et al, "The Power of People: Learn How Successful Organizations Use Workforce Analytics To Improve Business Performance", 2017)

28 April 2017

Data Management: Completeness (Definitions)

"A characteristic of information quality that measures the degree to which there is a value in a field; synonymous with fill rate. Assessed in the data quality dimension of Data Integrity Fundamentals." (Danette McGilvray, "Executing Data Quality Projects", 2008)

"Containing by a composite data all components necessary to full description of the states of a considered object or process." (Juliusz L Kulikowski, "Data Quality Assessment", 2009)

"An inherent quality characteristic that is a measure of the extent to which an attribute has values for all instances of an entity class." (David C Hay, "Data Model Patterns: A Metadata Map", 2010)

"Completeness is a dimension of data quality. As used in the DQAF, completeness implies having all the necessary or appropriate parts; being entire, finished, total. A dataset is complete to the degree that it contains required attributes and a sufficient number of records, and to the degree that attributes are populated in accord with data consumer expectations. For data to be complete, at least three conditions must be met: the dataset must be defined so that it includes all the attributes desired (width); the dataset must contain the desired amount of data (depth); and the attributes must be populated to the extent desired (density). Each of these secondary dimensions of completeness can be measured differently." (Laura Sebastian-Coleman, "Measuring Data Quality for Ongoing Improvement ", 2012)

"Completeness is defined as a measure of the presence of core source data elements that, exclusive of derived fields, must be present in order to complete a given business process." (Rajesh Jugulum, "Competing with High Quality Data", 2014)

"Complete existence of all values or attributes of a record that are necessary." (Boris Otto & Hubert Österle, "Corporate Data Quality", 2015)

"The degree to which all data has been delivered or stored and no values are missing. Examples are empty or missing records." (Piethein Strengholt, "Data Management at Scale", 2020)

"The degree to which elements that should be contained in the model are indeed there." (Panos Alexopoulos, "Semantic Modeling for Data", 2020)

"The degree of data representing all properties and instances of the real-world context." (Zhamak Dehghani, "Data Mesh: Delivering Data-Driven Value at Scale", 2021)

"Data is considered 'complete' when it fulfills expectations of comprehensiveness." (Precisely) [source]

"The degree to which all required measures are known. Values may be designated as “missing” in order not to have empty cells, or missing values may be replaced with default or interpolated values. In the case of default or interpolated values, these must be flagged as such to distinguish them from actual measurements or observations. Missing, default, or interpolated values do not imply that the dataset has been made complete." (CODATA)

12 April 2017

Data Management: Accessibility (Definitions)

"Capable of being reached, capable of being used or seen." (Martin J Eppler, "Managing Information Quality" 2nd Ed., 2006)

"The degree to which data can be obtained and used." (Danette McGilvray, "Executing Data Quality Projects", 2008)

"The opportunity to find, as well as the ease and convenience associated with locating, information. Often, this is related to the physical location of the individual seeking the information and the physical location of the information in a book or journal." (Jimmie L Joseph & David P Cook, "Medical Ethical and Policy Issues Arising from RIA", 2008)

"An inherent quality characteristic that is a measure of the ability to access data when it is required." (David C Hay, "Data Model Patterns: A Metadata Map", 2010)

"The ability to readily obtain data when needed." (DAMA International, "The DAMA Dictionary of Data Management", 2011)

"Accessibility refers to the difficulty level for users to obtain data. Accessibility is closely linked with data openness, the higher the data openness degree, the more data types obtained, and the higher the degree of accessibility." (Li Cai & Yangyong Zhu, "The Challenges of Data Quality and Data Quality Assessment in the Big Data Era", 2015) [source]

"It is the state of each user to have access to any information at any time." (ihsan Eken & Basak Gezmen, "Accessibility for Everyone in Health Communication Mobile Application Usage", 2020)

"Data accessibility measures the extent to which government data are provided in open and re-usable formats, with their associated metadata." (OECD)

20 February 2017

Data Management: Timeliness (Definitions)

"Coming early or at the right, appropriate or adapted to the times or the occasion." (Martin J Eppler, "Managing Information Quality" 2nd Ed., 2006)

[timeliness & availability] "A data quality dimension that measures the degree to which data are current and available for use as specified, and in the time frame in which they are expected." (Danette McGilvray, "Executing Data Quality Projects", 2008)

"the ability of a task to repeatedly meet its timeliness requirements." (Bruce P Douglass, "Real-Time Agility: The Harmony/ESW Method for Real-Time and Embedded Systems Development", 2009)

"A pragmatic quality characteristic that is a measure of the relative availability of data to support a given process within the timetable required to perform the process." (David C Hay, "Data Model Patterns: A Metadata Map", 2010)

"1.The degree to which available data meets the currency requirements of information consumers. 2.The length of time between data availability and the event or phenomenon they describe." (DAMA International, "The DAMA Dictionary of Data Management", 2011)

"Timeliness is a dimension of data quality related to the availability and currency of data. As used in the DQAF, timeliness is associated with data delivery, availability, and processing. Timeliness is the degree to which data conforms to a schedule for being updated and made available. For data to be timely, it must be delivered according to schedule." (Laura Sebastian-Coleman, "Measuring Data Quality for Ongoing Improvement ", 2012)

"The degree to which the model contains elements that reflect the current version of the world Transitive Relation When a relation R is transitive then if R links entity A to entity B, and entity B to entity C, then it also links A to C." (Panos Alexopoulos, "Semantic Modeling for Data", 2020)

"The degree to which the actual time and processing time are separated. The timelier the data is, the smaller the gap is between actual time and record time."  (Zhamak Dehghani, "Data Mesh: Delivering Data-Driven Value at Scale", 2021)

"Length of time between data availability and the event or phenomenon they describe." (SDMX) 

13 April 2016

Strategic Management: Churn (Definitions)

"In a subscription service, the ratio of customers lost to customers gained." (Ralph Kimball & Margy Ross, "The Data Warehouse Toolkit" 2nd Ed., 2002)

"Reflects the tendency of subscribers to switch services." (Glenn J Myatt, "Making Sense of Data: A Practical Guide to Exploratory Data Analysis and Data Mining", 2006)

"The phenomenon of customers leaving your business to go to a competitor. Churn implies the customer might or might not return. “Churn reduction” is another way of saying customer retention and is a major goal of CRM programs. Churn is most often used in conjunction with commodity businesses such as telcos, utilities, and airlines." (Evan Levy & Jill Dyché, "Customer Data Integration", 2006)

"Reflects the tendency of subscribers to switch services." (Glenn J Myatt, "Making Sense of Data: A Practical Guide to Exploratory Data Analysis and Data Mining", 2007)

"Also known as customer attrition, this is a term used by businesses to describe the loss of clients or customers." (Martin Oberhofer et al, "The Art of Enterprise Information Architecture", 2010)

"A customer switches to a competitor's service." (Linda Volonino & Efraim Turban, "Information Technology for Management 8th Ed", 2011)

[viral churn:] "A situation in which individuals cancel their services because other people in their network have canceled their service. Common reasons include being made aware of better options and pull-through by leveraging positive network externalities." (Evan Stubbs, "Delivering Business Analytics: Practical Guidelines for Best Practice", 2013)

"A term that refers to a customers going to a different provider. Depending on the context, it may refer to a total migration away from the organization in question to a reduction in consumption." (Evan Stubbs, "Delivering Business Analytics: Practical Guidelines for Best Practice", 2013)

10 February 2016

Strategic Management: Recovery Time Objective (RTO)

"Following a disaster, the amount of time that a system may be offline before it must be up and running." (Tom Petrocelli, "Data Protection and Information Lifecycle Management", 2005)

"The period of time within which systems, applications, or functions must be recovered after an outage (e.g., one business day). RTOs are often used as the basis for the development of recovery strategies, and as a determinant as to whether or not to implement the recovery strategies during a disaster situation." (Disaster Recovery Journal & DRI, 2007)

"This is a measure indicating how quickly after an outage IT infrastructure needs to be recovered to continue operations. The smaller the number, the quicker the solution must be able to be recovered." (Martin Oberhofer et al, "The Art of Enterprise Information Architecture", 2010)

"The intent to recover lost applications, within specific time limitations, to assure a certain level of operational continuity. Expresses the amount of time a business will tolerate the computing system (hardware, software, services) to be offline." (DAMA International, "The DAMA Dictionary of Data Management", 2011)

"An expression of the amount of time a business will tolerate the computing system (hardware, software, DBMS, services) to be offline." (Craig S Mullins, "Database Administration", 2012)

"in disaster recovery planning, the expected amount of time between the disaster, and when services are restored." (Bill Holtsnider & Brian D Jaffe, "IT Manager's Handbook" 3rd Ed., 2012)

"In disaster recovery planning, the total time one can allow for their systems to be offline." (IBM, "Informix Servers 12.1", 2014)

"The earliest time period and a service level within which a business process must be restored after a disaster to avoid unacceptable consequences." (Adam Gordon, "Official (ISC)2 Guide to the CISSP CBK" 4th Ed., 2015)

"The target time set for resumption of product, service, or activity delivery after an incident. It is the maximum allowable downtime that can occur without severely impacting the recovery of operations or the time in which systems, applications, or business functions must be recovered after an outage (for example, the point in time at which a process can no longer be inoperable)." (William Stallings, "Effective Cybersecurity: A Guide to Using Best Practices and Standards", 2018)

09 February 2016

Strategic Management: Critical Success Factor (Definitions)

"A brief listing of what should be monitored closely on an ongoing basis to ensure that the project is proceeding adequately. Also known as the project vital signs or metrics." (Timothy J  Kloppenborg et al, "Project Leadership", 2003)

"Those things which must go right for the organization to achieve its mission." (Tilak Mitra et al, "SOA Governance", 2008)

[success criteria:] "According to cybernetic theory, in a feedback loop the set point that determines the extent to which a system process meets its process objective. This must be expressed in terms of either a 'Minimum value' or a 'Maximum value' of an attribute." (David C Hay, "Data Model Patterns: A Metadata Map", 2010)

"An element that is necessary for an organization or project to achieve its mission." (Janice M Roehl-Anderson, "IT Best Practices for Financial Managers", 2010)

[success criteria:] "A measurable result the project has to deliver in order for the customer to say the project is a success." (Bonnie Biafore, "Successful Project Management: Applying Best Practices and Real-World Techniques with Microsoft® Project", 2011)

"Activities that your business undertakes with the aim of meeting strategic long-term goals. CSFs are measured with performance indicators." (Gina Abudi & Brandon Toropov, "The Complete Idiot's Guide to Best Practices for Small Business", 2011)

"One of the few most important prerequisite conditions necessary for an enterprise to reach its goals." (DAMA International, "The DAMA Dictionary of Data Management", 2011)

"The most essential factors that must go right or be closely tracked in order to ensure an organization's survival and success." (Linda Volonino & Efraim Turban, "Information Technology for Management" 8th Ed., 2011)

[success criteria:] "Specific and unequivocal statements that indicate how the project manager or project sponsor will know that a project achieved its goal, often reflecting strategic business goals." (Bonnie Biafore & Teresa Stover, "Your Project Management Coach: Best Practices for Managing Projects in the Real World", 2012)

"The requirements for strategic success in a particular industry at a particular point in time." (Duncan Angwin & Stephen Cummings, "The Strategy Pathfinder" 3rd Ed., 2017)

"Sources of competitive advantage within an industry." (Robert M Grant, "Contemporary Strategy Analysis"10th Ed., 2018)

"The key things that the organization must do extremely well to overcome today’s problems and the roadblocks to meeting the Mission and Vision Statements." (H James Harrington & William S Ruggles, "Project Management for Performance Improvement Teams", 2018)

"An element necessary for an organization or project to achieve its mission. Critical success factors are the critical factors or activities required for ensuring the success." (ISTQB)

"something that must happen if a process, project, plan or service is to succeed" (ITIL)

04 December 2015

Business Intelligence: Measures/Metrics (Just the Quotes)

"The most important and frequently stressed prescription for avoiding pitfalls in the use of economic statistics, is that one should find out before using any set of published statistics, how they have been collected, analysed and tabulated. This is especially important, as you know, when the statistics arise not from a special statistical enquiry, but are a by-product of law or administration. Only in this way can one be sure of discovering what exactly it is that the figures measure, avoid comparing the non-comparable, take account of changes in definition and coverage, and as a consequence not be misled into mistaken interpretations and analysis of the events which the statistics portray." (Ely Devons, "Essays in Economics", 1961)

"If we view organizations as adaptive, problem-solving structures, then inferences about effectiveness have to be made, not from static measures of output, but on the basis of the processes through which the organization approaches problems. In other words, no single measurement of organizational efficiency or satisfaction - no single time-slice of organizational performance can provide valid indicators of organizational health." (Warren G Bennis, "General Systems Yearbook", 1962)

"[Management by objectives is] a process whereby the superior and the subordinate managers of an enterprise jointly identify its common goals, define each individual's major areas of responsibility in terms of the results expected of him, and use these measures as guides for operating the unit and assessing the contribution of each of its members." (Robert House, "Administrative Science Quarterly", 1971)

"A mature science, with respect to the matter of errors in variables, is not one that measures its variables without error, for this is impossible. It is, rather, a science which properly manages its errors, controlling their magnitudes and correctly calculating their implications for substantive conclusions." (Otis D Duncan, "Introduction to Structural Equation Models", 1975)

"Any observed statistical regularity will tend to collapse once pressure is placed upon it for control purposes." (Charles Goodhart, "Problems of Monetary Management: the U.K. Experience", 1975)

"The more any quantitative social indicator is used for social decision-making, the more subject it will be to corruption pressures and the more apt it will be to distort and corrupt the social processes it is intended to monitor." (Donald T Campbell, "Assessing the impact of planned social change", 1976)

"Reengineering is the fundamental rethinking and radical redesign of business processes to achieve dramatic improvements in critical contemporary measures of performance such as cost, quality, service and speed." (James A Champy & Michael M Hammer, "Reengineering the Corporation", 1993)

"Industrial managers faced with a problem in production control invariably expect a solution to be devised that is simple and unidimensional. They seek the variable in the situation whose control will achieve control of the whole system: tons of throughput, for example. Business managers seek to do the same thing in controlling a company; they hope they have found the measure of the entire system when they say 'everything can be reduced to monetary terms'." (Stanford Beer, "Decision and Control", 1994)

"A strategy is a set of hypotheses about cause and effect. The measurement system should make the relationships (hypotheses) among objectives (and measures) in the various perspectives explicit so that they can be managed and validated. The chain of cause and effect should pervade all four perspectives of a Balanced Scorecard." (Robert S Kaplan & David P Norton, "The Balanced Scorecard", Harvard Business Review, 1996)

"The Balanced Scorecard has its greatest impact when it is deployed to drive organizational change. [...] The Balanced Scorecard is primarily a mechanism for strategy implementation, not for strategy formulation. It can accommodate either approach for formulating business unit strategy-starting from the customer perspective, or starting from excellent internal-business-process capabilities. For whatever approach that SBU senior executives use to formulate their strategy, the Balanced Scorecard will provide an invaluable mechanism for translating that strategy into specific objectives, measures, and targets, and monitoring the implementation of that strategy during subsequent periods." (Robert S Kaplan & David P Norton, "The Balanced Scorecard", Harvard Business Review, 1996)

"The Balanced Scorecard translates mission and strategy into objectives and measures, organized into four different perspectives: financial, customer, internal business process, and learning and growth. The scorecard provides a framework, a language, to communicate mission and strategy; it uses measurement to inform employees about the drivers of current and future success." (Robert S Kaplan & David P Norton, "The Balanced Scorecard", Harvard Business Review, 1996)

"When a measure becomes a target, it ceases to be a good measure." (Marilyn Strathern, "‘Improving ratings’: audit in the British University system", 1997)

"Since the average is a measure of location, it is common to use averages to compare two data sets. The set with the greater average is thought to ‘exceed’ the other set. While such comparisons may be helpful, they must be used with caution. After all, for any given data set, most of the values will not be equal to the average." (Donald J Wheeler, "Understanding Variation: The Key to Managing Chaos" 2nd Ed., 2000)

"First, good statistics are based on more than guessing. [...] Second, good statistics are based on clear, reasonable definitions. Remember, every statistic has to define its subject. Those definitions ought to be clear and made public. [...] Third, good statistics are based on clear, reasonable measures. Again, every statistic involves some sort of measurement; while all measures are imperfect, not all flaws are equally serious. [...] Finally, good statistics are based on good samples." (Joel Best, "Damned Lies and Statistics: Untangling Numbers from the Media, Politicians, and Activists", 2001)

"Statistics depend on collecting information. If questions go unasked, or if they are asked in ways that limit responses, or if measures count some cases but exclude others, information goes ungathered, and missing numbers result. Nevertheless, choices regarding which data to collect and how to go about collecting the information are inevitable." (Joel Best, "More Damned Lies and Statistics: How numbers confuse public issues", 2004)

"If the KPIs you currently have are not creating change, throw them out because there is a good chance that they may be wrong. They are probably measures that were thrown together without the in-depth research and investigation KPIs truly deserve." (David Parmenter, "Pareto’s 80/20 Rule for Corporate Accountants", 2007)

"Key performance indicators (KPIs) are the vital navigation instruments used by managers to understand whether their business is on a successful voyage or whether it is veering off the prosperous path. The right set of indicators will shine light on performance and highlight areas that need attention. ‘What gets measured gets done’ and ‘if you can’t measure it, you can’t manage it’ are just two of the popular sayings used to highlight the critical importance of metrics. Without the right KPIs managers are sailing blind." (Bernard Marr, "Key Performance Indicators (KPI): The 75 measures every manager needs to know", 2011)

"A statistical index has all the potential pitfalls of any descriptive statistic - plus the distortions introduced by combining multiple indicators into a single number. By definition, any index is going to be sensitive to how it is constructed; it will be affected both by what measures go into the index and by how each of those measures is weighted." (Charles Wheelan, "Naked Statistics: Stripping the Dread from the Data", 2012)

"Even if you have a solid indicator of what you are trying to measure and manage, the challenges are not over. The good news is that 'managing by statistics' can change the underlying behavior of the person or institution being managed for the better. If you can measure the proportion of defective products coming off an assembly line, and if those defects are a function of things happening at the plant, then some kind of bonus for workers that is tied to a reduction in defective products would presumably change behavior in the right kinds of ways. Each of us responds to incentives (even if it is just praise or a better parking spot). Statistics measure the outcomes that matter; incentives give us a reason to improve those outcomes." (Charles Wheelan, "Naked Statistics: Stripping the Dread from the Data", 2012)

"Once these different measures of performance are consolidated into a single number, that statistic can be used to make comparisons […] The advantage of any index is that it consolidates lots of complex information into a single number. We can then rank things that otherwise defy simple comparison […] Any index is highly sensitive to the descriptive statistics that are cobbled together to build it, and to the weight given to each of those components. As a result, indices range from useful but imperfect tools to complete charades." (Charles Wheelan, "Naked Statistics: Stripping the Dread from the Data", 2012)

"No subjective metric can escape strategic gaming [...] The possibility of mischief is bottomless. Fighting ratings is fruitless, as they satisfy a very human need. If one scheme is beaten down, another will take its place and wear its flaws. Big Data just deepens the danger. The more complex the rating formulas, the more numerous the opportunities there are to dress up the numbers. The larger the data sets, the harder it is to audit them." (Kaiser Fung, "Numbersense: How To Use Big Data To Your Advantage", 2013)

"The urge to tinker with a formula is a hunger that keeps coming back. Tinkering almost always leads to more complexity. The more complicated the metric, the harder it is for users to learn how to affect the metric, and the less likely it is to improve it." (Kaiser Fung, "Numbersense: How To Use Big Data To Your Advantage", 2013)

"Until a new metric generates a body of data, we cannot test its usefulness. Lots of novel measures hold promise only on paper." (Kaiser Fung, "Numbersense: How To Use Big Data To Your Advantage", 2013)

"[…] an overall green status indicator doesn’t mean anything most of the time. All it says is that the things under measurement seem okay. But there always will be many more things not under measurement. To celebrate green indicators is to ignore the unknowns. […] The tendency to roll up metrics into dashboards promotes ignorance of the real situation on the ground. We forget that we only see what is under measurement. We only act when something is not green." (Sriram Narayan, "Agile IT Organization Design: For Digital Transformation and Continuous Delivery", 2015)

"Financial measures are a quantification of an activity that has taken place; we have simply placed a value on the activity. Thus, behind every financial measure is an activity. I call financial measures result indicators, a summary measure. It is the activity that you will want more or less of. It is the activity that drives the dollars, pounds, or yen. Thus financial measures cannot possibly be KPIs." (David Parmenter, "Key Performance Indicators: Developing, implementing, and using winning KPIs" 3rd Ed., 2015)

"'Getting it right the first time' is a rare achievement, and ascertaining the organization’s winning KPIs and associated reports is no exception. The performance measure framework and associated reporting is just like a piece of sculpture: you can be criticized on taste and content, but you can’t be wrong. The senior management team and KPI project team need to ensure that the project has a just-do-it culture, not one in which every step and measure is debated as part of an intellectual exercise." (David Parmenter, "Key Performance Indicators: Developing, implementing, and using winning KPIs" 3rd Ed., 2015)

"In order to get measures to drive performance, a reporting framework needs to be developed at all levels within the organization." (David Parmenter, "Key Performance Indicators: Developing, implementing, and using winning KPIs" 3rd Ed., 2015)

"Most organizational measures are very much past indicators measuring events of the last month or quarter. These indicators cannot be and never were KPIs." (David Parmenter, "Key Performance Indicators: Developing, implementing, and using winning KPIs" 3rd Ed., 2015)

"Rolling up fine-grained metrics to create high-level dashboards puts pressure on teams to keep the fine-grained metrics green even when it might not be the best use of their time." (Sriram Narayan, "Agile IT Organization Design: For Digital Transformation and Continuous Delivery", 2015)

"Scaling supervision using metrics is one thing; scaling results is quite another. The former doesn’t automatically ensure the latter." (Sriram Narayan, "Agile IT Organization Design: For Digital Transformation and Continuous Delivery", 2015)

"We need indicators of overall performance that need only be reviewed on a monthly or bimonthly basis. These measures need to tell the story about whether the organization is being steered in the right direction at the right speed, whether the customers and staff are happy, and whether we are acting in a responsible way by being environmentally friendly. These measures are called key result indicators (KRIs)." (David Parmenter, "Key Performance Indicators: Developing, implementing, and using winning KPIs" 3rd Ed., 2015)

"GIGO is a famous saying coined by early computer scientists: garbage in, garbage out. At the time, people would blindly put their trust into anything a computer output indicated because the output had the illusion of precision and certainty. If a statistic is composed of a series of poorly defined measures, guesses, misunderstandings, oversimplifications, mismeasurements, or flawed estimates, the resulting conclusion will be flawed." (Daniel J Levitin, "Weaponized Lies", 2017)

"To be any good, a sample has to be representative. A sample is representative if every person or thing in the group you’re studying has an equally likely chance of being chosen. If not, your sample is biased. […] The job of the statistician is to formulate an inventory of all those things that matter in order to obtain a representative sample. Researchers have to avoid the tendency to capture variables that are easy to identify or collect data on - sometimes the things that matter are not obvious or are difficult to measure." (Daniel J Levitin, "Weaponized Lies", 2017)

"Statistical metrics can show us facts and trends that would be impossible to see in any other way, but often they’re used as a substitute for relevant experience, by managers or politicians without specific expertise or a close-up view." (Tim Harford, "The Data Detective: Ten easy rules to make sense of statistics", 2020)

19 February 2015

Business Intelligence: Measurement (Definitions)

[process measurement] "The set of definitions, methods, and activities used to take measurements of a process and its resulting products for the purpose of characterizing and understanding the process." (Sandy Shrum et al, "CMMI: Guidelines for Process Integration and Product Improvement, Second Edition", 2006)

"Measurement is understood as a continuous process during which process metrics are defined and measurement data are collected, analyzed, and evaluated. The objective is to understand, control, and optimize processes, for instance, to improve project control, reduce development effort and cost, or to improve on work products." (Lars Dittmann et al, "Automotive SPICE in Practice", 2008)

[process measurement] "An evaluation of the performance of a system process.  A measurement from the system process is compared to determine whether it is below the 'Minimum value' or above the 'Maximum value' of the success criterion for that system process. If so, it is the source of a system event type that is the trigger of another system process to correct the situation." (David C Hay, "Data Model Patterns: A Metadata Map", 2010)

"Systematically determining or estimating dimension, quantity, and capacity in order to assign value." (Joan C Dessinger, "Fundamentals of Performance Improvement." 3rd Ed, 2012)

"The process of measurement is the act of ascertaining the size, amount, or degree of something. Measurements are the results of the process of measuring." (Laura Sebastian-Coleman, "Measuring Data Quality for Ongoing Improvement ", 2012)

"The process of determining the monetary amounts at which the elements of the financial statements are to be recognised and carried in the balance sheet [statement of financial position] and income statement [statement of comprehensive income]." (Project Management Institute, "The Standard for Program Management  3rd Ed..", 2013)

"(1) An instance of a measurement (a 'data point'). (2) The activity or process of making a measurement; for example, mapping empirical values to numbers or symbols of a measurement scale." (Richard D Stutzke, "Estimating Software-Intensive Systems: Projects, Products, and Processes", 2005)

"The process of assigning a number or category to an entity to describe an attribute of that entity." (ISO 14598)

Related Posts Plugin for WordPress, Blogger...

About Me

My photo
IT Professional with more than 24 years experience in IT in the area of full life-cycle of Web/Desktop/Database Applications Development, Software Engineering, Consultancy, Data Management, Data Quality, Data Migrations, Reporting, ERP implementations & support, Team/Project/IT Management, etc.