Showing posts with label tools. Show all posts

08 February 2025

🌌🏭KQL Reloaded: First Steps (Part VIII: Translating SQL to KQL - Full Joins)

One of the great features of KQL is the possibility of translating SQL code to KQL via the "explain" keyword, allowing thus to port SQL code to KQL, respectively help translate knowledge from one programming language to another. 

Let's start with a basic example:

// transform SQL to KQL code (to be run only the first part from --)
--
explain
SELECT top(10) CustomerKey, FirstName, LastName, CityName, CompanyName 
FROM Customers 
ORDER BY CityName DESC

// output: translated KQL code 
Customers
| project CustomerKey, FirstName, LastName, CityName, CompanyName
| sort by CityName desc nulls first
| take int(10)

The most interesting part of the translation is how "explain" translate joins from SQL to KQL. Let's start with a FULL JOIN from the set of patterns considered in a previous post on SQL joins:

--
explain
SELECT CST.CustomerKey
, CST.FirstName + ' ' + CST.LastName CustomerName
, Cast(SAL.DateKey as Date) DateKey
, SAL.TotalCost
FROM NewSales SAL
    JOIN Customers CST
      ON SAL.CustomerKey = CST.CustomerKey 
WHERE SAL.DateKey > '20240101' AND SAL.DateKey < '20240201'
ORDER BY CustomerName, DateKey, TotalCost DESC

And, here's the translation:

// translated code
NewSales
| project-rename ['SAL.DateKey']=DateKey
| join kind=inner (Customers
| project-rename ['CST.CustomerKey']=CustomerKey
    , ['CST.CityName']=CityName
    , ['CST.CompanyName']=CompanyName
    , ['CST.ContinentName']=ContinentName
    , ['CST.Education']=Education
    , ['CST.FirstName']=FirstName
    , ['CST.Gender']=Gender
    , ['CST.LastName']=LastName
    , ['CST.MaritalStatus']=MaritalStatus
    , ['CST.Occupation']=Occupation
    , ['CST.RegionCountryName']=RegionCountryName
    , ['CST.StateProvinceName']=StateProvinceName) 
    on ($left.CustomerKey == $right.['CST.CustomerKey'])
| where ((['SAL.DateKey'] > todatetime("20240101")) 
    and (['SAL.DateKey'] < todatetime("20240201")))
| project ['CST.CustomerKey']
    , CustomerName=__sql_add(__sql_add(['CST.FirstName']
    , " "), ['CST.LastName'])
    , DateKey=['SAL.DateKey']
    , TotalCost
| sort by CustomerName asc nulls first
    , DateKey asc nulls first
    , TotalCost desc nulls first
| project-rename CustomerKey=['CST.CustomerKey']

The code was slightly formatted to facilitated its reading. Unfortunately, the tool doesn't work well with table aliases, introduces also all the fields available from the dimension table, which can become a nightmare for the big dimension tables, the concatenation seems strange, and if one looks deeper, further issues can be identified. So, the challenge is how to write a query in SQL so it can minimize the further changed in QKL.

Probably, one approach is to write the backbone of the query in SQL and add the further logic after translation. 

--
explain
SELECT NewSales.CustomerKey
, NewSales.DateKey 
, NewSales.TotalCost
FROM NewSales 
    INNER JOIN Customers 
      ON NewSales.CustomerKey = Customers.CustomerKey 
WHERE DateKey > '20240101' AND DateKey < '20240201'
ORDER BY NewSales.CustomerKey
, NewSales.DateKey

And the translation looks simpler:

// transformed query
NewSales
| join kind=inner 
(Customers
| project-rename ['Customers.CustomerKey']=CustomerKey
    , ['Customers.CityName']=CityName
    , ['Customers.CompanyName']=CompanyName
    , ['Customers.ContinentName']=ContinentName
    , ['Customers.Education']=Education
    , ['Customers.FirstName']=FirstName
    , ['Customers.Gender']=Gender
    , ['Customers.LastName']=LastName
    , ['Customers.MaritalStatus']=MaritalStatus
    , ['Customers.Occupation']=Occupation
    , ['Customers.RegionCountryName']=RegionCountryName
    , ['Customers.StateProvinceName']=StateProvinceName) 
    on ($left.CustomerKey == $right.['Customers.CustomerKey'])
| where ((DateKey > todatetime("20240101")) 
    and (DateKey < todatetime("20240201")))
| project CustomerKey, DateKey, TotalCost
| sort by CustomerKey asc nulls first
, DateKey asc nulls first

I would have written the query as follows:

// transformed final query
NewSales
| where (DateKey > todatetime("20240101")) 
    and (DateKey < todatetime("20240201"))
| join kind=inner (
    Customers
    | project CustomerKey
        , FirstName
        , LastName 
    ) on $left.CustomerKey == $right.CustomerKey
| project CustomerKey
    , CustomerName = strcat(FirstName, ' ', LastName)
    , DateKey
    , TotalCost
| sort by CustomerName asc nulls first
    , DateKey asc nulls first

So, it makes sense to create the backbone of a query, translate it to KQL via explain, remove the unnecessary columns and formatting, respectively add what's missing. Once the patterns were mastered, there's probably no need to use the translation tool, but could prove to be also some exceptions. Anyway, the translation tool helps considerably in learning. Big kudos for the development team!

Notes:
1) The above queries ignore the fact that Customer information is available also in the NewSales table, making thus the joins obsolete. The joins were considered only for exemplification purposes. Similar joins might be still needed for checking the "quality" of the data (e.g. for dimensions that change over time). Even if such "surprises" shouldn't appear by design, real life designs continue to surprise...
2) Queries should be less verbose by design (aka simplicity by design)! The more unnecessary code is added, the higher the chances for errors to be overseen, respectively the more time is needed to understand and validated the queries!

Happy coding!

Previous Post <<||>> Next Post

References
[1] Microsoft Lear n (2024) Azure: Query data using T-SQL [link]

14 October 2023

💠Azure Tools & Services: The Azure Diagrams Architecture Advisor (Test Drive)

There seems to be a new tool available for the Azure community, even if the tool doesn't belong yet to the Microsoft technology stack. I'm talking about Azure Diagrams Architecture Advisor, which enables users to "design diagrams in a collaborative manner and provides guidance on which services can be integrated and when they should be utilized in your architecture". 

I took the tool for a test drive, trying to adapt an architecture I used recently for a Synapse Data Lakehouse. I used the Data Warehouse using Synapse Analytics example as source of inspiration. (You can use the links to check the latest versions.) 

Overall, it was a good experience, the functionality being straightforward to use. I needed some time to identify what resources are available, and there are a few. Even if some of the resources were missing (e.g. Dataverse and Dynamics 365 services), I could use a custom resource to fill the gap. 

One can easily drag and drop resources (see the left panel) on the canvas and create links between them. The diagram can be saved only as soon as you give it a name and sign in for an account, the email and a password are all you need for that. The diagram can be kept hidden or made available for the whole community, respectively can be saved locally as PNG or SVG files.

Azure Diagrams
Serverless Data Lakehouse

Each standard (non-custom) resource has a link to documentation, respectively to the pricing. The arrows between resources show whether the integration is supported by default. One can create bidirectional arrows by creating a second arrow from destination to source. 

The functionality is pretty basic, though I was able to generate the diagram I wanted, and I'm satisfied with the result. Unfortunately, I couldn't modify directly the example I used for inspiration. It would be great if further functionality like the one available in Visio Online could be made available (e.g. automatic alignment, copy pasting whole diagrams or parts of them, making each value editable, grouping several resources together, adding more graphical content, etc.). 

The resources and icons available focus on the Microsoft Azure technology stack. It would be great if one could import at least new icons, though ideally further resources from other important software vendors should be supported (e.g. AWS, Oracle, Adobe, etc.).

The possibility to define further links (e.g. to the actual environments) or properties (e.g. environment names), respectively to change the views for the whole diagram could enhance the usability of such diagrams. 

Microsoft should think seriously about including this tool in their stack, if not in Visio Online at least as standalone product!

Besides the examples and the shared diagrams available you can browse also through the collection of Azure Architectures.

To summarize, here are the improvements suggested:
- save and modify directly the examples;
- automatic alignment of resources within the canvas;
- copy pasting whole diagrams or parts of them;
- make each value editable;
- group several resources together (e.g. in a layer);
- adding more graphical content;
- import new icons;
- support resources from other important software vendors (e.g. AWS, Oracle, Adobe, etc.);
- define further links (e.g. to the actual environments);
- define further properties (e.g. environment names);
- change the views for the whole diagram;
- integration into Visio Online.

29 March 2021

Notes: Team Data Science Process (TDSP)

Team Data Science Process (TDSP)
Acronyms:
Artificial Intelligence (AI)
Cross-Industry Standard Process for Data Mining (CRISP-DM)
Data Mining (DM)
Knowledge Discovery in Databases (KDD)
Team Data Science Process (TDSP) 
Version Control System (VCS)
Visual Studio Team Services (VSTS)

Resources:
[1] Microsoft Azure (2020) What is the Team Data Science Process? [source]
[2] Microsoft Azure (2020) The business understanding stage of the Team Data Science Process lifecycle [source]
[3] Microsoft Azure (2020) Data acquisition and understanding stage of the Team Data Science Process [source]
[4] Microsoft Azure (2020) Modeling stage of the Team Data Science Process lifecycle [source
[5] Microsoft Azure (2020) Deployment stage of the Team Data Science Process lifecycle [source]
[6] Microsoft Azure (2020) Customer acceptance stage of the Team Data Science Process lifecycle [source]

20 March 2021

🧭Business Intelligence: New Technologies, Old Challenges (Part I: An Introduction)

Business Intelligence

Each important technology has the potential of creating divides between the specialists from a given field. This aspect is more suggestive in the data-driven fields like BI/Analytics or Data Warehousing. The data professionals (engineers, scientists, analysts, developers) skilled only in the new wave of technologies tend to disregard the role played by the former technologies and their role in the data landscape. The argumentation for such behavior is rooted in the belief that a new technology is better and can solve any problem better than previous technologies did. It’s a kind of mirage professionals and customers can easily fall under.

Being bigger, faster, having new functionality, doesn’t make a tool the best choice by default. The choice must be rooted in the problem to be solved and the set of requirements it comes with. Just because a vibratory rammer is a new technology, is faster and has more power in applying pressure, this doesn’t mean that it will replace a hammer. Where a certain type of power is needed the vibratory rammer might be the best tool, while for situations in which a minimum of power and probably more precision is needed, like driving in a nail, then an adequately sized hammer will prove to be a better choice.

A technology is to be used in certain (business/technological) contexts, and even if contexts often overlap, the further details (aka requirements) should lead to the proper use of tools. It’s in a professional’s duties to be able to differentiate between contexts, requirements and the capabilities of the tools appropriate for each context. In this resides partially a professional’s mastery over its field of work and of providing adequate solutions for customers’ needs. Especially in IT, it’s not enough to master the new tools but also have an understanding about preceding tools, usage contexts, capabilities and challenges.

From an historical perspective each tool appeared to fill a demand, and even if maybe it didn’t manage to fill it adequately, the experience obtained can prove to be valuable in one way or another. Otherwise, one risks reinventing the wheel, or more dangerously, repeating the failures of the past. Each new technology seems to provide a deja-vu from this perspective.

Moreover, a new technology provides new opportunities and requires maybe to change our way of thinking in respect to how the technology is used and the processes or techniques associated with it. Knowledge of the past technologies help identifying such opportunities easier. How a tool is used is also a matter of skills, while its appropriate use and adoption implies an inherent learning curve. Having previous experience with similar tools tends to reduce the learning curve considerably, though hands-on learning is still necessary, and appropriate learning materials or tutoring is upon case needed for a smoother transition.

In what concerns the implementation of mature technologies, most of the challenges were seldom the technologies themselves but of non-technical nature, ranging from the poor understanding/knowledge about the tools, their role and the implications they have for an organization, to an organization’s maturity in leading projects. Even the most-advanced technology can fail in the hands of non-experts. Experience can’t be judged based only on the years spent in the field or the number of projects one worked on, but on the understanding acquired about implementation and usage’s challenges. These latter aspects seem to be widely ignored, even if it can make the difference between success and failure in a technology’s implementation.

Ultimately, each technology is appropriate in certain contexts and a new technology doesn’t necessarily make another obsolete, at least not until the old contexts become obsolete.

Previous Post <<||>>Next Post

31 December 2020

📊Graphical Representation: Graphics We Live by (Part V: Pie Charts in MS Excel)

Graphical Representation

From business dashboards to newspapers and other forms of content that capture the attention of average readers, pie charts seem to be one of the most used forms of graphical representation. Unfortunately, their characteristics make them inappropriate for displaying certain types of data, and of being misused. Therefore, there are many voices who advice against using them for any form of display.

It’s hard to agree with radical statements like ‘avoid (using) pie charts’ or ’pie charts are bad’. Each form of graphical representation (aka graphical tool, graphic) has advantages and disadvantages, which makes it appropriate or inappropriate for displaying data having certain characteristics. In addition, each tool can be easily misused, especially when basic representational practices are ignored. Avoiding one representational tool doesn’t mean that the use of another tool will be correct. Therefore, it’s important to make people aware of these aspects and let them decide which tools they should use. 

From a graphical tool is expected to represent and describe a dataset in a small area without distorting the reality, while encouraging the reader to compare the different pieces of information, when possible at different levels of details [1] or how they change over time. As form of communication, they encode information and meaning; the reader needs to be able to read, understand and think critically about graphics and data – what is known as graphical/data literacy.

A pie chart consists of a circle split into wedge-shaped slices (aka edges, segments), each slice representing a group or category (aka component). It resembles with the spokes of a wheel, however with a few exceptions they are seldom equidistant. The size of each slice is proportional to the percentage of the component when compared to the whole. Therefore, pie charts are ideal when displaying percentages or values that can be converted into percentages. Thus, the percentages must sum up to 100% (at least that’s readers’ expectation).

Within or besides the slices are displayed components’ name and sometimes the percentages or other numeric or textual information associated with them (Fig. 1-4).  The percentages become important when the slices seem to be of equal sizes. As long the slices have the same radius, comparison of the different components resumes in comparing arcs of circles or the chords defined by them, thing not always straightforward. 3-dimensional displays can upon case make the comparison more difficult.

Pie Chart Examples

The comparison increases in difficulty with the number of slices increases beyond a certain number. Therefore, it’s not recommended displaying more than 5-10 components within the same chart. If the components exceed this limit, the exceeding components can be summed up within an “other” component. 

Within a graphic one needs a reference point that can be used as starting point for exploration. Typically for categorical data this reference point is the biggest or the smallest value, the other values being sorted in ascending, respectively descending order, fact that facilitates comparing the values. For pie charts, this would mean sorting the slices based on their sizes, except the slice for “others” which is typically considered last.

The slices can be filled optionally with meaningful colors or (hashing) patterns. When the same color pallet is used, the size can be reflected in colors’ hue, however this can generate confusion when not applied adequately. It’s recommended to provide further (textual) information when the graphical elements can lead to misinterpretations. 

Pie charts can be used occasionally for comparing the changes of the same components between different points in time, geographies (Fig. 5-6) or other types of segmentation. Having the charts displayed besides each other and marking each component with a characteristic color or pattern facilitate the comparison. 

Pie Charts - Geographies

27 November 2020

🧊Data Warehousing: ETL (Part II: An Introduction)


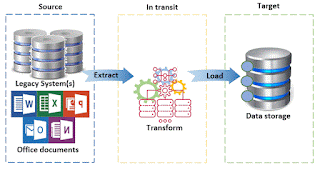
ETL (Extract, Transform, Load) processes, technologies or tools are about extracting data from one or more data sources via a set of queries, performing changes on the data via conversions, aggregations, mappings or other types of transformations, respectively loading the data into target tables or other type of repositories. Thus, an ETL process allows moving and transforming data between predefined data structures on an ad-hoc basis or as part of stable repetitive processes, which makes ETL ideal for data warehousing, data integrations, data migrations or similar scenarios. 

ETL Data Flow

Extract: The extraction of data is done typically based on SQL queries from relational databases or any OLEDB or ODBC-based data repositories including flat or MS Office files, though modern ETL tools can support other type of queries (CAML, XQuery, DAX) or even NoSQL architectures (Handoop). This allows addressing a wide range of requirements, the complexity of the logic depending on the functionality provided by the query languages, respectively the extraction functionality available.  

Transform: The transformation logic can be implemented based on the functionality provided by the ETL tool, and can involve after case any combination of aggregates, conditional splits, merges, lookups, multicasts, pivoting/unpivoting, cleansing, data conversions, sampling, mapping or any other transformations that can be performed on an in-transit dataset. On the other side, quite often the same can be achieved with the help of SQL-based manipulations directly in the extraction logic or later in the process. SQL can prove to be occasionally faster and more flexible than the transformations provided by the ETL tool, however despite the overlaps, the two approaches can complement each other when used adequately. 

Load: The load is usually just a dump of the data into one or more final or intermediary tables with predefined structures. Unless the data don’t match the data type, format or further defined constraints, the load seldom involve further challenges as long the solution was designed adequately. 

Within the logical model, extract, transform and load can be considered as process by themselves. Within the object model provided by the ETL tool, they are considered in the mentioned sequence within a data flow, which within a set of workflow constraints defines how the data move through the pipeline – the sequence of processing steps considered. The basic unit of work is the data flow and the workflow it belongs to, unit that can be encapsulated in one container for easier management or simply convenience. Several containers can be linked within a workflow to create more complex behavior. 

The data flows and workflow constraints, together with the supporting connections and containers form an ETL package, the main unit of work for encapsulating and running ETL logic. ETL packages are scheduled and run as fit for the purpose.

With the right design, these building blocks allow enough flexibility in handling ad-hoc requests or of building complex solutions. This involves decisions on how to partition the ETL packages, respectively the data flows, in which order they should be run, where and in which sequence the data should be transformed, how to handle exceptions, how to build eventually intermediary data repositories, how to handles audit requirements, and so on. Each of these choices can prove to be important. 

The knowledge of the ETL architecture and functionality is quintessential in providing the right solution for the problem considered, however once the basics were understood the challenges typically reside in understanding the source and/or target structures, the logical and physical entities available, identify the way the data can be partitioned horizontally or vertically, respectively what type of transformations are required for moving the data, as required by the solution. 

Previous Post <<||>> Next Post

30 October 2020

Data Science: Data Strategy (Part II: Generalists vs Specialists in the Field)

Data Science

Division of labor favorizes the tasks done repeatedly, where knowledge of the broader processes is not needed, where aspects as creativity are needed only at a small scale. Division invaded the IT domains as tools, methodologies and demands increased in complexity, and therefore Data Science and BI/Analytics make no exception from this.

The scale of this development gains sometimes humorous expectations or misbelieves when one hears headhunters asking potential candidates whether they are upfront or backend experts when a good understanding of both aspects is needed for providing adequate results. The development gains tragicomical implications when one is limited in action only to a given area despite the extended expertise, or when a generalist seems to step on the feet of specialists, sometimes from the right entitled reasons. 

Headhunters’ behavior is rooted maybe in the poor understanding of the domain of expertise and implications of the job descriptions. It’s hard to understand how people sustain of having knowledge about a domain just because they heard the words flying around and got some glimpse of the connotations associated with the words. Unfortunately, this is extended to management and further in the business environment, with all the implications deriving from it. 

As Data Science finds itself at the intersection between Artificial Intelligence, Data Mining, Machine Learning, Neurocomputing, Pattern Recognition, Statistics and Data Processing, the center of gravity is hard to determine. One way of dealing with the unknown is requiring candidates to have a few years of trackable experience in the respective fields or in the use of a few tools considered as important in the respective domains. Of course, the usage of tools and techniques is important, though it’s a big difference between using a tool and understanding the how, when, why, where, in which ways and by what means a tool can be used effectively to create value. This can be gained only when one’s exposed to different business scenarios across industries and is a tough thing to demand from a profession found in its baby steps. 

Moreover, being a good data scientist involves having a deep insight into the businesses, being able to understand data and the demands associated with data – the various qualitative and quantitative aspects. Seeing the big picture is important in defining, approaching and solving problems. The more one is exposed to different techniques and business scenarios, with right understanding and some problem-solving skillset one can transpose and solve problems across domains. However, the generalist will find his limitations as soon a certain depth is reached, and the collaboration with a specialist is then required. A good collaboration between generalists and specialists is important in complex projects which overreach the boundaries of one person’s knowledge and skillset. 

Complexity is addressed when one can focus on the important characteristic of the problem, respectively when the models built can reflect the demands. The most important skillset besides the use of technical tools is the ability to model problems and root the respective problems into data, to elaborate theories and check them against reality. 

Complex problems can require specialization in certain fields, though seldom one problem is dependent only on one aspect of the business, as problems occur in overreaching contexts that span sometimes the borders of an organization. In addition, the ability to solve problems seem to be impacted by the diversity of the people involved into the task, sometimes even with backgrounds not directly related to organization’s activity. As in evolution, a team’s diversity is an important factor in achievement and learning, most gain being obtained when knowledge gets shared and harnessed beyond the borders of teams.

Note:
Written as answer to a Medium post on Data Science generalists vs specialists.

25 August 2019

🛡️Information Security: Cybersecurity (Definitions)

 "The art of ensuring the existence and continuity of the Information Society of a nation, guaranteeing and protecting, in Cyberspace, its information assets and critical infrastructure." (Claudia Canongia & Raphael Mandarino, "Cybersecurity: The New Challenge of the Information Society", 2012)

"The act of protecting technology, information, and networks from attacks." (Jason Williamson, "Getting a Big Data Job For Dummies", 2015)

"The practice of protecting computers and electronic communication systems as well as the associated information." (Weiss, "Auditing IT Infrastructures for Compliance" 2nd Ed., 2015)

"Cybersecurity deals with damage to, unauthorized use of, exploitation of electronic information and communications systems that ensure confidentiality, integrity and availability." (Sanjukta Pookulangara, "Cybersecurity: What Matters to Consumers - An Exploratory Study", 2016)

"Focuses on protecting computers, networks, programs and data from unintended or unauthorized access, change or destruction." (Kimberly Lukin, "Russian Cyberwarfare Taxonomy and Cybersecurity Contradictions between Russia and EU", 2016)

"The activity or process, ability or capability, or state whereby information and communications systems and the information contained therein are protected from and/or defended against damage, unauthorized use or modification, or exploitation." (Olivera Injac & Ramo Šendelj, "National Security Policy and Strategy and Cyber Security Risks", 2016)

"The ability to protect against the unauthorized use of electronic data and malicious activity. This electronic data can be personal customer information such as names, addresses, social security numbers, credit cards, and debit cards, to name a few." (Brittany Bullard, "Style and Statistics", 2016)

"A trustworthiness property concerned with the protection of systems from cyberattacks." (O Sami Saydjari, "Engineering Trustworthy Systems: Get Cybersecurity Design Right the First Time", 2018)

"Information security (infosec) but broadly referring to technology and human systems that are built around the secure exchange, storage, and management of information." (Shalin Hai-Jew, "Safe Distances: Online and RL Hyper-Personal Relationships as Potential Attack Surfaces", 2018)

"Is defined as the collection of tools, policies, security concepts, security safeguards, guidelines, risk management approaches, actions, training, best practices, assurance and technologies that can be used to protect the cyber environment, organization, and user assets." (Thokozani I Nzimakwe, "Government's Dynamic Approach to Addressing Challenges of Cybersecurity in South Africa", 2018)

"Protection against criminal access to one’s data and information and against criminal manipulation of computer networks/data/systems." (Shalin Hai-Jew, "Beware!: A Multimodal Analysis of Cautionary Tales in Strategic Cybersecurity Messaging Online", 2018)

"The collection of tools, policies, security concepts, security safeguards, guidelines, risk management approaches, actions, training, best practices, assurance, and technologies that can be used to protect the cyberspace environment and organization and users’ assets." (William Stallings, "Effective Cybersecurity: A Guide to Using Best Practices and Standards", 2018)

"The organization and collection of resources, processes, and structures used to protect cyberspace from occurrences that misalign de jure from de facto property rights." (Mika Westerlund et al, "A Three-Vector Approach to Blind Spots in Cybersecurity", 2018)

"A computing-based discipline involving technology, people, information, and processes to enable assured operations. It involves the creation, operation, analysis, and testing of secure computer systems. It is an interdisciplinary course of study, including aspects of law, policy, human factors, ethics, and risk management in the context of adversaries." (Matt Bishop et al, "Cybersecurity Curricular Guidelines", 2019)

"Acts taken, technologies created and deployed, policies written and enacted, to protect computer systems and networks against misuse, intrusion, and exploitation." (Shalin Hai-Jew, "The Electronic Hive Mind and Cybersecurity: Mass-Scale Human Cognitive Limits to Explain the “Weakest Link” in Cybersecurity", 2019)

"Also known as computer security or IT security, is the protection of computer systems from the theft or damage to the hardware, software or the information on them, as well as from disruption or misdirection of the services they provide." (Soraya Sedkaoui, "Big Data Analytics for Entrepreneurial Success", 2019)

"Includes process, procedures, technologies, and controls designed to protect systems, networks, and data." (Sandra Blanke et al, "How Can a Cybersecurity Student Become a Cybersecurity Professional and Succeed in a Cybersecurity Career?", 2019)

"The protection of computer systems from theft and damage to their assets and from manipulation and distraction of their services." (Viacheslav Izosimov & Martin Törngren, "Security Awareness in the Internet of Everything", 2019)

"The protection of internet-connected systems including hardware, software, and data from cyberattacks."  (Semra Birgün & Zeynep Altan, "A Managerial Perspective for the Software Development Process: Achieving Software Product Quality by the Theory of Constraints", 2019)

"Cybersecurity is seen where security alerts and cyber-attacks are becoming more frequent and malicious, these threats include private access attempts and exploitation software or phishing, malware, web application attacks, and network penetration." (Theunis G Pelser & Garth Gaffley, "Implications of Digital Transformation on the Strategy Development Process for Business Leaders", 2020)

"Is the protection of internet-connected systems, including hardware, software and data, from cyberattacks. In a computing context, security comprises cybersecurity and physical security - both are used by enterprises to protect against unauthorized access to data centers and other computerized systems." (Alexander A Filatov, "Sovereign Bureaucrats vs. Global Tech Companies: Ethical and Regulatory Challenges", 2020)

"It is a general term which describes technologies, processes, methods, and practices for the purpose of protection of internet-connected information systems from attacks, i.e., cyberattacks. Cybersecurity can refer to security of data, software or hardware within information systems." (Ana Gavrovska & Andreja Samčović, "Intelligent Automation Using Machine and Deep Learning in Cybersecurity of Industrial IoT: CCTV Security and DDoS Attack Detection", 2020)

"Cybersecurity is an act to protect data, devices, applications, servers, network from the malicious attack through various tools and techniques. The process also ensures the confidentiality, integrity, availability, and non-repudiation of the content." (Shafali Agarwal, "Preserving Information Security Using Fractal-Based Cryptosystem", 2021)

"Cybersecurity refers to the set of technologies, processes, and practices designed to safeguard networks, devices, programs, and data from attack, threats, or unauthorized access." (Sanjeev Rao et al, "Online Social Networks Misuse, Cyber Crimes, and Counter Mechanisms", 2021)

"It is the organization and collection of resources, processes, and structures used to protect cyberspace from security events." (Carlos A M S Teles et al, "A Black-Box Framework for Malicious Traffic Detection in ICT Environments", Handbook of Research on Cyber Crime and Information Privacy, 2021)

"Prevention of damage to, protection of, and restoration of computers, electronic communications systems, electronic communications services, wire communication, and electronic communication, including information contained therein, to ensure its availability, integrity, authentication, confidentiality, and nonrepudiation." (CNSSI 4009-2015)

"The ability to protect or defend the use of cyberspace from cyber attacks." (NISTIR 8170)

"The prevention of damage to, unauthorized use of, exploitation of, and - if needed - the restoration of electronic information and communications systems, and the information they contain, in order to strengthen the confidentiality, integrity and availability of these systems." (NISTIR 8074 Vol. 2)

"The process of protecting information by preventing, detecting, and responding to attacks." (NISTIR 8183)

10 July 2019

🧱IT: Product Information Management [PIM] (Definitions)

"The management of product master data, usually via a PIM hub, to avail a single version of the truth about product data to the business." (Evan Levy & Jill Dyché, "Customer Data Integration", 2006)

"MDM Systems that focus exclusively on managing the descriptions of products are also call PIM systems." (Martin Oberhofer et al, "Enterprise Master Data Management", 2008)

"Processes and technologies focused on centrally managing information about products, with a focus on the data required to market and sell the products through one or more distribution channels. A central set of product data can be used to feed consistent, accurate, and up-to-date information to multiple output media such as websites, print catalogs, ERP systems, and electronic data feeds to trading partners. PIM systems generally need to support multiple geographic locations, multilingual data, and maintenance and modification of product information within a centralized catalog to provide consistently accurate information to multiple channels in a cost-effective manner." (Janice M Roehl-Anderson, "IT Best Practices for Financial Managers", 2010)

"Processes and tools used to predict and evaluate success of products through marketing and sales efforts." (DAMA International, "The DAMA Dictionary of Data Management", 2011)

"Product Information Management (PIM) is the process, techniques and technology of gaining control over a company's product marketing information. The objective of PIM solutions is to remove inefficiency in the marketing supply chain by delivering information to sales channels more quickly and with fewer mistakes." (Digital Asset Management)

"Product information management (PIM) is the process of managing all the information required to market and sell products through distribution channels." (Wikipedia) [source]

"Product information management (PIM) is the software-based orchestration of data dissemination related to a business’s products and its suppliers’ products. PIM coordinates changing product information across all channels of communication, thus ensuring that a business’s entire ecosystem has consistent and up-to-date information." (Informatica)

"The processes and tools for managing product information, including: 1) data centralization and governance; 2) data onboarding from partners; 3) data and content creation and enrichment; and 4) content distribution/syndication." (Forrester)

12 May 2019

#️⃣Software Engineering: Programming (Part XIII: Misconceptions about Programming II)

Software Engineering

Continuation

One of the organizational stereotypes is having a big room full of cubicles filled with employees. Even if programmers can work in such settings, improperly designed environments restrict to a certain degree the creativity and productivity, making more difficult employees' collaboration and socialization. Despite having dedicated meeting rooms, an important part of the communication occurs ad-hoc. In open spaces each transient interruption can easily lead inadvertently to loss of concentration, which leads to wasted time, as one needs retaking thoughts’ thread and reviewing the last written code, and occasionally to bugs.

Programming is expected to be a 9 to 5 job with the effective working time of 8 hours. Subtracting the interruptions, the pauses one needs to take, the effective working time decreases to about 6 hours. In other words, to reach 8 hours of effective productivity one needs to work about 10 hours or so. Therefore, unless adequately planned, each project starts with a 20% of overtime. Moreover, even if a task is planned to take 8 hours, given the need of information the allocated time is split over multiple days. The higher the need for further clarifications the higher the chances for effort to expand. In extremis, the effort can double itself.

Spending extensive time in front of the computer can have adverse effects on programmers’ physical and psychical health. Same effect has the time pressure and some of the negative behavior that occurs in working environments. Also, the communication skills can suffer when they are not properly addressed. Unfortunately, few organizations give importance to these aspects, few offer a work free time balance, even if a programmer’s job best fits and requires such approach. What’s even more unfortunate is when organizations ignore the overtime, taking it as part of job’s description. It’s also one of the main reasons why programmers leave, why competent workforce is lost. In the end everyone’s replaceable, however what’s the price one must pay for it?

Trainings are offered typically within running projects as they can be easily billed. Besides the fact that this behavior takes time unnecessarily from a project’s schedule, it can easily make trainings ineffective when the programmers can’t immediately use the new knowledge. Moreover, considering resources that come and go, the unwillingness to invest in programmers can have incalculable effects on an organization performance, respectively on their personal development.

Organizations typically look for self-motivated resources, this request often encompassing organization’s whole motivational strategy. Long projects feel like a marathon in which is difficult to sustain the same rhythm for the whole duration of the project. Managers and team leaders need to work on programmers’ motivation if they need sustained performance. They must act as mentors and leaders altogether, not only to control tasks’ status and rave and storm each time deviations occur. It’s easy to complain about the status quo without doing anything to address the existing issues (challenges).

Especially in dysfunctional teams, programmers believe that management can’t contribute much to project’s technical aspects, while management sees little or no benefit in making developers integrant part of project's decisional process. Moreover, the lack of transparence and communication lead to a wide range of frictions between the various parties.

Probably the most difficult to understand is people’s stubbornness in expecting different behavior by following the same methods and of ignoring the common sense. It’s bewildering the easiness with which people ignore technological and Project Management principles and best practices. It resides in human nature the stubbornness of learning on the hard way despite the warnings of the experienced, however, despite the negative effects there’s often minimal learning in the process...

To be eventually continued…


06 May 2019

🧭Business Intelligence: Key Performance Indicators [KPI] (Part I: An Introduction)

Business Intelligence

Key Performance Indicators (KPIs) are quantifiable measurements (aka metrics) that reflect the critical success factor of an organization in respect to their strategic goals and objectives. They allow measuring the progress toward reaching the defined goals and, to some degree, forecasting the further  evolution. They help keeping the focus on the goals, increases awareness in what concerns the goals and provide visibility into the business.

As they reflect an organization’s objectives, KPIs need to be anchored and aligned with them. If there’s no association with an objective then one doesn’t deal with a KPI but with other form of performance metric. Therefore KPIs need to change with the objectives, they are not fix.

One important requirement for a KPI is to be defined using SMART (specific, measurable, attainable, relevant, time-bound) criteria. Thus a KPI needs to be clear and unambiguous (specific), needs to measure the progress against a goal (measurable), needs to be realistic (attainable), needs to be relevant for the business and its current strategy (relevant), and needs to specify when the result(s) can be achieved (time-bound). To the SMART criteria some consider also the requirement for a KPI to be periodically and consistently evaluated and reviewed (trackable) and agreed between the parties afected by it (agreed).

A KPI needs to be visible within an organization, understandable and non-redundant. Even if KPIs are a tool for the upper management, their definition and impact needs to be visible and understood by all the people working with it, even if this can lead to unexpected behavior. The requirement for non-redundancy implies a partition of the KPIs to limit the cases in which two or more KPIs provide the same information.

A KPI needs to be supported by actions and needs to trigger actions. It’s nice to have KPIs reported periodically to the upper management, though as long no action is triggered, there’s no value in it. A KPI is kind of reinforcement for questions like: “why are we doing good/bad?”. The negative variations must trigger some form of action, however also the positive variation could involve further analysis to understand what caused the improvement.

The variation of a KPI needs to be supported by facts – each variation needs to be explainable in one form or another. A number without a story remains a number that can or not be trusted. Therefore, it might be needed to have further metrics or reports that support the KPIs, that can be used to identify the sources for variation, in order to understand the data.

Last but not the least KPIs need to be documented. The documentation needs to include at minimum a rough definition that includes the rationale, the boundary as well the critical values, metric’s owners, unit of measure, etc. In addition, one can add historical information about the KPI in respect to when and what caused variations, respectively how the variations were brought under control.

KPIs vary from an organization to another, the variation in not only influenced by the different goals organizations might have, but also based on the fact that organizations tend to measure different things, often the wrong things. It’s in general recommended to have a small number of KPIs that reflect in one dasboard how the business is doing and what is important for the business.

KPIs provide a basis for change by providing insights into what needs to change to improve some aspects of the business. When adequately defined and measured, KPIs provide a good perspective over an organization’s effort in achieving its goals and objectives, and therefore a good tool for monitoring and stirring organization’s strategy.

05 May 2019

𖣯Strategic Management: Strategy Definition (Part I: The Reason behind a Strategy)

Strategic Management

Many of the efforts that go on in organizations are just castles built into the thin air, and even if some of the architectures are wonderful, without a foundation they tend to crash under their own weight. For example, the investment in a modern BI solution, in an ERP or CRM system, seldom meets an organization’s expectations, and what’s even more unfortunate is that the potential introduced by the investments is only to a small degree harnessed, while the same old problems continue to exist, typically in new contexts.

An architect more likely would ask himself: What would be that foundation needed to support a castle or the whole settlement the castle belongs to? From what needs to be made? How should it be structured? How often needs to be reconsolidated and when? Who will participate in its building and its maintenance? What it still needed to make the infrastructure self-reliant? What other architects do? What’s best practice in the field? Many questions for which the architect needs to find optimal answers.

The strength of an edifice lies in its foundation. Its main purpose is to provide a solid, durable, self-reliant and maintainable structure on which the edifice can be anchored, that can support the current and future load of the edifice, and that keeps the edifice standing in face of calamities. It must therefore address the core challenges faced by the edifice during its lifetime. When one has a group of edifices holding together as a settlement, there’s needed a foundation to support the whole settlement and not only one edifice. Moreover, the foundation needs to be customized to address environment’s characteristics and owners’ plans for further development.

The foundation on which modern organizations build their edifice is a strategy rooted in organizations’ reason of existence (the mission), wishes of becoming (the vision), beliefs (the core values) and fundamental truths (the principles). A strategy, a term borrowed from military, is a set of coordinated and sustainable actions following a set of well-defined goals, actions devised into a plan and designed to create value and overcome an organization’s challenges. Through its character a strategy is the perfect tool for addressing holistically the problems, opportunities, strengths and weaknesses existing in an organization, of aligning the objectives toward the same goals, of providing transparency and common understanding into the status quo and the road ahead.

Having defined a strategy will not make things happen by themselves, one needs also the capabilities of executing the strategy as a whole, one needs clear roles with responsibilities and proper authority. In addition, the strategy needs to be adapted in time to serve its purpose. This might mean changing the level of detail, changing the strategy when opportunities or threats were identified, when goals become obsolete. To make this possible is needed to define several processes to support the strategy through its whole lifecycle and a set of metrics to make the progress visible.

There are organizations that make it without having a written strategy, some go with the inertia provided by the adoption of tools, with the experience of individual workers that through their cooperation provide the improvement needed. In a higher or lower degree there’s a strategy fragmented in each individual or group, however the strategies don’t necessarily converge. The problem with such approaches is that the results are often suboptimal, especially because they are fragmented efforts, more likely with different contradictory goals.

As any other tool a strategy has a potential power that when adequately harnessed can help organizations achieve their (strategic) goals, though it depends on each organization to harness that potential.

04 May 2019

#️⃣Software Engineering: Programming (Part X: Programming as Art)

Software Engineering
Software Engineering Series

Maybe seeing programming as an art is an idealistic thought, while attempting to describe programming as an art may seem an ingrate task. However, one can talk about the art of programming same way one can talk about the art of applying a craft. It’s a reflection of the mastery reached and what it takes to master something. Some call it art, others mastery, in the end it’s the drive that makes one surpass his own condition.

Besides an audience's experience with a creative skill, art means the study, process and product of a creative skill. Learning the art of programming, means primarily learning its vocabulary and its grammar, the language, then one has to learn the rules, how and when to break them, and in the end how to transcend the rules to create new languages. The poet uses metaphors and rhythm to describe the world he sees, the programmer uses abstractedness and patterns for the same. Programming is the art of using patterns to create new patterns, much like the poet does.

The drive of art is creativity independently if one talks about music, painting, poetry, mathematics or any other science. Programmer's creativity is reflected in the way he uses his tools and builds new ones. Despite the limits imposed by the programming languages he uses, the programmer can borrow anytime the knowledge of other sciences – mathematics, physics or biology – to describe the universe and make it understandable for machines. In fact, when we understand well enough something to explain to a computer we call it science [1].

Programming is both a science and an art. Paraphrasing Leonard Tippett [2], programming is a science in that its methods are basically systematic and have general application; and an art in that their successful application depends to a considerable degree on the skill and special experience of the programmer, and on his knowledge of the field of application. The programmer seems to borrow from an engineer’s natural curiosity, attention to detail, thirst for knowledge and continual improvement though these are already in programmer’s DNA.

In programming aesthetics is judged by the elegance with which one solves a problem and transcribes its implementation. The programmer is in a continuous quest with simplicity, reusability, abstractedness, elegance, time and complexity. Beauty resides in the simplicity of the code, the easiness with which complexity is reduced to computability, the way everything fit together in a whole. Through reusability and abstractedness the whole becomes more than the sum of its parts.

Programming takes its rigor and logic from mathematics. Even if the programmer is not a mathematician, he borrows from a mathematician’s way of seeing the world in structures, patterns, order, models (approximations), connectedness, networks, the designs converging to create new paradigms. Programmer's imagery conjures some part from a mathematician's art.

In extremis, through the structures and thought patterns, the programmer is in a continuous search for meanings, of creating a meaning to encompass other meanings, meanings which will hopefully converge to a greater good. It resembles the art of the philosopher, without the historical luggage.

Between the patterns of the mathematician and philosopher's search for truth, between poets artistry of manipulating the language to create new views and engineer’s cold search for formalism and methodic, programming is a way to understand the world and create new worlds. The programmer becomes the creator of glimpses of universes which, when put together like the pieces of a puzzle can create a new reality, not necessarily better, but a reality that reflects programmers’ art. For the one who learned to master a programming language nothing is impossible.


Quotations used:
(1)“Learning the art of programming, like most other disciplines, consists of first learning the rules and then learning when to break them.” (Joshua Bloch, “Effective Java”, 2001)
(2)“[Statistics] is both a science and an art. It is a science in that its methods are basically systematic and have general application; and an art in that their successful application depends to a considerable degree on the skill and special experience of the statistician, and on his knowledge of the field of application, e.g. economics.” (Leonard Tippett, “Statistics”, 1943)
Related Posts Plugin for WordPress, Blogger...

About Me

My photo
Koeln, NRW, Germany
IT Professional with more than 24 years experience in IT in the area of full life-cycle of Web/Desktop/Database Applications Development, Software Engineering, Consultancy, Data Management, Data Quality, Data Migrations, Reporting, ERP implementations & support, Team/Project/IT Management, etc.