Showing posts with label Test Drive. Show all posts

19 April 2024

Power BI: Working with Visual Calculations (Part I: Test Drive) [new feature]

Introduction

I recently watched a webcast with Jeroen (Jay) ter Heerdt (see [2]) in which he introduces visual calculations, a type of DAX calculation that's defined and executed directly on a visual [1]. Visual calculations provide an approach of treating a set of data much like an Excel table, allowing to refer to any field available on a visual and write formulas, which simplifies considerably the solutions used currently for ranking records, running averages and other windowing functions. 

The records behind a visual can be mentally represented as a matrix, while the visual calculations can refer to any column from the matrix, allowing to add new columns and include the respective columns in further calculations. Moreover, if a column is used in a formula, it's not recalculated as is the case of measures, which should improve the performance of DAX formulas considerably. 

Currently, one can copy a formula between visuals and if the formula contains fields not available in the targeted visual, they are added as well. Conversely, it's possible to build such a visual, copy it and then replace the dimension on which the analysis is made (e.g. Customer with Product), without being needed to make further changes. Unfortunately, there are also downsides: (1) the calculations are visible only within the visual in which were defined; (2) currently, the visual's data can't be exported if a visual calculation is added; (3) no formatting is supported, etc.

Ranking and Differences

I started to build a solution based on publicly available sales data, which offers a good basis for testing the use of visual calculations. Based on a Power BI visual table made of [Customer Name], [Sales Amount], [Revenue] and [Total Discount], I've added several calculations:

-- percentages
Sales % = 100*DIVIDE([Sales Amount], COLLAPSE([Sales Amount], ROWS))
Revenue % = 100*DIVIDE([Revenue],[Sales Amount])
Discount % = 100*DIVIDE([Total  Discount], [Total  Discount]+[Sales Amount])

-- rankings 
Rank Sales = Rank(DENSE, ORDERBY([Sales Amount], DESC))
Rank Revenue = Rank(DENSE, ORDERBY([Revenue], DESC))

-- differences between consecutive values
Diff. to Prev. Sales = IF([Rank Sales]>1, INDEX([Rank Sales]-1, , ORDERBY([Sales Amount], DESC)) - [Sales Amount] , BLANK())
Diff. to Prev. Rev. = IF([Rank Revenue]>1, INDEX([Rank Revenue]-1, , ORDERBY([Revenue], DESC)) - [Revenue] , BLANK())

Here's the output considered only for the first 10 records sorted by [Sales Amount]:

Customer Name Sales Amount Sales % Revenue Revenue % Total Discount Discount % Rank Sales Diff. to Prev. Sales. Rank Rev. Diff. to Prev. Rev.
Medline 1058923.78 3.76 307761.99 3.75 126601.02 10.68 1 1
Ei 707663.21 2.51 229866.98 2.8 95124.09 11.85 2 351260.57 2 77895.01
Elorac, Corp 702911.91 2.49 209078.76 2.55 83192.39 10.58 3 4751.3 6 20788.22
Sundial 694918.98 2.47 213362.1 2.6 78401.72 10.14 4 7992.93 4 -4283.34
OUR Ltd 691687.4 2.45 196396.26 2.4 78732.2 10.22 5 3231.58 10 16965.84
Eminence Corp 681612.78 2.42 213002.78 2.6 86904.03 11.31 6 10074.62 5 -16606.52
Apotheca, Ltd 667283.99 2.37 157435.56 1.92 101453.91 13.2 7 14328.79 31 55567.22
Rochester Ltd 662943.9 2.35 224918.2 2.74 81158.11 10.91 8 4340.09 3 -67482.64
ETUDE Ltd 658370.48 2.34 205432.79 2.51 89322.72 11.95 9 4573.42 9 19485.41
Llorens Ltd 646779.31 2.29 206567.4 2.52 82897.59 11.36 10 11591.17 8 -1134.61

Comments:
1) One could use [Total Amount] = [Total  Discount]+[Sales Amount] as a separate column.
2) The [Rank Sales] is different from the [Rank Rev.] because of the discount applied.
3) In the last two formulas a blank was considered for the first item from the ranking.
4) It's not possible to control when the totals should be displayed, however one can change the color for the not needed total to match the background.

Visualizing Differences 

Once the formulas are added, one can hide the basis columns and visualize the data as needed. To obtain the below chart I copied the visual and changed the column as follows:

Diff. to Prev. Rev. = IF([Rank Revenue]>1, [Revenue]- INDEX([Rank Revenue]-1, , ORDERBY([Revenue], DESC)) , [Revenue]) -- modified column
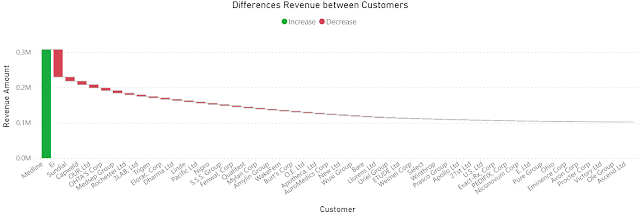
Differences Revenue between Customers

Comments:
1) Instead of showing the full revenue, the chart shows only the differences from the highest revenue, where the column in green is the highest revenue, while the columns in red are the differences of the current customer's revenue to the previous customer, as the data are sorted by the highest revenue. At least in this case it results in a lower data-ink ratio (see Tufte).
2) The values are sorted by the [Revenue] descending. 
3) Unfortunately, it's not possible to change the names from the legend.

Simple Moving Averages (SMAs)

Based on the [Sales Amount], [Revenue] and [Month] one can add the following DAX formulas to the table for calculating the SMA:

Sales Amount (SMA) = MOVINGAVERAGE([Sales Amount],6)
Revenue (SMA) = MOVINGAVERAGE([Revenue],6)

The chart becomes:


Comments:
1) Unfortunately, the formula can't project the values into the feature, at least not without the proper dates.
2) "Show items with not data" feature seems to be disabled when visual calculations are used.
3) The SMA was created via a template formula. Similarly, calculating a running sum is reduced to applying a formula:
Running Sales Amount = RUNNINGSUM([Sales Amount])

Wrap Up

It's easier to start with a table for the visual, construct the needed formulas and then use the proper visual while eliminating the not needed fields. 

The feature is still in public preview and changes can still occur. Unfortunately, there's still no information available on the general availability date. From the first tests, it provides considerable power with a minimum of effort, which is great! I don't want to think how long I would have needed to obtain the same results without it!

Happy coding!

Previous Post <<||>> Next Post

References
[1] Microsoft Learn (2024) Power BI: Using visual calculations [preview] (link)
[2] SSBI Central (2024) Visual Calculations - Making DAX easier, with Jeroen ter Heerdt (link)

14 October 2023

Azure Tools & Services: The Azure Diagrams Architecture Advisor (Test Drive)

There seems to be a new tool available for the Azure community, even if the tool doesn't belong yet to the Microsoft technology stack. I'm talking about Azure Diagrams Architecture Advisor, which enables users to "design diagrams in a collaborative manner and provides guidance on which services can be integrated and when they should be utilized in your architecture". 

I took the tool for a test drive, trying to adapt an architecture I used recently for a Synapse Data Lakehouse. I used the Data Warehouse using Synapse Analytics example as source of inspiration. (You can use the links to check the latest versions.) 

Overall, it was a good experience, the functionality being straightforward to use. I needed some time to identify what resources are available, and there are a few. Even if some of the resources were missing (e.g. Dataverse and Dynamics 365 services), I could use a custom resource to fill the gap. 

One can easily drag and drop resources (see the left panel) on the canvas and create links between them. The diagram can be saved only as soon as you give it a name and sign in for an account, the email and a password are all you need for that. The diagram can be kept hidden or made available for the whole community, respectively can be saved locally as PNG or SVG files.

Azure Diagrams
Serverless Data Lakehouse

Each standard (non-custom) resource has a link to documentation, respectively to the pricing. The arrows between resources show whether the integration is supported by default. One can create bidirectional arrows by creating a second arrow from destination to source. 

The functionality is pretty basic, though I was able to generate the diagram I wanted, and I'm satisfied with the result. Unfortunately, I couldn't modify directly the example I used for inspiration. It would be great if further functionality like the one available in Visio Online could be made available (e.g. automatic alignment, copy pasting whole diagrams or parts of them, making each value editable, grouping several resources together, adding more graphical content, etc.). 

The resources and icons available focus on the Microsoft Azure technology stack. It would be great if one could import at least new icons, though ideally further resources from other important software vendors should be supported (e.g. AWS, Oracle, Adobe, etc.).

The possibility to define further links (e.g. to the actual environments) or properties (e.g. environment names), respectively to change the views for the whole diagram could enhance the usability of such diagrams. 

Microsoft should think seriously about including this tool in their stack, if not in Visio Online at least as standalone product!

Besides the examples and the shared diagrams available you can browse also through the collection of Azure Architectures.

To summarize, here are the improvements suggested:
- save and modify directly the examples;
- automatic alignment of resources within the canvas;
- copy pasting whole diagrams or parts of them;
- make each value editable;
- group several resources together (e.g. in a layer);
- adding more graphical content;
- import new icons;
- support resources from other important software vendors (e.g. AWS, Oracle, Adobe, etc.);
- define further links (e.g. to the actual environments);
- define further properties (e.g. environment names);
- change the views for the whole diagram;
- integration into Visio Online.

27 February 2021

Python: PySpark and GraphFrames (Test Drive)

Besides the challenges met during configuring the PySpark & GraphFrames environment, also running my first example in Spyder IDE proved to be a bit more challenging than expected. Starting from an example provided by the DataBricks documentation on GraphFrames, I had to add 3 more lines to establish the connection of the Spark cluster, respectively to deactivate the context (only one SparkContext can be active per Java VM).

The following code displays the vertices and edges, respectively the in and out degrees for a basic graph. 

from graphframes import *
from pyspark.context import SparkContext
from pyspark.sql.session import SparkSession

#establishing a connection to the Spark cluster (code added)
sc = SparkContext('local').getOrCreate()
spark = SparkSession(sc)

# Create a Vertex DataFrame with unique ID column "id"
v = spark.createDataFrame([
  ("a", "Alice", 34),
  ("b", "Bob", 36),
  ("c", "Charlie", 30),
  ("d", "David", 29),
  ("e", "Esther", 32),
  ("f", "Fanny", 36),
  ("g", "Gabby", 60)
], ["id", "name", "age"])
# Create an Edge DataFrame with "src" and "dst" columns
e = spark.createDataFrame([
  ("a", "b", "friend"),
  ("b", "c", "follow"),
  ("c", "b", "follow"),
  ("f", "c", "follow"),
  ("e", "f", "follow"),
  ("e", "d", "friend"),
  ("d", "a", "friend"),
  ("a", "e", "friend")
], ["src", "dst", "relationship"])

# Create a GraphFrame
g = GraphFrame(v, e)

g.vertices.show()
g.edges.show()

g.inDegrees.show()
g.outDegrees.show()

#stopping the active context (code added)
sc.stop()

Output:
id nameage
a Alice34
b Bob36
cCharlie30
d David29
e Esther32
f Fanny36
g Gabby60
srcdstrelationship
a b friend
b c follow
c b follow
f c follow
e f follow
e d friend
d a friend
a e friend
idinDegree
f1
e1
d1
c2
b2
a1
idoutDegree
f1
e2
d1
c1
b1
a2

Notes:
Without the last line, running a second time the code will halt with the following error: 
ValueError: Cannot run multiple SparkContexts at once; existing SparkContext(app=pyspark-shell, master=local) created by __init__ at D:\Work\Python\untitled0.py:4

Loading the same data from a csv file involves a small overhead as the schema needs to be defined explicitly. The same output from above should be provided by the following code:

from graphframes import *
from pyspark.context import SparkContext
from pyspark.sql.session import SparkSession
from pyspark.sql.types import * 

#establishing a connection to the Spark cluster (code added)
sc = SparkContext('local').getOrCreate()
spark = SparkSession(sc)

nodes = [
    StructField("id", StringType(), True),
    StructField("name", StringType(), True),
    StructField("age", IntegerType(), True)
]
edges = [
    StructField("src", StringType(), True),
    StructField("dst", StringType(), True),
    StructField("relationship", StringType(), True)
    ]

v = spark.read.csv(r"D:\data\nodes.csv", header=True, schema=StructType(nodes))

e = spark.read.csv(r"D:\data\edges.csv", header=True, schema=StructType(edges))

# Create a GraphFrame
g = GraphFrame(v, e)

g.vertices.show()
g.edges.show()

g.inDegrees.show()
g.outDegrees.show()

#stopping the active context (code added)
sc.stop()

The 'nodes.csv' file has the following content:
id,name,age
"a","Alice",34
"b","Bob",36
"c","Charlie",30
"d","David",29
"e","Esther",32
"f","Fanny",36
"g","Gabby",60

The 'edges.csv' file has the following content:
src,dst,relationship
"a","b","friend"
"b","c","follow"
"c","b","follow"
"f","c","follow"
"e","f","follow"
"e","d","friend"
"d","a","friend"
"a","e","friend"

Note:
There should be no spaces between values (e.g. "a", "b"), otherwise the results might deviate from expectations. 

Now, one can go and test further operations on the graph thus created:

#filtering edges 
gl = g.edges.filter("relationship = 'follow'").sort("src")
gl.show()
print("number edges: ", gl.count())

#filtering vertices
#gl = g.vertices.filter("age >= 30 and age<40").sort("id")
#gl.show()
#print("number vertices: ", gl.count())

# relationships involving edges and vertices
#motifs = g.find("(a)-[e]->(b); (b)-[e2]->(a)")
#motifs.show()

Happy coding!

01 February 2021

Data Migrations (DM): Quality Acceptance Criteria IV

Data Migration
Data Migrations Series

Reliability

Reliability is the degree to which a solution performs its intended functions under stated conditions without failure. In other words, a DM is reliable if it performs what was intended by design. The data should be migrated only when migration’s reliability was confirmed by the users as part of the sign-off process. The dry-runs as well the final iteration for the UAT have the objective of confirming solution’s reliability.

Reversibility

Reversibility is the degree to which a solution can return to a previous state without starting the process from the beginning. For example, it should be possible to reverse the changes made to a table by returning to the previous state. This can involve having a copy of the data stored respectively deleting and reloading the data when necessary. 

Considering that the sequence in which the various activities is fix, in theory it’s possible to address reversibility by design, e.g. by allowing to repeat individual steps or by creating rollback points. Rollback points are especially important when loading the data into the target system. 

Robustness

Robustness is the degree to which the solution can accommodate invalid input or environmental conditions that might affect data’s processing or other requirements (e,g. performance). If the logic can be stabilized over the various iterations, the variance in data quality can have an important impact on a solutions robustness. One can accommodate erroneous input by relaxing schema’s rules and adding further quality checks.

Security 

Security is the degree to which the DM solution protects the data so that only authorized people have access to the respective data to the defined level of authorization as data are moved through the solution. The security provided by a solution needs to be considered against the standards and further requirements defined within the organization. In case no such standards are available, one can in theory consider the industry best practices.

Scalability

Scalability is the degree to which the solution is able to respond to an increased workload.  Given that the number of data considered during the various iterations vary in volume, a solution’s scalability needs to be considered in respect to the volume of data to be migrated.  

Standardization

Standardization is the degree to which technical standards were implemented for a solution to guarantee certain level of performance or other aspects considered as import. There can be standards for data storage, processing, access, transportation, or other aspects associated with the migration processes. Moreover, especially when multiple DMs are in scope, organizations can define a set of standards and guidelines that should be further considered.  

Testability

Testability is the degree to which a solution can be tested in the respect to the set of functional and data-related requirements. Even if for the success of a migration are important the data in their final form, to achieve that is needed to validate the logic and test thoroughly the transformations performed on the data. As the data go trough the data pipelines, they need to be tested in the critical points – points where the data suffer important transformations. Moreover, one can consider record counters for the records processed in each such critical point, to assure that no record was lost in the process.  

Traceability

Traceability is the degree to which the changes performed on the data can be traced from the target to the source systems as record, respectively at entity level. In theory, it’s enough to document the changes at attribute level, though upon case it might needed to document also the changes performed on individual values. 

Mappings at attribute level allow tracing the data flow, while mappings at value level allow tracing the changes occurrent within values. 

27 January 2010

Business Intelligence: Cognos & SQL Server 2008 - The First Report (Test Drive)

Yesterday evening I installed on my computer the IBM Cognos Express (V9) software, the newest Cognos version, available with a trial period of 30 days. The first attempt to install it was not errorless though as I had to observe several attempts later when I got the same error, the error was not fatal. So, once the instalation complete, the Express Manager started, finding out that I have to install manually the Manager, Advisor, Reporter and Xcelerator - quite easy to do.

Now I was ready to test the tool and create several reports, for this needing to create first a data source - a connection to an existing database with several tables on which the reports will be based. SQL Server 2008's AdventureWorks database seemed to be adequate for this test, in plus I know there are many SQL Server professionals already using it for testing or tutorials.

Step 1: Creating the SQL Server account

Reporting tools need in general only read access to data sources and as a good practice to enforce security and address the special requirements the reports are coming with, so it makes sense to create a new User for this. Open Microsoft SQL Server Management Studio and from the root navigate to Security/New/Login…, this action brining Login – New window in which must be filled

a. the Login name (e.g. cognosuser)
b. the authentification – because Cognos doesn’t supports Windows-based authentication, choose SQL Server authentication, enter the Password and confirm it. By default the ‘Enforce password expiration’ is checked, though this option is not needed for the current requirement so unchek it.
c. Select the Default database, the database you’re intending to base your reports on (e.g. AdventureWorks)
d. Select the ‘Default Language’ (e.g. English)
Navigate to ‘Use Mapping’ tab and in ‘User mapped to this login’ choose the databases you would like to give access (e.g. AdventureWorks) and for each database selected you’ll have to select the schemas in scope (e.g. HumanResources, Person, Production, Purchasing and Sales), while in’Database role membership for’ select the db_datareader database level role name, then you can click ‘Ok’.
 
It’s always a good idea to test the new account before attempting to use it from an external application, this allows catching the eventual issues early in the process, saving your and others’ time!

Step 2: Creating a Data Source

Start the IBM Cognos Express Manager and from Data click on ‘Add…’ button, action that will bring the ‘Enter Data Source Information’ in which you’ll have to select the ‘Data Source Type’, in this case Microsoft SQL Server (SQL 2005 Native Client), fill the ‘Name’ (e.g. AdventureWorks), ‘Server Name’ (here comes your SQL Server name), ‘Database Name’ (e.g. AdventureWorks ), ‘User ID’ (e.g. cognosuser) and password (e.g. something you must guess). As can be seen from the below image, there is also a Databae Object control, which will be populated once you entered the before mentioned information and clicked on ‘Retrieve Database Objects’ button. Select one of the database objects (e.g. AdventureWorks ) and click ‘Ok’, Cognos creating the Data (Source) in the background.
 
Step 3: Creating a Report

Instead of using Report Studio, the standard tool for designing reports, for simple reports or queries could be used instead the Query Studio, an easy-to-use authoring tool, the creation of a report resuming to a simple drag and drop. For this you’ll have to open the Query Studio from the Launch item found on the top menu, this action opening a new browser window, in a next step following to select the package (actually the data source) you want to use. In ‘Insert Data’ mode select a table from the list (e.g. Location) and drag and drop it into the right section, all table’s columns being shown together with a sample set of data.

You could double click on each column and give it a meaningful name – is a good practice to separate the words with spaces though not really necessarily. By clicking on report’s Title you could change its actual value and add a Subtitle if necessary. In ‘Change Layout’ you could change report’s layout by applying different Font, Border and Conditional Styles, much like in Excel, show row numbers by clicking the ‘Show row numbers’ from Change Layout/Set Web Page Size, etc. Save the report once you’ve done the changes, the report will look something like the one from the below image:
Step 4: Running the Report

From ‘Run Report’ Menu item you could choose to run the report mainly in three modes – ‘Run with All Data’, ‘Preview with Limited Data’ or ‘Preview with No Data’. Additionally you can export the report to PDF (Portable Document Format), several versions of Excel (2000, 2002 and 2007), CSV (Comma Separated Values) and XML (eXtensible Markup Language).

Happy coding!
Related Posts Plugin for WordPress, Blogger...

About Me

My photo
IT Professional with more than 24 years experience in IT in the area of full life-cycle of Web/Desktop/Database Applications Development, Software Engineering, Consultancy, Data Management, Data Quality, Data Migrations, Reporting, ERP implementations & support, Team/Project/IT Management, etc.