Showing posts with label SSRS. Show all posts

07 March 2024

📦Data Migrations (DM): The SQL Server Perspective (Licensing Costs and Edition Choices)

Data Migration
Data Migration Series

A Data Migration (DM) moves all or a subset of the data available from one or more system(s) into other system(s). For this purpose, especially in ERP Implementations, one can use a SQL Server as intermediate layer, where SSIS can be used for the data extraction and exporting, SSRS for reporting the errors, while the database engine for the heavy processing. Master Data and Data Quality Services can be used as well in certain scenarios. Therefore, SQL Server allows by design to address the various challenges related to a DM. At high level the architecture can be depicted as follows:
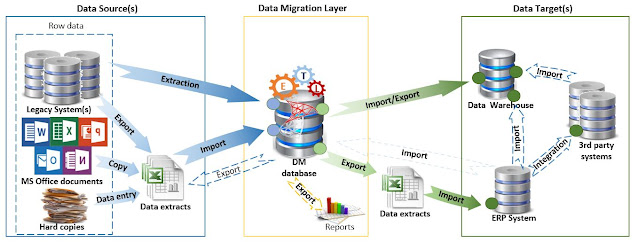
Data Migration Architecture

Once the decision to go with SQL Server for the DM layer is made, one needs to define which edition to use. If the DM doesn't have special requirements, one can use for it an available SQL Server instance, as long as the cumulated workloads don't create major issues. Therefore, in the past I used existing licensed versions of SQL Server to build solutions for DMs in ERP implementations, though I evaluated in each project whether it's possible to reduce the costs and remain compliant with the license requirements. 

Of course, there's always the alternative of using SQL Server Express which supports databases with a maximum of 10 GB, which should be enough for most of DMs, though it has also further limitations (see [2]). There are also ways of moving around existing limitations, like splitting the logic across multiple databases. 

Then there's the SQL Server Developer edition, which involves no license costs, has the full SQL Server functionality available, and can be used to build and test applications. In a recent post [1], Bob Ward, principal architect at Microsoft made several clarifications on the licenses for the Developer edition, which is "licensed for development, test, and demonstration purposes only" and "may not be used in a production environment”. Bob Ward makes the following clarifications:
(1) "Production environments include any system that is accessed by end-users for anything more than acceptance testing, environments that connects to production systems (such as Linked servers), disaster recovery or backups of production systems, and environments that are 'rotated' into production at any point in time." [1]
(2) One "cannot use Developer edition to build test data and move that same data into production" [1].
(3) One can "restore a production set of data backup for testing purposes" [1].

There are two-three impediments for using the Developer edition completely for a DM. The first, at least during Go Live and UAT, one needs to work with data coming directly from the various production environments. Secondly, the data generated by the solution are used primarily for UAT and in a second step for Production, which seems to be against the rule (2), or at least it's a grey area (which might be overlooked by Microsoft). Thirdly, some data from the production environment might need to be imported back into the DM layer for validation or enhancing the entities with data generated in the target systems. 

In what concerns the first issue, the DM solution can always point to the test environments used as source, following that during UAT to copy the databases from production into the test environments. This might be anyway necessary for other purposes. Otherwise, the effort might be considerable and not working in the last phases with the data timeliness might raise other concerns. 

The second issue is a matter of interpretation. The UAT phase makes sure that the data generated by the DM solution respects the criteria for Go Live. If there are no issues, the same data can be used for Go-Live. If for this is required another licensed edition, then an environment can be built only for UAT and Go Live, project phases which usually span over a couple of weeks, unless multiple migrations need to be performed at different time intervals. If the environments are in the cloud, probably the instances can be turned on and off on a as-needed basis. 

One can plan for different environments between Production and Development and the environments can be on the same SQL Server as distinct databases, respectively use the Developer edition for Development, and use a different licensed edition for UAT and Production. This approach involves additional overhead in synchronizing the logic between environments. Conversely, in the case of the DM layer, the same environment can be used from beginning to the end, while the code should/must be backed-up periodically. For multiple migrations based on the same data, one should archive the data after each migration or important phase. 

For the scenarios in which after migration the data are copied back to the DM solution, it's enough to have these steps performed against the UAT target system(s). This should work as long there are no differences in configuration between UAT and Production. There are however exceptions, e.g. data generated by the target systems, for which the values between Prod and UAT are different. At least in Dynamics 365 one can attempt to generate the values in the DM layer and import them as they are into the target system. It worked for many scenarios, though there can be exceptions here as well. 

A more complex scenario is when data from the DM layer needs to be exported to Data Warehouses or similar solutions that can be considered as Production systems. Here a licensed edition seems to be mandatory. For other scenarios in which Master Data and/or Data Quality Services are needed, there's only the option to use the Enterprise or Developer editions.

To summarize, to reduce the overall costs for the DM, consider using an existing licensed SQL Server instance for building the solution. If separates environments need to be built, the Express edition might have some limitations though it can prove to be a viable solutions in many cases. Otherwise, consider the above workarounds for using the Developer edition, including the scenario in which distinct environments are used for Production and Development. 

Resources:
[1] Microsoft Data Platform (2024) How SQL developers can maximize savings, by Bob Ward (link)
[2] Microsoft Learn (2024) Editions and supported features of SQL Server 2022 (link)
[3] Microsoft Learn (2023) Master Data Services and Data Quality Services Features Support (link)

02 March 2024

🧭Business Intelligence: Microsoft Releases for the BI Technology Stack (Timeline)

Business Intelligence
Business Intelligence Series

I started some years back to put together a timeline for the most important events happening in the BI technology stack (work in progress):

2023: Microsoft announces Microsoft Fabric (>>)

  • Synapse Data Warehouse is the next generation of data warehousing in Microsoft Fabric with native support for the delta lake.
  • Data Engineering & Data Science workloads with support for lakehouses, notebooks, Spark Job definitions, models and experiments.
  • Real-Time Analytics is a robust platform tailored to deliver real-time data insights and observability analytics capabilities for a wide range of data types.
  • OneLake provides a single unified storage location for all your data analytics needs.

2022: Microsoft releases SQL Server 2022 (>>)

  • Synapse Link for SQL Server 2022 allows to seamlessly replicate operational data in near real-time to be able to have more powerful analytics.
  • Purview is a unified data governance and management service.

2019: Microsoft launches Azure Synapse Analytics service (formerly SQL Data Warehouse), a limitless analytics service, that brings together enterprise data warehousing and Big Data analytics. (>>)

2019: Microsoft releases SQL Server 2019 (>>)

  •  Big Data Clusters add-in for SQL Server allows to deploy scalable clusters of SQL Server, Spark, and HDFS containers running on Kubernetes (feature to be retired)

2018: Microsoft extends PowerQuery with ETL capabilities. (>>)

2018: Microsoft releases Azure Data Studio, a data management tool that enables to work with SQL Server, Azure SQL DB and SQL DW from Windows, macOS and Linux. (>>)

2017: Microsoft releases Power BI Report Server, an on-premises server that enables Power BI Pro users to publish Power BI reports and distribute them broadly across the enterprise, without requiring report consumers to be licensed individually per use (>>)

2017: Microsoft released SQL Server Data Tools (SSDT), which uses PowerQuery to import and prepare data in SSAS/AAS tabular models.

2017: Microsoft releases SQL Server 2017. (>>)

  • SSRS is no longer available to install through SQL Server setup.
  • Python support added, R Services renamed to Machine Learning Services. (>>)

2016: Microsoft releases SQL Server 2016 (What's new, >>)

  • Query Store allows to monitor and troubleshoot performance issues.
  • SQL Server R Services integrate the R programming language into SQL Server.
  • Direct Query for SSAS.
  • PolyBase for querying the data stored in HDFS. (>>)
  • Support for Support for HDFS in SSIS.
  • Azure SQL Data Warehouse is GA. (>>)
  • modern reports with SSRS. (>>)
  • Real-Time Operational Analytics. (>>)
2016: SQL Server 2014 Developer Edition becomes free. (>>)

2015: Microsoft announces elastic databases SQL Data Warehouse & Azure Data Lake. (>>)

  • Elastic databases allows to build SaaS applications to manage large numbers of databases that have unpredictable resource demand.
  •  Azure SQL Data Warehouse is an elastic data warehouse in the cloud that can dynamically grow, shrink and pause compute in seconds independent of storage.
  • Azure Data Lake is a hyper-scale data store for big data analytic workloads.

2015: Microsoft releases Power BI to the general public.

  • Power BI Designer renamed to Power BI Desktop.
2015: Microsoft releases several Azure services:
  • launches the SQL Server Cloud database.
  • Azure Data Factory (ADF), a fully managed service that does information production by orchestrating data with processing services as managed data pipelines. (>>)
  • Azure Stream Analytics, a fully managed stream processing engine that is designed to analyze and process large volumes of streaming data with sub-millisecond latencies. (>>)

2014: Microsoft released Power BI Designer unifying Power Query, Power Pivot & Power View.

2013: Microsoft announces Power BI for Office 365. (>>)

2012: Microsoft releases with SQL Server 2012. (>>)

  • BI Semantic Model for SSAS provides a single, scalable model for BI applications.
  • Parallel Data Warehouse with PolyBase capabilities. 
  • in-memory capabilities. (>>)
  • Windows Azure SQL Reporting service available (>>)
  • SQL Server Data Tools unifies SQL Server and cloud SQL Azure development for both professional database and application developers.

2010: Microsoft released 

  • Power Pivot as part of SQL Server R2.
  • Azure SQL Database.

2010: Microsoft releases SQL Server 2008 R2.

  • Master Data Services.
  • Power Pivot & Self-service BI capabilities in SSAS.

2008: Microsoft releases SQL Server 2008 (>>)

  • Table compression.
  • Change Data Capture (CDC).

2005: Microsoft releases SQL Server 2005

  • a greatly enhanced version of Analysis Services.
  • SQL Server Integration Services to replace DTS.

2004: Microsoft released SQL Server Reporting Services (SSRS) as add-on to SQL Server 2000.

2000: Microsoft released SQL Server Analysis Services (SSAS) with SQL Server 2000.

1998: Microsoft released SQL Server 7.

  • OLAP services & first MDX specifications.
  • Data Transformation Services (DTS) for ETL workloads.

12 February 2024

🧭Business Intelligence: A One-Man Show (Part I: Some Personal Background and a Big Thanks!)

Business Intelligence Series

Over the past 24 years, I found myself often in the position of a "one man show" doing almost everything in the data space from requirements gathering to development, testing, deployment, maintenance/support (including troubleshooting and optimization), and Project Management, respectively from operations to strategic management, when was the case. Of course, different tasks of varying complexity are involved! Developing a SSRS or Power BI report has a smaller complexity than developing in the process also all or parts of the Data Warehouse, or Lakehouse nowadays, respectively of building the whole infrastructure needed for reporting. All I can say is that "I've been there, I've done that!". 

Before SSRS became popular, I even built for a customer a whole reporting solution based on SQL Server, HTML & XML, respectively COM+ objects for database access. UI’s look-and-feel was like SSRS, though there was no wizardry involved besides the creative use of programming and optimization techniques. Once I wrote an SQL query, the volume of work needed to build a report was comparable to the one in SSRS. It was a great opportunity to use my skillset, working previously as a web developer and VB/VBA programmer. I worked for many years as a Software Engineer, applying the knowledge acquired in the field whenever it made sense to do so, working alone or in a team, as the projects required.

During this time, I was involved in other types of projects and activities that had less to do with the building of reports and warehouses. Besides of the development of various desktop, web, and data-processing solutions, I was also involved in 6-8 ERP implementations, being responsible for the migration of data, building the architectures needed in the process, supporting key users in various areas like Data Quality or Data Management. I also did Project Management, Application Management, Release and Change Management, and even IT Management. Thus, there were at times at least two components involved - one component was data-related, while the other component had more diversity. It was a good experience, because the second component often needed knowledge of the first, and vice versa. 

For example, arriving to understand the data model and business processes behind an ERP system by building ad-hoc and standardized reports, allowed me to get a good understanding of what data is needed for a Data Migration, which are the dependencies, or the level of quality needed. Similarly, the knowledge acquired by building ETL-based pipelines and data warehouses allowed me to design and build flexible Data Migration solutions, both architectures being quite similar from many perspectives. Knowledge of the data models and architectures involved can facilitate the overall process and is a premise for building reliable performant solutions. 

Similar examples can also be given in Data Management, Data Operations, Data Governance, during and post-implementation ERP support, etc. Reports and data are needed also in the Management areas - it starts from knowing what data are needed in the supporting processes for providing transparency, of getting insights and bringing the processes under control, if needed.

Working alone, being able to build a solution from the beginning to the end was often a job requirement. This doesn't imply that I was a "lone wolf". The nature of a data professional or software engineer’s job requires you to interact with various businesspeople from report requesters to key users, internal and external consultants, intermediary managers, and even upper management. There was also the knowledge of many data professionals involved indirectly – the resources I used to learn from - books, tutorials, blogs, webcasts, code, and training material. I'm thankful for their help over all these years!

Previous Post <<||>> Next Post

10 October 2023

🪄💫SSRS (& Paginated Reports): Products Master Report in Dynamics 365 for Finance & Operations via Base Tables

As mentioned in the previous post, building the Products Master paginated report via the base D365 FO tables synchronized in Data Lake involves more effort and implies duplicating the logic from the used data entity(-ies). One can attempt recreating the entities 1:1 as they are defined in the D365 database (an SQL Server Azure database), however there are high the chances that in certain areas (e.g. financial dimensions) the features used in building the logic are not supported. Moreover, it might be the case that only a subset of the functionality was implemented, and with this, pieces of logic becoming obsolete. 

There's also a limitation on the number of tables which can be synchronized, and therefore one needs to compromise. In the dbo.EcoResProductV2Entity there are about 20 tables involved, though probably only half of them are used. The base table dbo.EcoResProduct contains most of the fields available also in the data entity, though the names for the various attributes need to be retrieved from the various tables. 

Some of the issues met in working with data entities appear in this scenario as well: (2) there are fields based on Enums that store only the code and it's needed to map the corresponding values, (4) further transformations are needed (e.g., converting fields to formats). It makes sense to encapsulate similarly the logic in views, though this time one or two layers of logic are needed in addition. One can choose to do this for each table in scope, or replicate data entity's logic by focusing only on the needed parts. Both approaches will prove to be challenging in certain scenarios. Let's consider the latter:

CREATE OR ALTER VIEW TDM.vEcoResProductV2Entity
AS 
/*
name:  Products - Master (base view)
created: 01.04.2021
modified: 01.04.2021
*/
SELECT ITM.ProductType
, CASE ITM.ProductType
    WHEN 1 THEN 'Item'
	WHEN 2 THEN 'Service'
  END ProductTypeName
, CAST ((CASE WHEN ITM.InstanceRelationType = 13678 THEN 1 ELSE 2 END) AS INT) ProductSubtype
, CASE 
    WHEN ITM.InstanceRelationType = 13678 THEN 'Product'
	ELSE 'Product Master'
   END ProductSubtypeName
, ITM.DisplayProductNumber ProductNumber
, Replace(Replace(ILT.Name, char(10), ' '), char(13), ' ')  ProductName
, Replace(Replace(ILT.Description, char(10), ' '), char(13), ' ') ProductDescription
, PCA.CategoryName RetailProductCategoryName 
, PCA.CategoryCode RetailProductCategoryCode
, PDG.Name ProductDimensionGroupName 
, SDG.Name StorageDimensionGroupName 
, TDG.Name TrackingDimensionGroupName 
, ITM.RetailColorGroupId ProductColorGroupId 
, ITM.RetailSizeGroupId ProductSizeGroupId 
, ITM.RetailStyleGroupId ProductStyleGroupId
, ITM.VariantConfigurationTechnology
, CASE ITM.VariantConfigurationTechnology
	WHEN 0 THEN 'None'
	WHEN 1 THEN 'Predefined Variants'
    WHEN 2 THEN 'Dimension Based'
	WHEN 3 THEN 'RuleBased'
	WHEN 4 THEN 'Constraint Based'
  END VariantConfigurationTechnologyName
, CASE WHEN KIT.ProductMaster IS NOT NULL THEN 1 ELSE 0 END IsProductKit
, CASE WHEN KIT.ProductMaster IS NOT NULL  THEN 'Yes' ELSE 'No' END IsProductKitName
, ITM.PDSCWProduct IsCatchWeightproduct
, CASE ITM.PDSCWProduct WHEN 1 THEN 'Yes' ELSE 'No' END IsCatchWeightproductName
, ITM.IsProductVariantUnitConversionEnabled
, CASE ITM.IsProductVariantUnitConversionEnabled WHEN 1 THEN 'Yes' ELSE 'No' END IsProductVariantUnitConversionEnabledName
-- system
, PPD.ProductDimensionGroup ProductDimensionGroupRecId
, PSG.StorageDimensionGroup StorageDimensionGroupRecId
, PTD.TrackingDimensionGroup TrackingDimensionGroupRecId
, PCA.RetailCategoryRecId
, ITM.RecId
, ITM.Partition
FROM dbo.EcoResProduct ITM
     LEFT JOIN dbo.EcoResProductTranslation ILT
	   ON ITM.RecId = ILT.Product 
	  AND ITM.Partition = ILT.Partition 
	  AND ILT.LanguageId = 'en-us'
     LEFT JOIN dbo.EcoResProductDimensionGroupProduct PPD
	   ON ITM.RecId = PPD.Product
	  AND ITM.Partition = PPD.Partition
	      LEFT JOIN dbo.EcoResProductDimensionGroup PDG
		    ON PPD.ProductDimensionGroup = PDG.RecId 
		   AND PPD.Partition = PDG.Partition 
	 LEFT JOIN dbo.EcoResStorageDimensionGroupProduct PSG
	   ON ITM.RecId = PSG.Product
	  AND ITM.Partition = PSG.Partition
	      LEFT JOIN dbo.EcoResStorageDimensionGroup SDG
		    ON PSG.StorageDimensionGroup = SDG.RecId 
		   AND PSG.Partition = SDG.Partition 
	 LEFT JOIN dbo.EcoResTrackingDimensionGroupProduct PTD
	   ON ITM.RecId = PTD.Product
	  AND ITM.Partition = PTD.Partition
	      LEFT JOIN dbo.EcoResTrackingDimensionGroup TDG
		    ON PTD.TrackingDimensionGroup = TDG.RecId 
		   AND PTD.Partition = TDG.Partition 
	 LEFT JOIN (-- product retail category 
	   SELECT PCA.Product 
	   , PCA.Partition 
	   , CAT.Code CategoryCode 
	   , CAT.Name CategoryName
	   , PCA.Category RetailCategoryRecId
	   FROM dbo.EcoResProductCategory PCA
	        JOIN dbo.EcoResProductRetailCategoryHierarchy RCH
			  ON PCA.CategoryHierarchy = RCH.RetailCategoryHierarchy
			 AND PCA.Product = RCH.Product 
			 AND PCA.Partition = RCH.Partition 
			JOIN dbo.EcoResCategory CAT
			  ON PCA.Category = CAT.RecId 
			 AND PCA.Partition = CAT.Partition 
		 ) PCA
	   ON ITM.RecId = PCA.Product 
	  AND ITM.Partition = PCA.Partition 
	  LEFT JOIN dbo.RetailKit KIT
	    ON ITM.RecId = KIT.ProductMaster 
	   AND ITM.Partition = KIT.Partition
WHERE NOT(ITM.InstanceRelationType  =  4211)

As can be seen, the logic is quite complex and only half of the tables were used. There will be entities even more complex than this (the query was restructured for understandability). On the other hand, there will be environments where only half from the above tables will be used (e.g., when no inventory and/or dimensions are needed). 

To test the view, one just needs to change the schema referenced in the logic. The view is created under the TDM (Table Data Model) schema, so there should be no issues as long the schemas are used correctly. However, when duplicating logic, one should check whether the values match, respectively whether the objects have the same record count:

-- checking whether the values match for an example
SELECT * 
FROM TDM.vEcoResProductV2Entity
WHERE ProductNumber = '0169'

SELECT * 
FROM EDM.vEcoResProductV2Entity
WHERE ProductNumber = '0169'


-- checking the number of records
SELECT count(*)
FROM TDM.vEcoResProductV2Entity

SELECT count(*)
FROM EDM.vEcoResProductV2Entity

There are several optimizations or restructuring opportunities in the logic, e.g., the 'product retail category' subquery can be created as a separate view. Also, the groupings of two tables for the 'dimension groups' could be encapsulated individually in views. This can increase the number of views created considerably, though upon case the views could prove to be useful for troubleshooting or reuse. 

Moreover, in environments with only a partition the constraints on the respective field could be removed (important decision though), while the value for the retail category could be hardcoded. Even if hardcoding values should be in general avoided, it's needed to compromise when there are more important constraints. 

One way to reduce logic's complexity is to create a "base view" for each table in which the needed transformations are made, respectively only the needed columns are used. Reducing the number of columns simplifies the identification of attributes. For example, the base view for dbo.EcoResProduct could be written as follows:

CREATE OR ALTER VIEW [TDM].[vEcoResProduct]
AS
/*
name: Products - master data (base view)
created: 01.04.2021
modified: 01.04.2021
*/
SELECT PRD.DisplayProductNumber ProductNumber
, PRD.ProductType 
, CASE PRD.ProductType
    WHEN 1 THEN 'Product'
    WHEN 2 THEN 'ProductMaster'
    WHEN 3 THEN 'ProductVariant'
  END ProductTypeName
, CASE WHEN PRD.INSTANCERELATIONTYPE = 15969 THEN 1 ELSE 2 END ProductSubtype 
, CASE 
    WHEN PRD.INSTANCERELATIONTYPE = 15969 THEN 'Item'
    ELSE 'Product master'  
   END ProductSubtypeName
, PRD.RetailSizeGroupId
, PRD.RetailColorGroupId
, PRD.RetailStyleGroupId
, PRD.RetailFlavorGroupId
, PRD.VariantConfigurationTechnology 
, CASE PRD.VariantConfigurationTechnology
    WHEN 0 THEN 'None'
    WHEN 1 THEN 'PredefinedVariants'
    WHEN 2 THEN 'DimensionBased'
    WHEN 3 THEN 'RuleBased'
    WHEN 4 THEN 'ConstraintBased'
  END VariantConfigurationTechnologyName
, PRD.IsProductVariantUnitConversionEnabled
, CASE PRD.IsProductVariantUnitConversionEnabled WHEN 1 THEN 'Yes' ELSE 'No' END IsProductVariantUnitConversionEnabledName
-- system
, PRD.RecId 
, PRD.Partition 
, PRD.ModifiedBy
FROM dbo.EcoResProduct PRD
WHERE NOT(PRD.InstanceRelationType  =  4211)
GO

A similar approach can be used for each table, or at least the tables that need further transformations. There are several choices - ideally one should find a good-enough approach and stick to it. There will be also exceptions, though the general design should prevail!

The bottom line, when using the Export to Data Lake add-in (*), as only the export of tables is supported, the logic can become occasionally complex, though still manageable (in other areas the tables are straightforward to use). When using Link to Data Lake, one can rely on data entities, as long they are synchronized correctly. However, one still needs to rely on tables to fill the gaps. 

Note:
(*) Existing customers have until 1-Nov-2024 to transition from Export to Data lake to Synapse link. Microsoft advises new customers to use Synapse Link.

Happy coding!

Previous Post << ||>> Next Post

09 October 2023

🪄💫SSRS (& Paginated Reports): Products Master Report in Dynamics 365 for Finance & Operations via Data Entities

With the Export to Data Lake add-in (*), respectively with Azure Synapse Link for Dataverse with Azure Data Lake, it's possible now to create Power BI paginated reports based directly on the Dynamics 365 Finance & Operations (D365 FO) data model as available in the Data Lake. With the add-in it's possible to export the tables from D365 FO, while with the second option it's possible to export data entities and hopefully soon base tables as well. 

The two features can be used in parallel in the same environment and even if they are based on different mechanisms, they synchronize D365 FO data to the Data Lake in standard data files that can be further consumed via a serverless/dedicated SQL server pool by reporting tools. Thus, one can build a data lakehouse/warehouse on top of the data for reporting. At least this was the approach before Microsoft Fabric. 

So, in the end a developer will have the option to choose between base tables and data entities, as synchronized to the Data Lake. Data entities encapsulate the logic as used by the D365 FO application and can thus allow developing a report with the minimum of overhead, at least in theory. Unfortunately, there are other downsides that make the use of base tables a better approach, at least for certain scenarios (e.g. data entities are not available for synchronization or doesn't include all needed fields). 

For the developer of reports the synchronization mechanism is less important. A set of database objects will be available, and reports can be built on top of them. Ideally, the base objects will have the same or similar names as in D365 FO, otherwise the differences between the two data models need to be translated in each piece of logic, which adds more complexity and overhead to the development.

Thus, to build a report to show the Product master data the developer can use the dbo.EcoResProductV2Entity data entity. Unfortunately, there are several important issues: (1) the name of the source entity can change as versions change, (2) there are fields based on Enums that store only the code and it's needed to map the corresponding values, (3) some fields from the base table need to be made available, (4) further transformations are needed (e.g., converting fields to formats). Thus, it's useful to encapsulate the logic into a view, when creating views is possible:

CREATE OR ALTER VIEW EDM.vEcoResProductV2Entity
AS 
/*
name:  Products - Master (base entity)
created: 01.04.2021
modified: 01.04.2021
*/
SELECT ITM.ProductType
, CASE ITM.ProductType
    WHEN 1 THEN 'Item'
    WHEN 2 THEN 'Service'
  END ProductTypeName
, ITM.ProductSubtype
, CASE ITM.ProductSubtype
    WHEN 1 THEN 'Product'
    WHEN 2 THEN 'Product Master'
    WHEN 3 THEN 'Product Variant'
   END ProductSubtypeName
, ITM.ProductNumber
, Replace(Replace(ITM.ProductName, char(10), ' '), char(13), ' ')  ProductName
, Replace(Replace(ITM.ProductDescription, char(10), ' '), char(13), ' ') ProductDescription
, ITM.RetailProductCategoryName 
, ITM.ProductDimensionGroupName 
, ITM.StorageDimensionGroupName 
, ITM.TrackingDimensionGroupName 
, ITM.ProductColorGroupId 
, ITM.ProductSizeGroupId 
, ITM.ProductStyleGroupId
, ITM.VariantConfigurationTechnology
, CASE ITM.VariantConfigurationTechnology
    WHEN 0 THEN 'None'
    WHEN 1 THEN 'Predefined Variants'
    WHEN 2 THEN 'Dimension Based'
    WHEN 3 THEN 'Rule Based'
    WHEN 4 THEN 'Constraint Based'
  END VariantConfigurationTechnologyName
, ITM.IsProductKit
, CASE ITM.IsProductKit WHEN 1 THEN 'Yes' ELSE 'No' END IsProductKitName
, ITM.IsCatchWeightproduct
, CASE ITM.IsCatchWeightproduct WHEN 1 THEN 'Yes' ELSE 'No' END IsCatchWeightproductName
, ITM.IsProductVariantUnitConversionEnabled
, CASE ITM.IsProductVariantUnitConversionEnabled WHEN 1 THEN 'Yes' ELSE 'No' END IsProductVariantUnitConversionEnabledName
-- system
, ITM.ProductDimensionGroupRecId
, ITM.StorageDimensionGroupRecId
, ITM.TrackingDimensionGroupRecId
, ITM.RetailCategoryRecId
, ITM.RecId
, ITM.Partition
FROM dbo.EcoResProductV2Entity ITM

As can be seen, the view was created in the EDM (Entity Data Model) and has the "v" prefix added to the original name. The EDM schema was created to store the objects based on data coming via data entities.

With this view's data can be consumed in the paginated report:

--Products - Master
SELECT ITM.ProductTypeName
, ITM.ProductSubtypeName
, ITM.ProductNumber
, ITM.ProductName
, ITM.RetailProductCategoryName 
, ITM.ProductDimensionGroupName 
, ITM.StorageDimensionGroupName 
, ITM.TrackingDimensionGroupName 
, ITM.ProductColorGroupId 
, ITM.ProductSizeGroupId 
, ITM.ProductStyleGroupId
, ITM.VariantConfigurationTechnologyName
, ITM.IsProductKitName
, ITM.IsCatchWeightproductName
FROM EDM.vEcoResProductV2Entity ITM
WHERE ITM.ProductName LIKE 'Mens%'
ORDER BY ITM.ProductNumber

One can use directly this query to generate the report, though in a second step, once the report was created, one might prefer to provide the query as variable to the corresponding dataset, as this allows better handling of the parameters and thus create the query dynamically as fit:

= "--Products - Master" & vbCrLf 
& "SELECT ITM.ProductTypeName" & vbCrLf 
& ", ITM.ProductSubtypeName" & vbCrLf 
& ", ITM.ProductNumber" & vbCrLf 
& ", ITM.ProductName" & vbCrLf 
& ", ITM.RetailProductCategoryName " & vbCrLf 
& ", ITM.ProductDimensionGroupName " & vbCrLf 
& ", ITM.StorageDimensionGroupName " & vbCrLf 
& ", ITM.TrackingDimensionGroupName " & vbCrLf 
& ", ITM.ProductColorGroupId " & vbCrLf 
& ", ITM.ProductSizeGroupId " & vbCrLf 
& ", ITM.ProductStyleGroupId" & vbCrLf 
& ", ITM.VariantConfigurationTechnologyName" & vbCrLf 
& ", ITM.IsProductKitName" & vbCrLf 
& ", ITM.IsCatchWeightproductName" & vbCrLf 
& ", ITM.IsProductVariantUnitConversionEnabledName" & vbCrLf 
& "FROM EDM.vEcoResProductV2Entity ITM" & vbCrLf 
& "WHERE 0=0 " & vbCrLf 
& IIf(Parameters!ProductName.Value<> "", " AND ITM.ProductName LIKE @ProductName ", "") & vbcrlf 
& IIf(Parameters!ProductNumber.Value<> "", " AND ITM.ProductNumber LIKE @ProductNumber", "") & vbcrlf 
& IIf(Parameters!ProductType.Value<> "", " 	AND ITM.ProductType = @ProductType", "") & vbcrlf 
& IIf(Parameters!ProductSubtype.Value<> "", " AND ITM.ProductSubtype = @ProductSubtype ", "") & vbcrlf 
& "ORDER BY ITM.ProductNumber" & vbCrLf

The expression can be created using an Excel formula (after vbCrLf observer the empty space needs to be set, otherwise the report will fail):
="& """ & A1 & """ & vbCrLf 

The four parameters created for exemplification need to be defined also in the dataset accordingly. And here's report's output:

For Product Number and Name the User can use wildcards - that's what the "*" besides parameter's Prompt signifies.

Unfortunately, the logic needs to be extended accordingly as soon as further attributes not available in the data entities are needed. In this scenario and several others, using directly the base tables allows more flexibility even if the logic behind the data entity needs to be duplicated.

Notes:
(1) When building and testing the report use only a small subset of the data. 
(2) For the dropdown parameters the "(all)" label was added which has an empty value. It allows in the expression to ignore the parameter, when selected. 
(3) In text values with a high probability of coming from Excel sheets (e.g. Product Name or Description) it might be a good idea to replace char (10) line feed, char (13) ENTER, and even char (9) horizontal Tab values, otherwise the data might not be exported correctly to Excel.
(4) If the definitions for Enums change, the mappings need to be changed accordingly. 
(*) Existing customers have until 1-Nov-2024 to transition from Export to Data lake to Synapse link. Microsoft advises new customers to use Synapse Link.

Happy coding!

Previous Post <<||>> Next Post

07 July 2020

🪄SSRS: Graphical Representations II (Sixth Magic Class)

Introduction 

Using a single chart to display multiple series in SQL Server Reporting Services (SSRS) or any other reporting tool works well when the number of series is somehow manageable - usually being enough to display 2-10 series within the same chart. The more series one adds, the more complicated will be for users to read the chart. One has the choice to find either
-  a level of detail (e.g. Category) which, when grouping the data, leads to a number of manageable series,
-  compare the data within a certain grouping (e.g. Category),
-  displaying the individual trends (e.g. for each Product). 

Let's consider the last choice. The report from this post will display the Sales Volume per Product and Year/Month of the Sales Orders available in the AdventureWorks2014 database. The logic uses the Sales.SalesOrderDetail and Sales.SalesOrderHeader tables, respectively the Production.vProducts view created in a previous post

Note:
A Sales Volume report is more appropriate to be built using a data warehouse's data, which are already aggregated and prepared for such reports. There's actually an AdventureWorksDW2014 data warehouse model made available which can be used to display the same information, however the intent is to demonstrate the techniques of working with data in an OLTP environment. 

Preparing the Data

Creating a view to build the Sales Orders details is usually recommended, though for the current report we just need the Product Category, Subcategory, Number and Name, respectively Sales Date, Quantity and Value, which is only a small part from the attributes available. Another choice to consider is whether to use the raw data, though then the number of records sent to the client can be considerably high, or aggregate the data and the lowermost level of detail needed for the report, in this case the Category, Subcategory, Product, Month and Year:


-- Sales volume per Product   
SELECT ITM.Category
, ITM.Subcategory
, ITM.ProductNumber
, ITM.Name
, Month(SOH.OrderDate) [Month]
, Year(SOH.OrderDate) [Year]
, Sum(SOD.OrderQty) OrderQty
, Sum(SOD.LineTotal) OrderValue
FROM Sales.SalesOrderDetail SOD
     JOIN Sales.SalesOrderHeader SOH
       ON SOD.SalesOrderID = SOH.SalesOrderID
     JOIN Production.vProducts ITM
       ON SOD.ProductId = ITM.Productid 
WHERE ITM.ProductNumber IN ('BB-7421', 'BB-9108')
GROUP BY ITM.Category
, ITM.Subcategory
, ITM.ProductNumber
, ITM.Name
, Month(SOH.OrderDate)
, Year(SOH.OrderDate)
ORDER BY ITM.Category
, ITM.Subcategory
, ITM.ProductNumber
, [Year]
, [Month]

The query contains all the needed data, however one could have more flexibility if the data would contain cumulative or total values as well: 


-- Sales volume per Product (extended)  
SELECT SOD.Category
, SOD.Subcategory
, SOD.ProductNumber
, SOD.Name
, SOD.[Month]
, SOD.[Year]
, SOD.OrderQty
, SOD.OrderValue
, SUM(SOD.OrderQty) OVER (PARTITION BY SOD.ProductNumber) TotalQty
, SUM(SOD.OrderValue) OVER (PARTITION BY SOD.ProductNumber) TotalValue
, SUM(SOD.OrderQty) OVER (PARTITION BY SOD.ProductNumber ORDER BY [Year], [Month]) CumulatedQty
, SUM(SOD.OrderValue) OVER (PARTITION BY SOD.ProductNumber ORDER BY [Year], [Month]) CumulatedValue
FROM (-- cumulated values
 SELECT ITM.Category
 , ITM.Subcategory
 , ITM.ProductNumber
 , ITM.Name
 , Month(SOH.OrderDate) [Month]
 , Year(SOH.OrderDate) [Year]
 , Sum(SOD.OrderQty) OrderQty
 , Sum(SOD.LineTotal) OrderValue
 FROM Sales.SalesOrderDetail SOD
   JOIN Sales.SalesOrderHeader SOH
    ON SOD.SalesOrderID = SOH.SalesOrderID
   JOIN [Production].[vProducts] ITM
     ON SOD.ProductId = ITM.Productid 
 WHERE ITM.ProductNumber IN ('BB-7421', 'BB-9108')
 GROUP BY ITM.Category
    , ITM.Subcategory
 , ITM.ProductNumber
 , ITM.Name
 , Month(SOH.OrderDate)
 , Year(SOH.OrderDate)
  ) SOD
ORDER BY SOD.Category
, SOD.Subcategory
, SOD.ProductNumber
, SOD.[Year]
, SOD.[Month]
In the end one can use any of the above queries.
Note:When prototyping a report is usually recommended to consider only a small number of records (e.g. only two Products). In addition, do not forget to validate the number or records considered by the logic:

-- checking the view for internal data consistency
SELECT count(*)
FROM Sales.SalesOrderDetail SOD
     JOIN Sales.SalesOrderHeader SOH
   ON SOD.SalesOrderID = SOH.SalesOrderID
  JOIN Production.vProducts ITM
    ON SOD.ProductId = ITM.Productid 
Creating the Report
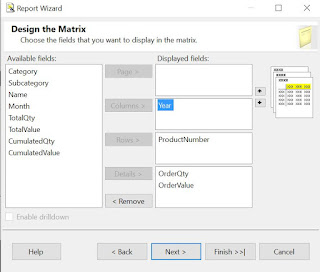
Using the Report Wizard create a new matrix report called "Sales Volume per Product" based on either of the above queries (I considered the second). Within "Design the Matrix" select the attributes as follows:
Design the Matrix

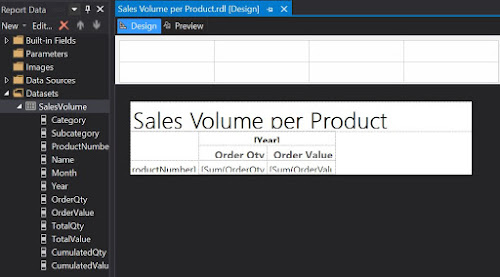
This will create the backbone for our report:

First draft in Design mode

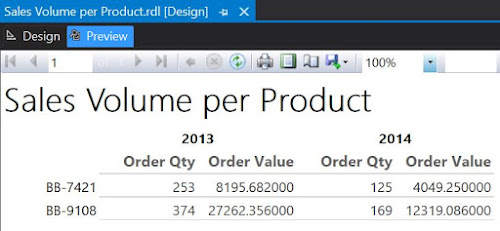
Which is pretty basic, if we consider the output:

First draft in Preview mode

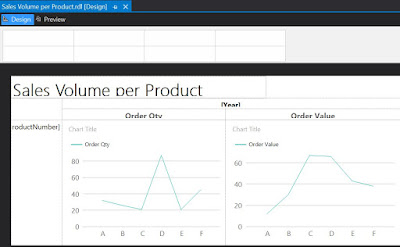
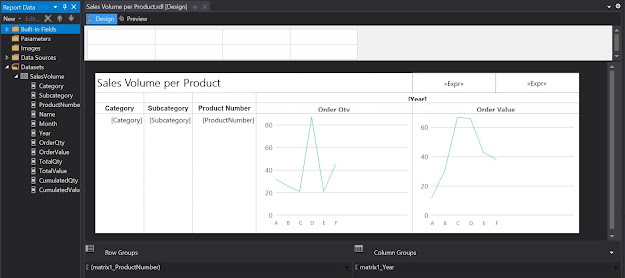
Now, returning in Design mode, right click on the "Sum of OrderQty" cell and from the floating menu select Insert/Chart, while from the list of available charts select Line. Do the same for "Sum of OrderValue". And here's the result:

Second draft in Design mode

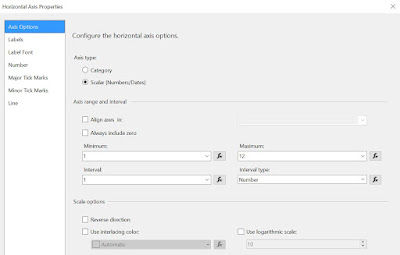
As only one series will be displayed, select the Chart Title and delete the respective label. Delete the Series label as well. When running the report you'll observe that the horizontal axis values are not really appealing. To dix this right click on the respective area and from the floating menu select Horizontal Axis Properties. Within Axis Options section change the Axis type as 'Scalar', enter '1' as Minimum, '12' as Maximum, '1' as Interval and 'Number' as Interval type:

Horizontal Axis Properties

In the same window, within the Labels section select 'Enable auto-fit' and uncheck the "Labels can be offset", respectively the "Labels can be rotated" checkboxes. 

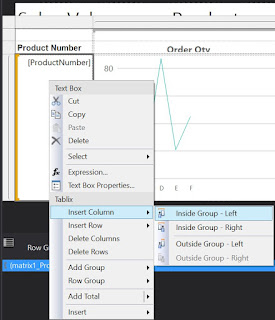
To include the Category, Subcategory and eventually the Product Name, select the Product Number cell, right click on it, and from the floating menu select Insert Column/Inside Group - Left, then select from the Category as attribute:
Inserting a column within the group

Repeat the process to add the Subcategory. Eventually you can add also the Product Name, though for it you'll have to select "Inside Group - Right". 

To improve the design, you can add a Page Header and move the report's title into it add a timestamp, respectively a page count textbox, resize the boxes to fit the columns. You can also align the column header values to the center, change the font to 10pt, etc.

Third draft in Design mode

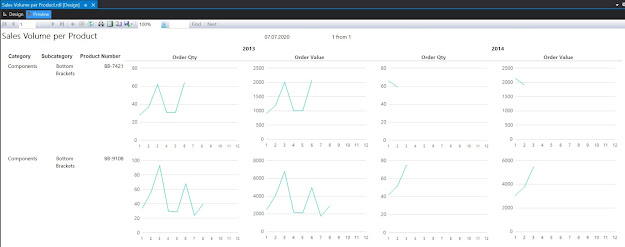
Here's the report in preview mode:

Third draft in Preview mode

One can use the report the way it is, or add the Category and Subcategory as parameters. Similarly, one can use the cumulative values as input for the charts. 

Revamping the Report with Sparklines

Even if the charts allow displaying the scales, the problem with them is that they are too big, which makes it difficult to compare the data across records. One can correct this by using the other types of graphics available in reports, e.g. sparklines. For this make a copy of the report already built, and within the Detail cells select a Sparkine Column instead of a chart:

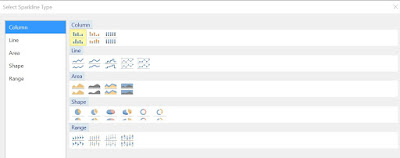
Sparkline types


In comparison with Lines, Column-based representations allow to see how many data points are represented. Because spartklines are more compact as graphic forms, you can resize the cells as follows:

Fourth draft in Design mode

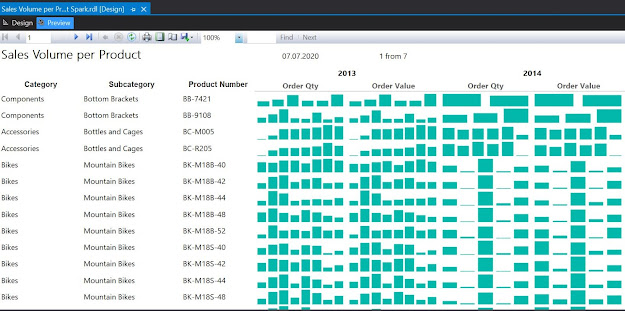
And here's the report in preview mode (the constraints from the source query were removed):

Fourth draft in Preview mode

As can be seen one can easily identify the trends however the volume scale was lost, being impossible to compare which of the Products sold better. One can bring the Total Quantity and Value as display information and sort the dataset from the highest to lowest value. One can even select a top x, to reduce the focus only to the most sold Products.

If the prices remained relatively constant over time, there's actually almost no difference between the graphic displays for Order Quantity, respectively for Order Value. Therefore one can remove one of them (e.g. Order Quantity). Being more compact, sparkline-based representations allow to better use the space, therefore you can add more fields into the report. 

Happy coding!
Related Posts Plugin for WordPress, Blogger...

About Me

My photo
Koeln, NRW, Germany
IT Professional with more than 24 years experience in IT in the area of full life-cycle of Web/Desktop/Database Applications Development, Software Engineering, Consultancy, Data Management, Data Quality, Data Migrations, Reporting, ERP implementations & support, Team/Project/IT Management, etc.