Showing posts with label heatmaps. Show all posts

27 May 2024

📊Graphical Representation: Graphics We Live By (Part VI: Conversion Rates in Power BI)

Graphical Representation Series

Introduction

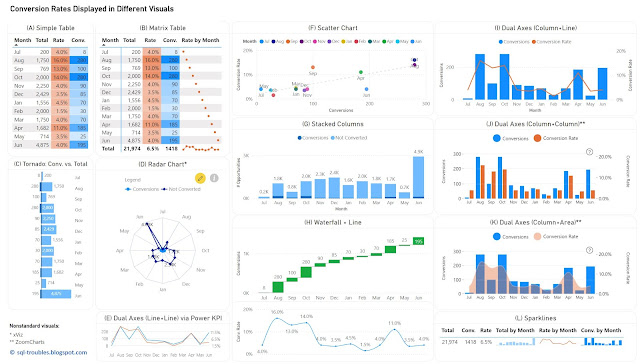
Conversion rates record the percentage of users, customers and other entities who completed a desired action within a set of steps, typically as part of a process. Conversion rates are a way to evaluate the performance of digital marketing processes in respect to marketing campaigns, website traffic and other similar actions. 

In data visualizations the conversion rates can be displayed occasionally alone over a time unit (e.g. months, weeks, quarters), though they make sense only in the context of some numbers that reveal the magnitude, either the conversions or the total number of users (as one value can be calculated then based on the other). Thus, it is needed to display two data series with different scales if one considers the conversion rates, respectively display the conversions and the total number of users on the same scale. 

For the first approach, one can use (1) a table or heatmap, if the number of values is small (see A, B) or the data can be easily aggregated (see L); (2) a visual with dual axis where the values are displayed as columns, lines or even areas (see E, I, J, K); (3) two different visuals where the X axis represents the time unit (see H); (4) a visual that can handle by default data series with different axis - a scatter chart (see F). For the second approach, one has a wider set of display methods (see C, D, G), though there are other challenges involved.
Conversion Rates in Power BI

Tables/Heatmaps

When the number of values is small, as in the current case, a table with the unaltered values can occasionally be the best approach in terms of clarity, understandability, explicitness, or economy of space. The table can display additional statistics including ranking or moving averages. Moreover, the values contained can be represented as colors or color saturation, with different smooth color gradients for each important column, which allows to easily identify high/low values, respectively values from the same row with different orders of magnitude (see the values for September).

In Power BI, a simple table (see A) allows to display the values as they are, though it doesn't allow to display totals. Conversely, a matrix table (see B) allows to display the totals, though one needs to use measures to calculate the values, and to use sparklines, even if in this case the values displayed are meaningless except the totals. Probably, a better approach would be to display the totals with sparklines in an additional table (see L), which is based on a matrix table. Sparklines better use the space and can be represented inline in tables, though each sparkline follows its own scale of values (which can be advantageous or disadvantageous upon case).

Column/Bar Charts 

Column or bar charts are usually the easiest way to encode values as they represent magnitude by their length and are thus easy to decode. To use a single axis one is forced to use the conversions against the totals, and this may work in many cases. Unfortunately, in this case the number of conversions is small compared with the number of "actions", which makes it challenging to make inferences on conversion rates' approximate values. Independently of this, it's probably a good idea to show a visual with the conversion rates anyway (or use dual axes).

In Power BI, besides the standard column/bar chart visuals (see G), one can use also the Tornado visual from Microsoft (see C), which needs to be added manually and is less customizable than the former. It allows to display two data series in mirror and is thus more appropriate for bipartite data (e.g. males vs females), though it allows to display the data labels clearly for both series, and thus more convenient in certain cases. 

Dual Axes 

A dual-axis chart is usually used to represent the relationship between two variables with different amplitude or scale, encoding more information in a smaller place than two separate visuals would do. The primary disadvantage of such representations is that they take more time and effort to decode, not all users being accustomed with them. However, once the audience is used to interpreting such charts, they can prove to be very useful.

One can use columns/bars, lines and even areas to encode the values, though the standard visuals might not support all the combinations. Power BI provides dual axis support for the line chart, the area chart, the line and staked/clustered column charts (see I), respectively the Power KPI chart (see E). Alternatively, custom visuals from ZoomCharts and other similar vendors could offer more flexibility.  For example, ZoomCharts's Drill Down Combo PRO allows to mix  columns/bars, lines, and areas with or without smooth lines (see J, K).

Currently, Power BI standard visuals don't allow column/bar charts on both axes concomitantly. In general, using the same encoding on both sides of the axes might not be a good idea because audience's tendency is to compare the values on the same axis as the encoding looks the same. For example, if the values on both sides are encoded as column lengths (see J), the audience may start comparing the length without considering that the scales are different. One needs to translate first the scale equivalence (e.g. 1:3) and might be a good idea to reflect this (e.g. in subtitle or annotation). Therefore, the combination column and line (see I) or column and area (see K) might work better. In the end, the choice depends on the audience or one's feeling what may work. 

Radar Chart

Radar charts are seldom an ideal solution for visualizing data, though they can be used occasionally for displaying categorical-like data, in this case monthly based data series. The main advantage of radar charts is that they allow to compare areas overlapping of two or more series when their overlap is not too cluttered. Encoding values as areas is in general not recommended, as areas are more difficult to decode, though in this case the area is a secondary outcome which allows upon case some comparisons.

Scatter Chart

Scatter charts (and bubble charts) allow by design to represent the relationship between two variables with different amplitude or scale, while allowing to infer further information - the type of relationship, respectively how strong the relationship between the variables is. However, each month needs to be considered here as a category, which makes color decoding more challenging, though labels can facilitate the process, even if they might overlap. 

Using Distinct Visuals

As soon as one uses distinct visuals to represent each data series, the power of comparison decreases based on the appropriateness of the visuals used. Conversely, one can use the most appropriate visual for each data series. For example, a waterfall chart can be used for conversions, and a line chart for conversion rates (see H). When the time axis scales similarly across both charts, one can remove it.

The Data

The data comes from a chart with dual axes similar to the visual considered in (J). Here's is the Power Query script used to create the table used for the above charts:

let
    Source = #table({"Sorting", "Month" ,"Conversions", "Conversion Rate"}
, {
{1,"Jul",8,0.04},
{2,"Aug",280,0.16},
{3,"Sep",100,0.13},
{4,"Oct",280,0.14},
{5,"Nov",90,0.04},
{6,"Dec",85,0.035},
{7,"Jan",70,0.045},
{8,"Feb",30,0.015},
{9,"Mar",70,0.04},
{10,"Apr",185,0.11},
{11,"May",25,0.035},
{12,"Jun",195,0.04}
}
),
    #"Changed Types" = Table.TransformColumnTypes(Source,{{"Sorting", Int64.Type}, {"Conversions", Int64.Type}, {"Conversion Rate", Number.Type}})
in
    #"Changed Types"

Conclusion

Upon case, depending also on the bigger picture, each of the above visuals can be used. I would go with (H) or an alternative of it (e.g. column chart instead of waterfall chart) because it shows the values for both data series. If the values aren't important and the audience is comfortable with dual axes, then probably I would go with (K) or (I), with a plus for (I) because the line encodes the conversion rates better than an area. 

Happy (de)coding!

Previous Post <<||>> Next Post

25 April 2024

📊Graphical Representation: Graphics We Live By (Part III: Exchange Rates in Power BI)

Graphical Representation Series

An exchange rate (XR) is the rate at which one currency will be exchanged for another currency, and thus XRs are used in everything related to trades, several processes in Finance relying on them. There are various sources for the XR like the European Central Bank (ECB) that provide the row data and various analyses including graphical representations varying in complexity. Conversely, XRs' processing offers some opportunities for learning techniques for data visualization. 

On ECB there are monthlyyearly, daily and biannually XRs from EUR to the various currencies which by triangulation allow to create XRs for any of the currencies involved. If N currencies are involved for one time unit in the process (e.g. N-1 XRs) , the triangulation generates NxN values for only one time division, the result being tedious to navigate. A matrix like the one below facilitates identifying the value between any of the currencies:


The table needs to be multiplied by 12, the number of months, respectively by the number of years, and filter allowing to navigate the data as needed. For many operations is just needed to look use the EX for a given time division. There are however operations in which is needed to have a deeper understanding of one or more XR's evolution over time (e.g. GBP to NOK). 

Moreover, for some operations is enough to work with two decimals, while for others one needs to use up to 6 or even more decimals for each XR. Occasionally, one can compromise and use 3 decimals, which should be enough for most of the scenarios. Making sense of such numbers is not easy for most of us, especially when is needed to compare at first sight values across multiple columns. Summary tables can help:

Statistics like Min. (minimum), Max. (maximum), Max. - Min. (range), Avg. (average) or even StdDev. (standard deviation) can provide some basis for further analysis, while sparklines are ideal for showing trends over a time interval (e.g. months).

Usually, a heatmap helps to some degree to navigate the data, especially when there's a plot associated with it:

In this case filtering by column in the heatmap allows to see how an XR changed for the same month over the years, while the trendline allows to identify the overall tendency (which is sensitive to the number of years considered). Showing tendencies or patterns for the same month over several years complements the yearly perspective shown via sparklines.

Fortunately, there are techniques to reduce the representational complexity of such numbers. For example, one can use as basis the XRs for January (see Base Jan), and represent the other XRs only as differences from the respective XR. Thus, in the below table for February is shown the XR difference between February and January (13.32-13.22=0.10). The column for January is zero and could be omitted, though it can still be useful in further calculations (e.g. in the calculation of averages) based on the respective data..

This technique works when the variations are relatively small (e.g. the values vary around 0). The above plots show the respective differences for the whole year, respectively only for four months. Given a bigger sequence (e.g. 24, 28 months) one can attempt to use the same technique, though there's a point beyond which it becomes difficult to make sense of the results. One can also use the year end XR or even the yearly average for the same, though it adds unnecessary complexity to the calculations when the values for the whole year aren't available. 

Usually, it's recommended to show only 3-5 series in a plot, as one can better distinguish the trends. However, plotting all series allows to grasp the overall pattern, if any. Thus, in the first plot is not important to identify the individual series but to see their tendencies. The two perspectives can be aggregated into one plot obtained by applying different filtering. 

Of course, a similar perspective can be obtained by looking at the whole XRs:

The Max.-Min. and StdDev (standard deviation for population) between the last and previous tables must match. 

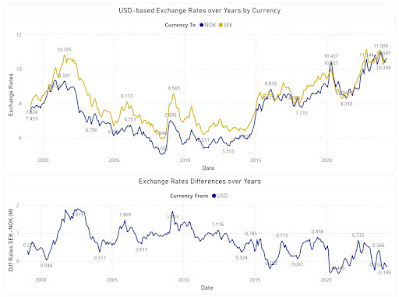
Certain operations require comparing the trends of two currencies. The first plot shows the evolution NOK and SEK in respect to EUR, while the second shows only the differences between the two XRs:


The first plot will show different values when performed against other currency (e.g. USD), however the second plot will look similarly, even if the points deviate slightly:

Another important difference is the one between monthly and yearly XRs, difference depicted by the below plot:

The value differences between the two XR types can have considerable impact on reporting. Therefore, one must reflect in analyses the rate type used in the actual process. 

Attempting to project data into the future can require complex techniques, however, sometimes is enough to highlight a probable area, which depends also on the confidence interval (e.g. 85%) and the forecast length (e.g. 10 months):

Every perspective into the data tends to provide something new that helps in sense-making. For some users the first table with flexible filtering (e.g. time unit, currency type, currency from/to) is enough, while for others multiple perspectives are needed. When possible, one should  allow users to explore the various perspectives and use the feedback to remove or even add more perspectives. Including a feedback loop in graphical representation is important not only for tailoring the visuals to users' needs but also for managing their expectations,  respectively of learning what works and what doesn't.

Comments:
1) I used GBP to NOK XRs to provide an example based on  triangulation.
2) Some experts advise against using borders or grid lines. Borders, as the name indicates allow to delimitate between various areas, while grid lines allow to make comparisons within a section without needing to sway between broader areas, adding thus precision to our senses-making. Choosing grey as color for the elements from the background minimizes the overhead for coping with more information while allowing to better use the available space.
3) Trend lines are recommended where the number of points is relatively small and only one series is involved, though, as always, there are exceptions too. 
4) In heatmaps one can use a gradient between two colors to show the tendencies of moving toward an extreme or another. One should avoid colors like red or green.
5) Ideally, a color should be used for only one encoding (e.g. one color for the same month across all graphics), though the more elements need to be encoded, the more difficult it becomes to respect this rule. The above graphics might slightly deviate from this as the purpose is to show a representation technique. 
6) In some graphics the XRs are displayed only with two decimals because currently the technique used (visual calculations) doesn't support formatting.
7) All the above graphical elements are based on a Power BI solution. Unfortunately, the tool has its representational limitations, especially when one wants to add additional information into the plots. 
8) Unfortunately, the daily XR values are not easily available from the same source. There are special scenarios for which a daily, hourly or even minute-based analysis is needed.
9) It's a good idea to validate the results against the similar results available on the web (see the ECB website).

Previous Post <<||>> Next Post

11 December 2011

📉Graphical Representation: Heatmaps (Just the Quotes)

"Heatmaps are two-dimensional graphical representations of data where the values of a variable are shown as colors. Heatmaps are compelling for two reasons. First, the intuitive nature of the color scale as it relates to temperature minimizes the amount of learning necessary to understand it. From experience, we know that yellow is warmer than green, orange is warmer than yellow, and red is hot. It is not difficult to then figure out that the amount of heat is proportional to the level of the represented variable. Second, heatmaps show the data directly over the stimulus. Because the data could not be any closer to the elements to which they pertain, little mental effort is required to read a heatmap." (Agnieszka Bojkon, "Informative or Misleading? Heatmaps Deconstructed", [in "Human-Computer Interaction: New Trends, 13th International Conference"] 2009)

"Heat maps offer a good way to systematically identify risks, but from our point of view they have one problem - they focus on risk reduction, not risk leverage. [...] The point of the inverse heat map is to highlight opportunities that might be discarded out-of-hand because they are a gamble. If something is very unlikely (the left-hand side of the heat map), it is not worth pursuing, but opportunities that are somewhat unlikely but would have a high payoff are attractive (top right portion of the heat map)." (John W Boudreau et al, "Transformative HR: How Great Companies Use Evidence-Based Change for Sustainable Advantage", 2011)

"With further similarities to small multiples, heatmaps enable us to perform rapid pattern matching to detect the order and hierarchy of different quantitative values across a matrix of categorical combinations. The use of a color scheme with decreasing saturation or increasing lightness helps create the sense of data magnitude ranking." (Andy Kirk, "Data Visualization: A successful design process", 2012)

"Heat mapping is essentially using conditional formatting, often color, to focus a reader’s attention on specific data points. Evaluators can use different colors to highlight whether output measures were met and different gradients of a single color to provide a sense of range." (Christopher Lysy, "Developments in Quantitative Data Display and Their Implications for Evaluation", 2013)

"The advantage of the calendar heat map over the line chart is that, along with seeing cycles as you scan top to bottom, it’s easy to see specific days in rows and columns, so it’s easier to reference what day of the year each value is for." (Nathan Yau, "Data Points: Visualization That Means Something", 2013)

"[...] a color-mapping visualization is effective if, by looking at the generated colors, we can easily and accurately make statements about the original scalar dataset that was color mapped." (Alexandru Telea, "Data Visualization: Principles and Practice" 2nd Ed., 2015)

"Compared to the rainbow colormap, the heat map uses a smaller set of hues, but adds luminance as a way to order colors in an intuitive manner. Compared to the two-hue colormap, the heat map uses more hues, thus allowing one to discriminate between more data values." (Alexandru Telea, "Data Visualization: Principles and Practice" 2nd Ed., 2015)

"Heat maps are effective visualizations for seeing concentrations as well as patterns. Adding time series to a heat map can also reveal seasonality that may not be obvious otherwise." (Andy Kriebel & Eva Murray, "#MakeoverMonday: Improving How We Visualize and Analyze Data, One Chart at a Time", 2018)

"A heatmap is a visualization where values contained in a matrix are represented as colors or color saturation. Heatmaps are great for visualizing multivariate data (data in which analysis is based on more than two variables per observation), where categorical variables are placed in the rows and columns and a numerical or categorical variable is represented as colors or color saturation." (Mario Döbler & Tim Großmann, "The Data Visualization Workshop", 2nd Ed., 2020)

"Heatmap is another representational way in which the frequencies of the various parameters of the data set is represented in different colors, much like an image captured by a thermal imaging camera in which the graph consists of varying temperatures and the temperatures are differentiated according to the colors." (Shreyans Pathak & Shashwat Pathak, "Data Visualization Techniques, Model and Taxonomy", 2020)

26 August 2011

📈Graphical Representation: Heatmaps (Definitions)

"A chart where one set of values is represented by areas of rectangles, and other sets of values are represented by colors. [...] the size of a rectangle reflects its importance, and color conveys the speed of change." (DAMA International, "The DAMA Dictionary of Data Management", 2011)

"A type of map presentation where the intensity of color for each polygon corresponds to the related analytical data. For example, low values in a range appear as blue (cold) and high values as red (hot)." (Microsoft, "SQL Server 2012 Glossary", 2012)

"A heat map is a graphical representation where the data values are mapped to color intensities. The name heat map refers to the popular color-encoding where high values are encoded to hotter colors such as reds and yellows and smaller values are encoded to greens and blues. However, a heat map can have any color encoding that is convenient." (Ira Greenberg et al, "Processing: Creative Coding and Generative Art in Processing 2", 2013)

"A color-coded matrix generated by stakeholders voting on risk level by color (e.g., red being highest)." (Robert F Smallwood, "Information Governance: Concepts, Strategies, and Best Practices", 2014)

"Heatmap is a visualization that displays the expression values of the features (genes, exons, etc.) using a color scale. Features are typically arranged in columns (samples) and rows (features) as in the original data matrix. Each feature-sample pair is represented with a small rectangle that is colored according to its expression. Often both samples and features are hierarchically clustered before constructing the heatmap, and clustering is represented with a tree on the left and top from the colored data matrix." (Eija Korpelainen et al, "RNA-seq Data Analysis: A Practical Approach", 2014)

"[Heatmap is] a special kind of tile map, which is a two-dimensional graphical representation of data having values displayed using colors instead of numbers, text, or markers (data  points). It provides an easy way to understand and analyze complex/huge data sets. It applies blurring of markers and shading (dark or light) on the basis of the total amount of overlap."  (Yuvraj Gupta, "Kibana Essentials", 2015)

"Heatmaps are two-dimensional graphical representations of data where the values of a variable are shown as colors." (Agnieszka Bojkon, "Informative or Misleading? Heatmaps Deconstructed", [in "Human-Computer Interaction: New Trends, 13th International Conference"] 2009) 

"A heat map is a graphical representation of a table of data. The individual values are arranged in a table/matrix and represented by colors. Use grayscale or gradient for coloring. Sorting of the variables changes the color pattern." (Kristen Sosulski, "Data Visualization Made Simple: Insights into Becoming Visual", 2019)

"A heat map is a thematic map in which areas are shaded or patterned in proportion to the measurement of the statistical variable being displayed on the map, such as population density or per capita income. Heat maps provide an easy way to visualize how a measurement varies across a geographic area or show the level of variability within a region." (Sankar N. Nair & E S Gopi,  "Deep Learning Techniques for Crime Hotspot Detection", 2020)

"A heatmap is a visualization where values contained in a matrix are represented as colors or color saturation. Heatmaps are great for visualizing multivariate data (data in which analysis is based on more than two variables per observation), where categorical variables are placed in the rows and columns and a numerical or categorical variable is represented as colors or color saturation." (Mario Döbler & Tim Großmann, "The Data Visualization Workshop", 2nd Ed., 2020)

"Heatmap is another representational way in which the frequencies of the various parameters of the data set is represented in different colors, much like an image captured by a thermal imaging camera in which the graph consists of varying temperatures and the temperatures are differentiated according to the colors." (Shreyans Pathak & Shashwat Pathak, "Data Visualization Techniques, Model and Taxonomy", 2020)

"A heatmap is a plot that shows the magnitude of a phenomenon as color in two dimensions. The color variation may be by hue or intensity." (Swapnil Saurav, "Python Apps on Visual Studio Code", 2024)

Related Posts Plugin for WordPress, Blogger...

About Me

My photo
Koeln, NRW, Germany
IT Professional with more than 24 years experience in IT in the area of full life-cycle of Web/Desktop/Database Applications Development, Software Engineering, Consultancy, Data Management, Data Quality, Data Migrations, Reporting, ERP implementations & support, Team/Project/IT Management, etc.