Showing posts with label graph. Show all posts

01 June 2024

Graphical Representation: Graphics We Live By (Part VIII: List of Items in Power BI)

Graphical Representation Series

Introduction

There are situations in which one needs to visualize only the rating, other values, or ranking of a list of items (e.g. shopping cart, survey items) on a scale (e.g. 1 to 100, 1 to 10) for a given dimension (e.g. country, department). Besides tables, in Power BI there are 3 main visuals that can be used for this purpose: the clustered bar chart, the line chart (aka line graph), respectively the slopegraph:

Main Display Methods

Main Display Methods

For a small list of items and dimension values probably the best choice would be to use a clustered bar chart (see A). If the chart is big enough, one can display also the values as above. However, the more items in the list, respectively values in the dimension, the more space is needed. One can maybe focus then only on a subset of items from the list (e.g. by grouping several items under a category), respectively choose which dimension values to consider. Another important downside of this method is that one needs to remember the color encodings. 

This downside applies also to the next method - the use of a line chart (see B) with categorical data, however applying labels to each line simplifies its navigation and decoding. With line charts the audience can directly see the order of the items, the local and general trends. Moreover, a line chart can better scale with the number of items and dimension values.

The third option (see C), the slopegraph, looks like a line chart though it focuses only on two dimension values (points) and categorizes the line as "down" (downward slope), "neutral" (no change) and "up" (upward slope). For this purpose, one can use parameters fields with measures. Unfortunately, the slopegraph implementation is pretty basic and the labels overlap which makes the graph more difficult to read. Probably, with the new set of changes planned by Microsoft, the use of conditional formatting of lines would allow to implement slope graphs with line charts, creating thus a mix between (B) and (C).

This is one of the cases in which the Y-axis (see B and C) could be broken and start with the meaningful values. 

Table Based Displays

Especially when combined with color encodings (see C & G) to create heatmap-like displays or sparklines (see E), tables can provide an alternative navigation of the same data. The color encodings allow to identify the areas of focus (low, average, or high values), while the sparklines allow to show inline the trends. Ideally, it should be possible to combine the two displays.  

Table Displays and the Aster Plot

One can vary the use of tables. For example, one can display only the deviations from one of the data series (see F), where the values for the other countries are based on AUS. In (G), with the help of visual calculations one can also display values' ranking. 

Pie Charts

Pie charts and their variations appear nowadays almost everywhere. The Aster plot is a variation of the pie charts in which the values are encoded in the height of the pieces. This method was considered because the data used above were encoded in 4 similar plots. Unfortunately, the settings available in Power BI are quite basic - it's not possible to use gradient colors or link the labels as below:

Source Data as Aster Plots

Sankey Diagram

A Sankey diagram is a data visualization method that emphasizes the flow or change from one state (the source) to another (the destination). In theory it could be used to map the items to the dimensions and encode the values in the width of the lines (see I). Unfortunately, the diagram becomes challenging to read because all the lines and most of the labels intersect. Probably this could be solved with more flexible formatting and a rework of the algorithm used for the display of the labels (e.g. align the labels for AUS to the left, while the ones for CAN to the right).
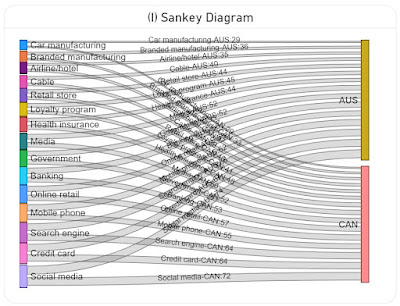
Sankey Diagram

Data Preparation

A variation of the above image with the Aster Plots which contains only the plots was used in ChatGPT to generate the basis data as a table via the following prompts:

  • retrieve the labels from the four charts by country and value in a table
  • consolidate the values in a matrix table by label country and value
The first step generated 4 tables, which were consolidated in a matrix table in the second step. Frankly, the data generated in the first step should have been enough because using the matrix table required an additional step in DAX.

Here is the data imported in Power BI as the Industries query:

let
    Source = #table({"Label","Australia","Canada","U.S.","Japan"}
, {
 {"Credit card","67","64","66","68"}
, {"Online retail","55","57","48","53"}
, {"Banking","58","53","57","48"}
, {"Mobile phone","62","55","44","48"}
, {"Social media","74","72","62","47"}
, {"Search engine","66","64","56","42"}
, {"Government","52","52","58","39"}
, {"Health insurance","44","48","50","36"}
, {"Media","52","50","39","23"}
, {"Retail store","44","40","33","23"}
, {"Car manufacturing","29","29","26","20"}
, {"Airline/hotel","35","37","29","16"}
, {"Branded manufacturing","36","33","25","16"}
, {"Loyalty program","45","41","32","12"}
, {"Cable","40","39","29","9"}
}
),
    #"Changed Types" = Table.TransformColumnTypes(Source,{{"Australia", Int64.Type}, {"Canada", Int64.Type}, {"U.S.", Number.Type}, {"Japan", Number.Type}})
in
    #"Changed Types"

Transforming (unpivoting) the matrix to a table with the values by country:

IndustriesT = UNION (
    SUMMARIZECOLUMNS(
     Industries[Label]
     , Industries[Australia]
     , "Country", "Australia"
    )
    , SUMMARIZECOLUMNS(
     Industries[Label]
     , Industries[Canada]
     , "Country", "Canada"
    )
    , SUMMARIZECOLUMNS(
     Industries[Label]
     , Industries[U.S.]
     , "Country", "U.S."
    )
    ,  SUMMARIZECOLUMNS(
     Industries[Label]
     , Industries[Japan]
     , "Country", "Japan"
    )
)

Notes:
The slopechart from MAQ Software requires several R language libraries to be installed (see how to install the R language and optionally the RStudio). Run the following scripts, then reopen Power BI Desktop and enable running visual's scripts.

install.packages("XML")
install.packages("htmlwidgets")
install.packages("ggplot2")
install.packages("plotly")

Happy (de)coding!

27 February 2021

Python: PySpark and GraphFrames (Test Drive)

Besides the challenges met during configuring the PySpark & GraphFrames environment, also running my first example in Spyder IDE proved to be a bit more challenging than expected. Starting from an example provided by the DataBricks documentation on GraphFrames, I had to add 3 more lines to establish the connection of the Spark cluster, respectively to deactivate the context (only one SparkContext can be active per Java VM).

The following code displays the vertices and edges, respectively the in and out degrees for a basic graph. 

from graphframes import *
from pyspark.context import SparkContext
from pyspark.sql.session import SparkSession

#establishing a connection to the Spark cluster (code added)
sc = SparkContext('local').getOrCreate()
spark = SparkSession(sc)

# Create a Vertex DataFrame with unique ID column "id"
v = spark.createDataFrame([
  ("a", "Alice", 34),
  ("b", "Bob", 36),
  ("c", "Charlie", 30),
  ("d", "David", 29),
  ("e", "Esther", 32),
  ("f", "Fanny", 36),
  ("g", "Gabby", 60)
], ["id", "name", "age"])
# Create an Edge DataFrame with "src" and "dst" columns
e = spark.createDataFrame([
  ("a", "b", "friend"),
  ("b", "c", "follow"),
  ("c", "b", "follow"),
  ("f", "c", "follow"),
  ("e", "f", "follow"),
  ("e", "d", "friend"),
  ("d", "a", "friend"),
  ("a", "e", "friend")
], ["src", "dst", "relationship"])

# Create a GraphFrame
g = GraphFrame(v, e)

g.vertices.show()
g.edges.show()

g.inDegrees.show()
g.outDegrees.show()

#stopping the active context (code added)
sc.stop()

Output:
id nameage
a Alice34
b Bob36
cCharlie30
d David29
e Esther32
f Fanny36
g Gabby60
srcdstrelationship
a b friend
b c follow
c b follow
f c follow
e f follow
e d friend
d a friend
a e friend
idinDegree
f1
e1
d1
c2
b2
a1
idoutDegree
f1
e2
d1
c1
b1
a2

Notes:
Without the last line, running a second time the code will halt with the following error: 
ValueError: Cannot run multiple SparkContexts at once; existing SparkContext(app=pyspark-shell, master=local) created by __init__ at D:\Work\Python\untitled0.py:4

Loading the same data from a csv file involves a small overhead as the schema needs to be defined explicitly. The same output from above should be provided by the following code:

from graphframes import *
from pyspark.context import SparkContext
from pyspark.sql.session import SparkSession
from pyspark.sql.types import * 

#establishing a connection to the Spark cluster (code added)
sc = SparkContext('local').getOrCreate()
spark = SparkSession(sc)

nodes = [
    StructField("id", StringType(), True),
    StructField("name", StringType(), True),
    StructField("age", IntegerType(), True)
]
edges = [
    StructField("src", StringType(), True),
    StructField("dst", StringType(), True),
    StructField("relationship", StringType(), True)
    ]

v = spark.read.csv(r"D:\data\nodes.csv", header=True, schema=StructType(nodes))

e = spark.read.csv(r"D:\data\edges.csv", header=True, schema=StructType(edges))

# Create a GraphFrame
g = GraphFrame(v, e)

g.vertices.show()
g.edges.show()

g.inDegrees.show()
g.outDegrees.show()

#stopping the active context (code added)
sc.stop()

The 'nodes.csv' file has the following content:
id,name,age
"a","Alice",34
"b","Bob",36
"c","Charlie",30
"d","David",29
"e","Esther",32
"f","Fanny",36
"g","Gabby",60

The 'edges.csv' file has the following content:
src,dst,relationship
"a","b","friend"
"b","c","follow"
"c","b","follow"
"f","c","follow"
"e","f","follow"
"e","d","friend"
"d","a","friend"
"a","e","friend"

Note:
There should be no spaces between values (e.g. "a", "b"), otherwise the results might deviate from expectations. 

Now, one can go and test further operations on the graph thus created:

#filtering edges 
gl = g.edges.filter("relationship = 'follow'").sort("src")
gl.show()
print("number edges: ", gl.count())

#filtering vertices
#gl = g.vertices.filter("age >= 30 and age<40").sort("id")
#gl.show()
#print("number vertices: ", gl.count())

# relationships involving edges and vertices
#motifs = g.find("(a)-[e]->(b); (b)-[e2]->(a)")
#motifs.show()

Happy coding!

Python: Installing PySpark and GraphFrames on a Windows 10 Machine

One of the To-Dos for this week was to set up the environment so I can start learning PySpark and GraphFrames based on the examples from Needham & Hodler’s free book on Graph Algorithms. Therefore, I downloaded and installed the Java SDK 8 from the Oracle website (requires an Oracle account) and the latest stable version of Python (Python 3.9.2), downloaded and unzipped the Apache Spark package locally on a Windows 10 machine, respectively the Winutils tool as described here.

The setup requires several environment variables that need to be created, respectively the Path variable needs to be extended with further values (delimited by ";"). In the end I added the following values:

VariableValue
HADOOP_HOMED:\Programs\spark-3.0.2-bin-hadoop2.7
SPARK_HOMED:\Programs\spark-3.0.2-bin-hadoop2.7
JAVA_HOMED:\Programs\Java\jdk1.8.0_281
PYTHONPATHD:\Programs\Python\Python39\
PYTHONPATH;%SPARK_HOME%\python
PYTHONPATH%SPARK_HOME%\python\lib\py4j-0.10.9-src.zip
PATH%HADOOP_HOME%\bin
PATH%SPARK_HOME%\bin
PATH%PYTHONPATH%
PATH%PYTHONPATH%\DLLs
PATH%PYTHONPATH%\Lib
PATH%JAVA_HOME%\bin

I tried then running the first example from Chapter 3 using the Spyder IDE, though the environment didn’t seem to recognize the 'graphframes' library. As long it's not already available, the graphframes .jar file (e.g. graphframes-0.8.1-spark3.0-s_2.12.jar) corresponding to the installed Spark version must be downloaded and copied in the Spark folder where the other .jar files are available (e.g. .\spark-3.0.2-bin-hadoop2.7\jars). With this change I could finally run my example, though it took me several tries to get this right. 

During Python's installation I had to change the value for the LongPathsEnabled setting from 0 to 1 via regedit to allow path lengths longer than 260 characters, as mentioned in the documentation. The setting is available via the following path:
HKEY_LOCAL_MACHINE\SYSTEM\CurrentControlSet\Control\FileSystem

In the process I also tried installing ‘pyspark’ and ‘graphframes’ via the Anaconda tool with the following commands:

pip3 install --user pyspark
pip3 install --user graphframes

From Anaconda’s point of view the installation was correct, fact which pointed me to the missing 'graphframe' library.

It took me 4-5 hours of troubleshooting and searching until I got my environment setup. I still have two more warnings to solve, though I will look into this later:
WARN NativeCodeLoader: Unable to load native-hadoop library for your platform... using builtin-java classes where applicable
WARN ProcfsMetricsGetter: Exception when trying to compute pagesize, as a result reporting of ProcessTree metrics is stopped

Notes:
Spaces in the folder's names might creates issues. Therefore, I used 'Programs' instead of 'Program Files' as main folder. 
There seem to be some confusion what environment variables are needed and how they need to be configured.
Unfortunately, the troubleshooting involved in setting up an environment and getting a simple example to work seems to be a recurring story over the years. Same situation was with the programming languages from 15-20 years ago. 

22 May 2018

Data Science: Recurrent Neural Network (Definitions)

"A neural net with feedback connections, such as a BAM, Hopfield net, Boltzmann machine, or recurrent backpropagation net. In contrast, the signal in a feedforward neural net passes from the input units (through any hidden units) to the output units." (Laurene V Fausett, "Fundamentals of Neural Networks: Architectures, Algorithms, and Applications", 1994)

"A neural network topology where the units are connected so that inputs signals flow back and forth between the neural processing units until the neural network settles down. The outputs are then read from the output units." (Joseph P Bigus, "Data Mining with Neural Networks: Solving Business Problems from Application Development to Decision Support", 1996)

"Networks with feedback connections from neurons in one layer to neurons in a previous layer." (Nikola K Kasabov, "Foundations of Neural Networks, Fuzzy Systems, and Knowledge Engineering", 1996)

"RNN topology involves backward links from output to the input and hidden layers." (Siddhartha Bhattacharjee et al, "Quantum Backpropagation Neural Network Approach for Modeling of Phenol Adsorption from Aqueous Solution by Orange Peel Ash", 2013)

"Neural network whose feedback connections allow signals to circulate within it." (Terrence J Sejnowski, "The Deep Learning Revolution", 2018)

"An RNN is a special kind of neural network used for modeling sequential data." (Alex Thomas, "Natural Language Processing with Spark NLP", 2020)

"A recurrent neural network (RNN) is a class of artificial neural networks where connections between nodes form a directed graph along a temporal sequence. This allows it to exhibit temporal dynamic behavior." (Udit Singhania & B. K. Tripathy, "Text-Based Image Retrieval Using Deep Learning", 2021)

"A RNN [Recurrent Neural Network] models sequential interactions through a hidden state, or memory. It can take up to N inputs and produce up to N outputs. For example, an input sequence may be a sentence with the outputs being the part-of-speech tag for each word (N-to-N). An input could be a sentence, and the output a sentiment classification of the sentence (N-to-1). An input could be a single image, and the output could be a sequence of words corresponding to the description of an image (1-to-N). At each time step, an RNN calculates a new hidden state ('memory') based on the current input and the previous hidden state. The 'recurrent' stems from the facts that at each step the same parameters are used and the network performs the same calculations based on different inputs." (Wild ML)

"Recurrent Neural Network (RNN) refers to a type of artificial neural network used to understand sequential information and predict follow-on probabilities. RNNs are widely used in natural language processing, with applications including language modeling and speech recognition." (Accenture)

04 April 2018

Data Science: Graph (Definitions)

"Informally, a graph is a finite set of dots called vertices (or nodes) connected by links called edges (or arcs). More formally: a simple graph is a (usually finite) set of vertices V and set of unordered pairs of distinct elements of V called edges." (Craig F Smith & H Peter Alesso, "Thinking on the Web: Berners-Lee, Gödel and Turing", 2008)

"A computation object that is used to model relationships among things. A graph is defined by two finite sets: a set of nodes and a set of edges. Each node has a label to identify it and distinguish it from other nodes. Edges in a graph connect exactly two nodes and are denoted by the pair of labels of nodes that are related." (Clay Breshears, "The Art of Concurrency", 2009)

"A graph in mathematics is a set of nodes and a set of edges between pairs of those nodes; the edges are ordered or nonordered pairs, or a relation, that defines the pairs of nodes for which the relation being examined is valid. […] The edges can either be undirected or directed; directed edges depict a relation that requires the nodes to be ordered while an undirected edge defines a relation in which no ordering of the edges is implied." (Dennis M Buede, "The Engineering Design of Systems: Models and methods", 2009)

[undirected graph:] "A graph in which the nodes of an edge are unordered. This implies that the edge can be thought of as a two-way path." (Clay Breshears, "The Art of Concurrency", 2009)

[directed graph:] "A graph whose edges are ordered pairs of nodes; this allows connections between nodes in one direction. When drawn, the edges of a directed graph are commonly shown as arrows to indicate the “direction” of the edge." (Clay Breshears, "The Art of Concurrency", 2009)

"1.Generally, a set of homogeneous nodes (vertices) and edges (arcs) between pairs of nodes." (DAMA International, "The DAMA Dictionary of Data Management", 2011)

[directed acyclic graph:] "A graph that defines a partial order so that nodes can be sorted into a linear sequence with references only going in one direction. A directed acyclic graph has, as its name suggests, directed edges and no cycles." (Michael McCool et al, "Structured Parallel Programming", 2012)

"A data structure that consists of a set of nodes and a set of edges that relate the nodes to each other" (Nell Dale & John Lewis, "Computer Science Illuminated" 6th Ed., 2015)

[directed graph:] "A directed graph is one in which the edges have a specified direction from one vertex to another." (Dan Sullivan, "NoSQL for Mere Mortals", 2015)

[directed graph (digraph):] "A graph in which each edge is directed from one vertex to another (or the same) vertex" (Nell Dale & John Lewis, "Computer Science Illuminated" 6th Ed., 2015)

[undirected graph:] "A graph in which the edges have no direction" (Nell Dale & John Lewis, "Computer Science Illuminated" 6th Ed., 2015)

[undirected graph:] "An undirected graph is one in which the edges do not indicate a direction (such as from-to) between two vertices." (Dan Sullivan, "NoSQL for Mere Mortals®", 2015)

"Like a tree, a graph consists of a set of nodes connected by edges. These edges may or may not have a direction. If they do, the graph is referred to as a 'directed graph'. If a graph is directed, it may be possible to start at a node and follow edges in a path that leads back to the starting node. Such a path is called a 'cycle'. If a directed graph has no cycles, it is referred to as an 'acyclic graph'." (Robert J Glushko, "The Discipline of Organizing: Professional Edition" 4th Ed., 2016)

"In a computer science or mathematics context, a graph is a set of nodes and edges that connect the nodes." (Alex Thomas, "Natural Language Processing with Spark NLP", 2020)

Undirected graph "A graph in which the edges have no direction" (Nell Dale et al, "Object-Oriented Data Structures Using Java" 4th Ed., 2016)

08 March 2018

Data Science: Semantic Network (Definitions)

"We define a semantic network as 'the collection of all the relationships that concepts have to other concepts, to percepts, to procedures, and to motor mechanisms' of the knowledge." (John F Sowa, "Conceptual Structures", 1984)

"A graph for knowledge representation where concepts are represented as nodes in a graph and the binary semantic relations between the concepts are represented by named and directed edges between the nodes. All semantic networks have a declarative graphical representation that can be used either to represent knowledge or to support automated systems for reasoning about knowledge." (László Kovács et al, "Ontology-Based Semantic Models for Databases", 2009)

"A graph structure useful to represent the knowledge of a domain. It is composed of a set of objects, the graph nodes, which represent the concepts of the domain, and relations among such objects, the graph arches, which represent the domain knowledge. The semantic networks are also a reasoning tool as it is possible to find relations among the concepts of a semantic network that do not have a direct relation among them. To this aim, it is enough 'to follow the arrows' of the network arches that exit from the considered nodes and find in which node the paths meet." (Mario Ceresa, "Clinical and Biomolecular Ontologies for E-Health", Handbook of Research on Distributed Medical Informatics and E-Health, 2009)

"A form of visualization consisting of vertices (concepts) and directed or undirected edges (relationships)." (DAMA International, "The DAMA Dictionary of Data Management", 2011)

"A term used in computer language processing and in RF and OWL to refer to concepts linked by relationships. Memory maps are an informal example of a semantic network." (Kate Taylor, "A Common Sense Approach to Interoperability", 2011)

"nodes, encapsulating data and information, are connected by edges which include information about how these nodes are related to one another." (Simon Boese et al, "Semantic Document Networks to Support Concept Retrieval", 2014)

"A knowledge representation technique that represents the relationships among objects" (Nell Dale & John Lewis, "Computer Science Illuminated" 6th Ed., 2015)

"A knowledge base that represents semantic relations between concepts. Formally, the underlying representation model is a directed graph consisting of nodes, which represent concepts, and links, which represent semantic relations between concepts, mapping or connecting semantic fields." (Dmitry Korzun et al, "Semantic Methods for Data Mining in Smart Spaces", 2019)

"A knowledge base that represents semantic relations between concepts in a network. The model of knowledge representation is based on a directed or undirected graph consisting of vertices, which represent concepts, and edges, which represent semantic relations between concepts, mapping or connecting semantic fields." (Svetlana E Yalovitsyna et al, "Smart Museum: Semantic Approach to Generation and Presenting Information of Museum Collections", 2020)

07 July 2013

Knowledge Management: Concept Map (Definitions)

"Concept maps are built of nodes connected by connectors, which have written descriptions called linking phrases instead of polarity of strength. Concept maps can be used to describe conceptual structures and relations in them and the concept maps suit also aggregation and preservation of knowledge" (Hannu Kivijärvi et al, "A Support System for the Strategic Scenario Process", 2008) 

"A hierarchal picture of a mental map of knowledge." (Gregory MacKinnon, "Concept Mapping as a Mediator of Constructivist Learning", 2009)

"A tool that assists learners in the understanding of the relationships of the main idea and its attributes, also used in brainstorming and planning." (Diane L Judd, "Constructing Technology Integrated Activities that Engage Elementary Students in Learning", 2009)

"Concept maps are graphical knowledge representations that are composed to two components: (1) Nodes: represent the concepts, and (2) Links: connect concepts using a relationship." (Faisal Ahmad et al, "New Roles of Digital Libraries", 2009)

"A concept map is a diagram that depicts concepts and their hierarchical relationships." (Wan Ng & Ria Hanewald, "Concept Maps as a Tool for Promoting Online Collaborative Learning in Virtual Teams with Pre-Service Teachers", 2010)

"A diagram that facilitates organization, presentation, processing and acquisition of knowledge by showing relationships among concepts as node-link networks. Ideas in a concept map are represented as nodes and connected to other ideas/nodes through link labels." (Olusola O Adesope & John C Nesbit, "A Systematic Review of Research on Collaborative Learning with Concept Maps", 2010)

"A visual construct composed of encircled concepts (nodes) that are meaningfully inter-connected by descriptive concept links either directly, by branch-points (hierarchies), or indirectly by cross-links (comparisons). The construction of a concept map can serve as a tool for enhancing communication, either between an author and a student for a reading task, or between two or more students engaged in problem solving. (Dawndra Meers-Scott, "Teaching Critical Thinking and Team Based Concept Mapping", 2010)

"Are graphical ways of working with ideas and presenting information. They reveal patterns and relationships and help students to clarify their thinking, and to process, organize and prioritize. The visual representation of information through word webs or diagrams enables learners to see how the ideas are connected and understand how to group or organize information effectively." (Robert Z Zheng & Laura B Dahl, "Using Concept Maps to Enhance Students' Prior Knowledge in Complex Learning", 2010)

"Concept maps are hierarchical trees, in which concepts are connected with labelled, graphical links, most general at the top." (Alexandra Okada, "Eliciting Thinking Skills with Inquiry Maps in CLE", 2010)

"One powerful knowledge presentation format, devised by Novak, to visualize conceptual knowledge as graphs in which the nodes represent the concepts, and the links between the nodes are the relationships between these concepts." (Diana Pérez-Marín et al, "Adaptive Computer Assisted Assessment", 2010)

"A form of visualization showing relationships among concepts as arrows between labeled boxes, usually in a downward branching hierarchy." (DAMA International, "The DAMA Dictionary of Data Management", 2011)

"A graphical depiction of relationships ideas, principals, and activities leading to one major theme." (Carol A Brown, "Using Logic Models for Program Planning in K20 Education", 2013)

"A diagram that presents the relationships between concepts." (Gwo-Jen Hwang, "Mobile Technology-Enhanced Learning", 2015)

"A graphical two-dimensional display of knowledge. Concepts, usually presented within boxes or circles, are connected by directed arcs that encode, as linking phrases, the relationships between the pairs of concepts." (Anna Ursyn, "Visualization as Communication with Graphic Representation", 2015)

"A graphical tool for representing knowledge structure in a form of a graph whose nodes represent concepts, while arcs between nodes correspond to interrelations between them." (Yigal Rosen & Maryam Mosharraf, "Evidence-Centered Concept Map in Computer-Based Assessment of Critical Thinking", 2016) 

"Is a directed graph that shows the relationship between the concepts. It is used to organize and structure knowledge." (Anal Acharya & Devadatta Sinha, "A Web-Based Collaborative Learning System Using Concept Maps: Architecture and Evaluation", 2016)

"A graphic depiction of brainstorming, which starts with a central concept and then includes all related ideas." (Carolyn W Hitchens et al, "Studying Abroad to Inform Teaching in a Diverse Society", 2017)

"A graphic visualization of the connections between ideas in which concepts (drawn as nodes or boxes) are linked by explanatory phrases (on arrows) to form a network of propositions that depict the quality of the mapper’s understanding" (Ian M Kinchin, "Pedagogic Frailty and the Ecology of Teaching at University: A Case of Conceptual Exaptation", 2019)

"A diagram in which related concepts are linked to each other." (Steven Courchesne &Stacy M Cohen, "Using Technology to Promote Student Ownership of Retrieval Practice", 2020)

28 June 2013

Knowledge Management: Cognitive Map (Definitions)

"A cognitive map is a specific way of representing a person's assertions about some limited domain, such as a policy problem. It is designed to capture the structure of the person's causal assertions and to generate the consequences that follow front this structure." (Robert M Axelrod, "Structure of Decision: The cognitive maps of political elites", 1976)

"A cognitive map is the representation of thinking about a problem that follows from the process of mapping." (Colin Eden, "Analyzing cognitive maps to help structure issues or problems", 2002)

"A mental representation of a portion of the physical environment and the relative locations of points within it." (Andrew M Colman, "A Dictionary of Psychology" 3rd Ed, 2008)

"A mental model (or map) of the external environment which may be constructed following exploratory behaviour." (Michael Allaby, "A Dictionary of Zoology" 3rd Ed., 2009)

"An FCM [Fuzzy Cognitive Map] is a directed graph with concepts like policies, events etc. as nodes and causalities as edges. It represents causal relationship between concepts." (Florentin Smarandache &  W B Vasantha Kandasamy, "Fuzzy Cognitive Maps and Neutrosophic Cognitive Maps", 2014)

"A conceptual tool that provides a representation of particular natural or social environments in the form of a model." (Evangelos C Papakitsos et al, "The Challenges of Work-Based Learning via Systemic Modelling in the European Union", 2020)

"A representation of the conceptualization that the subject constructs of the system in which he evolves. The set of cognitive representations that emerge make it possible to understand his actions, the links between the factors structuring the cognitive patterns dictating his behaviors." (Henda E Karray & Souhaila Kammoun, "Strategic Orientation of the Managers of a Tunisian Family Group Before and After the Revolution", 2020)

"A cognitive map is a type of mental representation which serves an individual to acquire, code, store, recall, and decode information about the relative locations and attributes of phenomena in their everyday or metaphorical spatial environment." (Wikipedia) [source]

29 December 2011

Graphical Representation: Line Graphs (Just the Quotes)

"In line charts the grid structure plays a controlling role in interpreting facts. The number of vertical rulings should be sufficient to indicate the frequency of the plottings, facilitate the reading of the time values on the horizontal scale. and indicate the interval or subdivision of time." (Anna C Rogers, "Graphic Charts Handbook", 1961)

"Data should not be forced into an uncomfortable or improper mold. For example, data that is appropriate for line graphs is not usually appropriate for circle charts and in any case not without some arithmetic transformation. Only graphs that are designed to fit the data can be used profitably." (Cecil H Meyers, "Handbook of Basic Graphs: A modern approach", 1970)

"The numerous design possibilities include several varieties of line graphs that are geared to particular types of problems. The design of a graph should be adapted to the type of data being structured. The data might be percentages, index numbers, frequency distributions, probability distributions, rates of change, numbers of dollars, and so on. Consequently, the designer must be prepared to structure his graph accordingly." (Cecil H Meyers, "Handbook of Basic Graphs: A modern approach", 1970)

"While circle charts are not likely to present especially new or creative ideas, they do help the user to visualize relationships. The relationships depicted by circle charts do not tend to be very complex, in contrast to those of some line graphs. Normally, the circle chart is used to portray a common type of relationship (namely. part-to-total) in an attractive manner and to expedite the message transfer from designer to user." (Cecil H Meyers, "Handbook of Basic Graphs: A modern approach", 1970)

"There are several uses for which the line graph is particularly relevant. One is for a series of data covering a long period of time. Another is for comparing several series on the same graph. A third is for emphasizing the movement of data rather than the amount of the data. It also can be used with two scales on the vertical axis, one on the right and another on the left, allowing different series to use different scales, and it can be used to present trends and forecasts." (Anker V Andersen, "Graphing Financial Information: How accountants can use graphs to communicate", 1983)

"In the case of graphs, the number of lines which can be included on any one illustration will depend largely on how close the lines are and how often they cross one another. Three or four is likely to be the maximum acceptable number. In some instances, there may be an argument for using several graphs with one line each as opposed to one graph with multiple lines. It has been shown that these two arrangements are equally satisfactory if the user wishes to read off the value of specific points; if, however, he wishes to compare the lines, than the single multi-line graph is superior." (Linda Reynolds & Doig Simmonds, "Presentation of Data in Science" 4th Ed, 1984)

"A connected graph is appropriate when the time series is smooth, so that perceiving individual values is not important. A vertical line graph is appropriate when it is important to see individual values, when we need to see short-term fluctuations, and when the time series has a large number of values; the use of vertical lines allows us to pack the series tightly along the horizontal axis. The vertical line graph, however, usually works best when the vertical lines emanate from a horizontal line through the center of the data and when there are no long-term trends in the data." (William S Cleveland, "The Elements of Graphing Data", 1985)

"A bar graph typically presents either averages or frequencies. It is relatively simple to present raw data (in the form of dot plots or box plots). Such plots provide much more information. and they are closer to the original data. If the bar graph categories are linked in some way - for example, doses of treatments - then a line graph will be much more informative. Very complicated bar graphs containing adjacent bars are very difficult to grasp. If the bar graph represents frequencies. and the abscissa values can be ordered, then a line graph will be much more informative and will have substantially reduced chart junk." (Gerald van Belle, "Statistical Rules of Thumb", 2002)

"The biggest difference between line graphs and sparklines is that a sparkline is compact with no grid lines. It isnʼt meant to give precise values; rather, it should be considered just like any other word in the sentence. Its general shape acts as another term and lends additional meaning in its context. The driving forces behind these compact sparklines are speed and convenience." (Brian Suda, "A Practical Guide to Designing with Data", 2010)

30 May 2009

DBMS: Simple Protocol and RDF Query Language (Definitions)

"A simple query language for accessing RDF structures. As the majority of the query languages developed within a Web context, SPARQL is based on a strict ‘pattern-matching’ approach, which means that no inference facilities are directly associated with SPARQL. As the majority of the Web query languages, SPARQL makes use of a SQL-like format, employing then operators in the style of SELECT and WHERE." (Gian P Zarri, "RDF and OWL for Knowledge Management", 2011)

"An RDF query language standardized by the World Wide Web Consortium (W3C)." (DAMA International, "The DAMA Dictionary of Data Management", 2011)

"SPARQL is an RDF query language standardized by the World Wide Web Consortium (W3C). The acronym stands for SPARQL Protocol and RDF Query Language." (Michael Fellmann et al, "Supporting Semantic Verification of Process Models", 2012)

"An RDF query language; its name is a recursive acronym that stands for SPARQL Protocol and RDF Query Language." (Mahdi Gueffaz, "ScaleSem Approach to Check and to Query Semantic Graphs", 2015)

"An SQL-like, RDF query language and a recommendation by W3C, developed to manipulate and query the data stored in RDF format." (T R Gopalakrishnan Nair, "Intelligent Knowledge Systems", 2015)

"Is an RDF query language, that is, a semantic query language for databases, able to retrieve and manipulate data stored in Resource Description Framework format." (Fu Zhang et al, "A Review of Answering Queries over Ontologies Based on Databases", 2016)

"Is an RDF query language, that is, a semantic query language for databases, able to retrieve and manipulate data stored in Resource Description Framework format." (Fu Zhang & Haitao Cheng, "A Review of Answering Queries over Ontologies Based on Databases", 2016)

"SPARQL (Simple Protocol and RDF Query Language) is an RDF query language which is a W3C recommendation. SPARQL contains capabilities for querying required and optional graph patterns along with their conjunctions and disjunctions." (Hairong Wang et al, "Fuzzy Querying of RDF with Bipolar Preference Conditions", 2016)

"SPARQL can be used to express queries across diverse data sources, whether the data is stored natively as RDF or viewed as RDF via middleware. SPARQL contains capabilities for querying required and optional graph patterns along with their conjunctions and disjunctions." (Jingwei Cheng et al, "RDF Storage and Querying: A Literature Review", 2016)

"SPARQL (pronounced 'sparkle', a recursive acronym for SPARQL protocol and RDF query language) is an RDF query language, that is, a semantic query language for databases, able to retrieve and manipulate data stored in resource description framework (RDF) format." (Senthil K Narayanasamy & Dinakaran Muruganantham, "Effective Entity Linking and Disambiguation Algorithms for User-Generated Content (UGC)", 2018)

"SPARQL (Simple Protocol and RDF Query Language) is an RDF query language which is a W3C recommendation. SPARQL contains capabilities for querying required and optional graph patterns along with their conjunctions and disjunctions." (Zongmin Ma & Li Yan, "Towards Massive RDF Storage in NoSQL Databases: A Survey", 2019)

"It is a query language on documents described in RDF." (Antonio Sarasa-Cabezuelo & José Luis Fernández-Vindel, "A Model for the Creation of Academic Activities Based on Visits", 2020)

"The SPARQL query language is a structured language for querying RDF data in a declarative fashion. Its core function is subgraph pattern matching, which corresponds to finding all graph homomorphism in the data graph for a query graph." (Kamalendu Pal, "Ontology-Assisted Enterprise Information Systems Integration in Manufacturing Supply Chain", 2020)

"Query language used to access and retrieve RDF data distributed in different geographical locations." (Janneth Chicaiza, "Leveraging Linked Data in Open Education", 2021)

"It is used for querying data in RDF format, in a similar way that SQL is used to query relational databases. SPARQL is a standard created and maintained by the World Wide Web Consortium. SPARQL is useful for getting data out of linked databases as an alternative to a more specific API." (Data.Gov.UK)

"A query language similar to SQL, used for queries to a linked-data triple store." ("Open Data Handbook")

16 March 2009

DBMS: Network Model (Definitions)

[network database model:] "Essentially a refinement of the hierarchical database model. The network model allows child tables to have more than one parent, thus creating a networked-like table structure. Multiple parent tables for each child allow for many-to-many relationships, in addition to one-to-many relationships." (Gavin Powell, "Beginning Database Design", 2006)

[complex network data model:] "A navigational data model that supports direct many-to-many relationships." (Jan L Harrington, "Relational Database Dessign: Clearly Explained" 2nd Ed., 2002)

[simple network data model:] "A navigational data model that supports only one-to-many relationships but allows an entity to have an unlimited number of parent entities." (Jan L Harrington, "Relational Database Dessign: Clearly Explained" 2nd Ed., 2002)

[complex network data model:] "A navigational data model that permits direct many-to-many relationships as well as one-to-many and one-to-one relationships." (Jan L Harrington, "Relational Database Design and Implementation: Clearly explained" 3rd Ed., 2009)

[simple network data model:"A legacy data model where all relationships are one-to-many or one-toone; a navigational data model where relationships are represented with physical data structures such as pointers." (Jan L Harrington, "Relational Database Design and Implementation: Clearly explained" 3rd Ed., 2009)

"A data model standard created by the CODASYL Data Base Task Group in the late 1960s. It represented data as a collection of record types and relationships as predefined sets with an owner record type and a member record type in a 1:M relationship." (Carlos Coronel et al, "Database Systems: Design, Implementation, and Management" 9th Ed., 2011)

"A DBMS architecture where record types are organized in a many-to-many structure consisting of multiple parent-child sets." (George Tillmann, "Usage-Driven Database Design: From Logical Data Modeling through Physical Schmea Definition", 2017)

"A network model is a database model that is designed as a flexible approach to representing objects and their relationships. A unique feature of the network model is its schema, which is viewed as a graph where relationship types are arcs and object types are nodes." (Techopedia) [source]


27 February 2009

DBMS: Graph Database (Definitions)

"Databases that use graph structures with nodes, edges and characteristics to depict and store information." (Swati V Chande, "Cloud Database Systems: NoSQL, NewSQL, and Hybrid", 2014)

"A graph database is any storage system that uses graph structures with nodes and edges, to represent and store data." (Jaroslav Pokorný, "Graph Databases: Their Power and Limitations", 2015)

"Makes use of graph structures with nodes and edges to manage and represent data. Unlike a relational database, a graph database does not rely on joins to connect data sources." (Judith S Hurwitz, "Cognitive Computing and Big Data Analytics", 2015)

"A database type that uses vertices and edges to store information." (Kornelije Rabuzin, "Query Languages for Graph Databases" 2018)

"A graph database is a database that uses graph structures for semantic queries with nodes, edges and properties to represent and store data." (Data Wold)

"A graph database is a type of database where there is no hierarchy - all data is stored as a series of nodes and edges (links between nodes). Typically each node of the graph represents a thing or the value of a property, and each edge represents a property - a particular type of relationship between the two nodes that it joins. This makes it easier to query the database based on relationships and it makes for a very flexible data structure that is easy to alter or extend. Graph databases are very useful for storing datasets that are complex with lots of connections." (Data.Gov.UK)

"Optimized database technology to store, manage, and access inter data to answer complex questions." (Forrester)

"A graph database, also called a graph-oriented database, is a type of NoSQL database that uses graph theory to store, map and query relationships." (The Open Group)

"they use graph structures (a finite set of ordered pairs or certain entities), with edges, properties and nodes for data storage. It provides index-free adjacency, meaning that every element is directly linked to its neighbour element." (Analytics Insight)

29 October 2008

W3: Resource Description Framework (Definitions)

"A framework for constructing logical languages that can work together in the Semantic Web. A way of using XML for data rather than just documents." (Craig F Smith & H Peter Alesso, "Thinking on the Web: Berners-Lee, Gödel and Turing", 2008)

"An application of XML that enables the creation of rich, structured, machinereadable resource descriptions." (J P Getty Trust, "Introduction to Metadata" 2nd Ed., 2008)

"An example of ‘metadata’ language (metadata = data about data) used to describe generic ‘things’ (‘resources’, according to the RDF jargon) on the Web. An RDF document is a list of statements under the form of triples having the classical format: <object, property, value>, where the elements of the triples can be URIs (Universal Resource Identifiers), literals (mainly, free text) and variables. RDF statements are normally written into XML format (the so-called ‘RDF/XML syntax’)." (Gian P Zarri, "RDF and OWL for Knowledge Management", 2011)

"The basic technique for expressing knowledge on The Semantic Web." (DAMA International, "The DAMA Dictionary of Data Management", 2011)

"A graph model for describing formal Web resources and their metadata, to enable automatic processing of such descriptions." (Mahdi Gueffaz, "ScaleSem Approach to Check and to Query Semantic Graphs", 2015)

"Specified by W3C, is a conceptual data modeling framework. It is used to specify content over the World Wide Web, most commonly used by Semantic Web." (T R Gopalakrishnan Nair, "Intelligent Knowledge Systems", 2015)

"Resource Description Framework (RDF) is a framework for expressing information about resources. Resources can be anything, including documents, people, physical objects, and abstract concepts." (Fu Zhang & Haitao Cheng, "A Review of Answering Queries over Ontologies Based on Databases", 2016)

"Resource Description Framework (RDF) is a W3C (World Wide Web Consortium) recommendation which provides a generic mechanism for representing information about resources on the Web." (Hairong Wang et al, "Fuzzy Querying of RDF with Bipolar Preference Conditions", 2016)

"Resource Description Framework (RDF) is a W3C recommendation that provides a generic mechanism for giving machine readable semantics to resources. Resources can be anything we want to talk about on the Web, e.g., a single Web page, a person, a query, and so on." (Jingwei Cheng et al, "RDF Storage and Querying: A Literature Review", 2016)

"The Resource Description Framework (RDF) metamodel is a directed graph, so it identifies one node (the one from which the edge is pointing) as the subject of the triple, and the other node (the one to which the edge is pointing) as its object. The edge is referred to as the predicate of the triple." (Robert J Glushko, "The Discipline of Organizing: Professional Edition" 4th Ed., 2016)

"Resource description framework (RDF) is a family of world wide web consortium (W3C) specifications originally designed as a metadata data model." (Senthil K Narayanasamy & Dinakaran Muruganantham, "Effective Entity Linking and Disambiguation Algorithms for User-Generated Content (UGC)", 2018)

"A framework for representing information on the web." (Sybase, "Open Server Server-Library/C Reference Manual", 2019)

"Resource description framework (RDF) is a W3C (World Wide Web Consortium) recommendation which provides a generic mechanism for representing information about resources on the web." (Zongmin Ma & Li Yan, "Towards Massive RDF Storage in NoSQL Databases: A Survey", 2019)

"It is a language that allows to represent knowledge using triplets of the subject-predicate-object type." (Antonio Sarasa-Cabezuelo & José Luis Fernández-Vindel, "A Model for the Creation of Academic Activities Based on Visits", 2020)

"The RDF is a standard for representing knowledge on the web. It is primarily designed for building the semantic web and has been widely adopted in database and datamining communities. RDF models a fact as a triple which consists of a subject (s), a predicate (p), and an object (o)." (Kamalendu Pal, "Ontology-Assisted Enterprise Information Systems Integration in Manufacturing Supply Chain", 2020)

"It is a language that allows to represent knowledge using triplets of the subject-predicate-object type." (Antonio Sarasa-Cabezuelo, "Creation of Value-Added Services by Retrieving Information From Linked and Open Data Portals", 2021)

"Resource Description Framework, the native way of describing linked data. RDF is not exactly a data format; rather, there are a few equivalent formats in which RDF can be expressed, including an XML-based format. RDF data takes the form of ‘triples’ (each atomic piece of data has three parts, namely a subject, predicate and object), and can be stored in a specialised database called a triple store." ("Open Data Handbook")

21 December 2006

Dyno Lowenstein - Collected Quotes

"A pie graph is a circle that is divided into wedges, like slices of a pie. It is particularly useful when statistics show as a half or a quarter of a total. The human eye can recognize half of a circle much more easily than half a length of a bar." (Dyno Lowenstein, "Graphs", 1976)

"Just like the spoken or written word, statistics and graphs can lie. They can lie by not telling the full story. They can lead to wrong conclusions by omitting some of the important facts. [...] Always look at statistics with a critical eye, and you will not be the victim of misleading information." (Dyno Lowenstein, "Graphs", 1976)

"Learning to make graphs involves two things: (l) the techniques of plotting statistics, which might be called the artist's job; and (2) understanding the statistics. When you know how to work out graphs, all kinds of statistics will probably become more interesting to you." (Dyno Lowenstein, "Graphs", 1976)

 "What you may call a graph, someone else may call a chart, for both terms are used for the same thing. Actually, however. the word 'chart' was originally used only for navigation maps and diagrams. Most people agree that it is best to leave the term '*chart" to the navigators." (Dyno Lowenstein, "Graphs", 1976)
Related Posts Plugin for WordPress, Blogger...

About Me

My photo
IT Professional with more than 24 years experience in IT in the area of full life-cycle of Web/Desktop/Database Applications Development, Software Engineering, Consultancy, Data Management, Data Quality, Data Migrations, Reporting, ERP implementations & support, Team/Project/IT Management, etc.