Showing posts with label datamgmt. Show all posts

15 October 2024

🗄️Data Management: Data Governance (Part III: Taming the Complexity)

Data Management Series

The Chief Data Officer (CDO) or the “Head of the Data Team” is one of the most challenging jobs because is more of a "political" than a technical role. It requires the ideal candidate to be able to throw and catch curved balls almost all the time, and one must be able to play ball with all the parties having an interest in data (aka stakeholders). It’s a full-time job that requires the combination of management and technical skillsets, and both are important! The focus will change occasionally in one direction more than in the other, with important fluctuations. 

Moreover, even if one masters the technical and managerial aspects, the combination of the two gives birth to situations that require further expertise – applied systems thinking being probably the most important. This, also because there are so many points of failure that it's challenging to address all the important causes. Therefore, it’s critical to be a system thinker, to have an experienced team and make use adequately of its experience! 

In a complex word, in which even the smallest constraint or opportunity can have an important impact especially when it’s involved in the early stages of the processes taking place in organizations. It relies on the manager’s and team’s skillset, their inspiration, the way the business reacts to the tasks involved and probably many other aspects that make things work. It takes considerable effort until the whole mechanism works, and even more time to make things work efficiently. The best metaphor is probably the one of a small combat team in which everybody has their place and skillset in the mechanism, independently if one talks about strategy, tactics or operations. 

Unfortunately, building such teams takes time, and the more people are involved, the more complex this endeavor becomes. The manager and the team must meet somewhere in the middle in what concerns the philosophy, the execution of the various endeavors, the way of working together to achieve the same goals. There are multiple forces pulling in all directions and it takes time until one can align the goals, respectively the effort. 

The most challenging forces are the ones between the business and the data team, respectively the business and data requirements, forces that don’t necessarily converge. Working in small organizations, the two parties have in theory more challenges to overcome the challenges and a team’s experience can weight a lot in the process, though as soon the scale changes, the number of challenges to be overcome changes exponentially (there are however different exponential functions in which the basis and exponent make the growth rapid). 

In big organizations can appear other parties that have the same force to pull the weight in one direction or another. Thus, the political aspects become more complex to the degree that the technologies must follow the political decisions, with all the positive and negative implications deriving from this. As comparison, think about the challenges from moving from two to three or more moving bodies orbiting each other, resulting in a chaotic dynamical system for most initial conditions. 

Of course, a business’ context doesn’t have to create such complexity, though when things are unchecked, when delays in decision-making as well as other typical events occur, when there’s no structure, strategy, coordinated effort, or any other important components, the chances for chaotic behavior are quite high with the pass of time. This is just a model to explain real life situations that seem similar on the surface but prove to be quite complex when diving deeper. That’s probably why a CDO’s role as tamer of complexity is important and challenging!

Previous Post <<||>> Next Post

14 September 2024

🗄️Data Management: Data Governance (Part II: Heroes Die Young)

Data Management Series

In the call for action there are tendencies in some organizations to idealize and overcharge main actors' purpose and image when talking about data governance by calling them heroes. Heroes are those people who fight for a goal they believe in with all their being and occasionally they pay the supreme tribute. Of course, the image of heroes is idealized and many other aspects are ignored, though such images sell ideas and ideals. Organizations might need heroes and heroic deeds to change the status quo, but the heroism doesn't necessarily payoff for the "heroes"! 

Sometimes, organizations need a considerable effort to change the status quo. It can be people's resistance to new, to the demands, to the ideas propagated, especially when they are not clearly explained and executed. It can be the incommensurable distance between the "AS IS" and the "TO BE" perspectives, especially when clear paths aren't in sight. It can be the lack of resources (e.g., time, money, people, tools), knowledge, understanding or skillset that makes the effort difficult. 

Unfortunately, such initiatives favor action over adequate strategies, planning and understanding of the overall context. The call do to something creates waves of actions and reactions which in the organizational context can lead to storms and even extreme behavior that ranges from resistance to the new to heroic deeds. Finding a few messages that support the call for action can help, though they can't replace the various critical for success factors.

Leading organizations on a new path requires a well-defined realistic strategy, respectively adequate tactical and operational planning that reflects organizations' specific needs, knowledge and capabilities. Just demanding from people to do their best is not enough, and heroism has chances to appear especially in this context. Unfortunately, the whole weight falls on the shoulders of the people chosen as actors in the fight. Ideally, it should be possible to spread the whole weight on a broader basis which should be considered the foundation for the new. 

The "heroes" metaphor is idealized and the negative outcome probably exaggerated, though extreme situations do occur in organizations when decisions, planning, execution and expectations are far from ideal. Ideal situations are met only in books and less in practice!

The management demands and the people execute, much like in the army, though by contrast people need to understand the reasoning behind what they are doing. Proper execution requires skillset, understanding, training, support, tools and the right resources for the right job. Just relying on people's professionalism and effort is not enough and is suboptimal, but this is what many organizations seem to do!

Organizations tend to respond to the various barriers or challenges with more resources or pressure instead of analyzing and depicting the situation adequately, and eventually change the strategy, tactics or operations accordingly. It's also difficult to do this as long an organization doesn't have the capabilities and practices of self-check, self-introspection, self-reflection, etc. Even if it sounds a bit exaggerated, an organization must know itself to overcome the various challenges. Regular meetings, KPIs and other metrics give the illusion of control when self-control is needed. 

Things don't have to be that complex even if managing data governance is a complex endeavor. Small or midsized organizations are in theory more capable to handle complexity because they can be more agile, have a robust structure and the flow of information and knowledge has less barriers, respectively a shorter distance to overcome, at least in theory. One can probably appeal to the laws and characteristics of networks to understand more about the deeper implications, of how solutions can be implemented in more complex setups.

🗄️Data Management: Data Culture (Part V: Quid nunc? [What now?])

Data Management Series

Despite the detailed planning, the concentrated and well-directed effort with which the various aspects of data culture are addressed, things don't necessarily turn into what we want them to be. There's seldom only one cause but a mix of various factors that create a network of cause and effect relationships that tend to diminish or increase the effect of certain events or decisions, and it can be just a butterfly's flutter that stirs a set of chained reactions. The butterfly effect is usually an exaggeration until the proper conditions for the chaotic behavior appear!

The butterfly effect is made possible by the exponential divergence of two paths. Conversely, success needs probably multiple trajectories to converge toward a final point or intermediary points or areas from which things move on the "right" path. Success doesn't necessarily mean reaching a point but reaching a favorable zone for future behavior to follow a positive trend. For example, a sink or a cone-like structure allow water to accumulate and flow toward an area. A similar structure is needed for success to converge, and the structure results from what is built in the process. 

Data culture needs a similar structure for the various points of interest to converge. Things don't happen by themselves unless the force of the overall structure is so strong that allows things to move toward the intended path(s). Even then the paths can be far from optimal, but they can be favorable. Probably, that's what the general effort must do - bring the various aspects in the zone for allowing things to unfold. It might still be a long road, though the basis is there!

A consequence of this metaphor is that one must identify the important aspects, respectively factors that influence an organization's culture and drive them in the right direction(s) – the paths that converge toward the defined goal(s). (Depending on the area of focus one can consider that there are successions of more refined goals.)

The structure that allows things to converge is based on the alignment of the various paths and implicitly forces. Misalignment can make a force move in other direction with all the consequences deriving from this behavior. If its force is weak, probably will not have an impact over the overall structure, though that's relative and can change in time. 

One may ask for what's needed all this construct, even if it doesn’t reflect the reality. Sometimes, even a not entirely correct model can allow us to navigate the unknown. Model's intent is to depict what's needed for a initiative to be successful. Moreover, success doesn’t mean to shoot bulls eye but to be first in the zone until one's skillset enables performance.

Conversely, it's important to understand that things don't happen by themselves. At least this seems to be the feeling some initiatives let. One needs to build and pull the whole structure in the right direction and the alignment of the various forces can reduce the overall effort and increase the chances for success. Attempting to build something just because it’s written in documentation without understanding the whole picture (or something close to it) can easily lead to failure.

This doesn’t mean that all attempts that don’t follow a set of patterns are doomed to failure, but that the road will be more challenging and will probably take longer. Conversely, maybe these deviations from the optimal paths are what an organization needs to grow, to solidify the foundation on which something else can be built. The whole path is an exploration that doesn’t necessarily match what is written in books, respectively the expectations!

Previous Post <<||>> Next Post

11 September 2024

🗄️Data Management: Data Culture (Part IV: Quo vadis? [Where are you going?])

Data Management Series

The people working for many years in the fields of BI/Data Analytics, Data and Process Management probably met many reactions that at the first sight seem funny, though they reflect bigger issues existing in organizations: people don’t always understand the data they work with, how data are brought together as part of the processes they support, respectively how data can be used to manage and optimize the respective processes. Moreover, occasionally people torture the data until it confesses something that doesn’t necessarily reflect the reality. It’s even more deplorable when the conclusions are used for decision-making, managing or optimizing the process. In extremis, the result is an iterative process that creates more and bigger issues than whose it was supposed to solve!

Behind each blunder there are probably bigger understanding issues that need to be addressed. Many of the issues revolve around understanding how data are created, how are brought together, how the processes work and what data they need, use and generate. Moreover, few business and IT people look at the full lifecycle of data and try to optimize it, or they optimize it in the wrong direction. Data Management is supposed to help, and it does this occasionally, though a methodology, its processes and practices are as good as people’s understanding about data and its use! No matter how good a data methodology is, it’s as weak as the weakest link in its use, and typically the issues revolving around data and data understanding are the weakest link. 

Besides technical people, few businesspeople understand the full extent of managing data and its lifecycle. Unfortunately, even if some of the topics are treated in the books, they are too dry, need hands on experience and some thought in corroborating practices with theories. Without this, people will do things mechanically, processes being as good as the people using them, their value becoming suboptimal and hinder the business. That’s why training on Data Management is not enough without some hands-on experience!

The most important impact is however in BI/Data Analytics areas - how the various artifacts are created and used as support in decision-making, process optimization and other activities rooted in data. Ideally, some KPIs and other metrics should be enough for managing and directing a business, however just basing the decisions on a set of KPIs without understanding the bigger picture, without having a feeling of the data and their quality, the whole architecture, no matter how splendid, can breakdown as sandcastle on a shore meeting the first powerful wave!

Sometimes it feels like organizations do things from inertia, driven by the forces of the moment, initiatives and business issues for which temporary and later permanent solutions are needed. The best chance for solving many of the issues would have been a long time ago, when the issues were still small to create any powerful waves within the organizations. Therefore, a lot of effort is sometimes spent in solving the consequences of decisions not made at the right time, and that can be painful and costly!

For building a good business one needs also a solid foundation. In the past it was enough to have a good set of products that are profitable. However, during the past decade(s) the rules of the game changed driven by the acerb competition across geographies, inefficiencies, especially in the data and process areas, costing organizations on the short and long term. Data Management in general and Data Quality in particular, even if they’re challenging to quantify, have the power to address by design many of the issues existing in organizations, if given the right chance!

Previous Post <<||>> Next Post

02 September 2024

🗄️Data Management: Data Culture (Part III: A Tale of Two Cities)


One of the curious things is that as part of their change of culture organizations try to adopt a new language, to give new names to things, try to make distinction between the "AS IS" and "TO BE" states, insisting how the new image will replace the previous one. Occasionally, they even stress how bad things were in the past and how great will be in the future, trying to depict the future in vivid images. 

Even if this might work occasionally, it tends to confuse people and this not necessarily because of the language and the metaphors used, or the fact that same people were in the same positions, but the lack of belief or conviction, respectively half-hearted enthusiasm personified by the parties. To "convert" people to new philosophies one needs to believe in them or mimic that in similar terms. The lack of conviction can easily have a false effect that spreads within the organization. 

Dissociation from the past, from what an organization was, tends to increase the resistance against the new because two different images are involved. On one side there’s the attachment to the past, and even if there were mistakes made, or things didn’t go optimally, the experiences and decisions made are part of the organization, of the people who made them. People as individuals and as an organization should embrace their mistakes and good deeds altogether, learn from them, improve what is to improve and move forward. Conversely, there’s the resistance to the new, to the change, words they don’t believe in yet, the bigger picture is still fuzzy in their minds, and there can be many other reasons that don’t agree with one’s understanding. 

There are images, memories, views, decisions, objectives of the past and people need to recognize the road from what it was to what should be. One can hypothesize that embracing one’s mistake and understanding, the chain of reasoning from then and from now will help an organization transition towards the new. Awareness of one’s situation most probably will help in the transition process. Unfortunately, leaders and technology gurus tend to depict the past as negative, creating thus more negative emotions, respectively reactions in the process. The past is still part of the people, of the organization and will continue to be.

Conversely, the disassociation from the past can create more resistance to the new, and probably more unnecessary barriers. Probably, it’s easier for the gurus to build the new if the past weren’t there! Forgetting the past would be an error because there are many lessons that can be still useful. All the experience needs to be redirected in new directions. It’s more important to help people see the vision of the future, understand their missions, the paths to be followed and the challenges ahead, . 

It sounds more of a rambling from a psychology course, though organizations do have an image they want to change, to bring forth to cope with the various challenges, an image they want to reflect when needed. There are also organizations that want to change but keep their image intact, which leads to deeper conflicts. Unfortunately, changes of image involve conflicts that can become complex from what they bring forth.  

A data culture should increase people’s awareness of the present, respectively of the future, of what it takes to bridge the gap, the challenges ahead, how to embrace change, how to keep a realistic perspective, how to do a reality check, etc. Methodologies can increase people’s awareness and provide the theoretical basis, though walking the path will be a different story for everyone. 

01 September 2024

🗄️Data Management: Data Governance (Part I: No Guild of Heroes)

Data Management Series

Data governance appeared around 1980s as topic though it gained popularity in early 2000s [1]. Twenty years later, organizations still miss the mark, respectively fail to understand and implement it in a consistent manner. As usual, the reasons for failure are multiple and they vary from misunderstanding what governance is all about to poor implementation of methodologies and inadequate management or leadership. 

Moreover, methodologies tend to idealize the various aspects and is not what organizations need, but pragmatism. For example, data governance is not about heroes and heroism [2], which can give the impression that heroic actions are involved and is not the case! Actions for the sake of action don’t necessarily lead to change by themselves. Organizations are in general good at creating meaningless action without results, especially when people preoccupy themselves, miss or ignore the mark. Big organizations are very good at generating actions without effects. 

People do talk to each other, though they try to solve their own problems and optimize their own areas without necessarily thinking about the bigger picture. The problem is not necessarily communication or the lack of depth into business issues, people do communicate, know the issues without a business impact assessment. The challenge is usually in convincing the upper management that the effort needs to be consolidated, supported, respectively the needed resources made available. 

Probably, one of the issues with data governance is the attempt of creating another structure in the organization focused on quality, which has the chances to fail, and unfortunately does fail. Many issues appear when the structure gains weight and it becomes a separate entity instead of being the backbone of organizations. 

As soon organizations separate the data governance from the key users, management and the other important decisional people in the organization, it takes a life of its own that has the chances to diverge from the initial construct. Then, organizations need "alignment" and probably other big words to coordinate the effort. Also such constructs can work but they are suboptimal because the forces will always pull in different directions.

Making each manager and the upper management responsible for governance is probably the way to go, though they’ll need the time for it. In theory, this can be achieved when many of the issues are solved at the lower level, when automation and further aspects allow them to supervise things, rather than hiding behind every issue. 

When too much mircomanagement is involved, people tend to busy themselves with topics rather than solve the issues they are confronted with. The actual actors need to be empowered to take decisions and optimize their work when needed. Kaizen, the philosophy of continuous improvement, proved itself that it works when applied correctly. They’ll need the knowledge, skills, time and support to do it though. One of the dangers is however that this becomes a full-time responsibility, which tends to create a separate entity again.

The challenge for organizations lies probably in the friction between where they are and what they must do to move forward toward the various objectives. Moving in small rapid steps is probably the way to go, though each person must be aware when something doesn’t work as expected and react. That’s probably the most important aspect. 

So, the more functions are created that diverge from the actual organization, the higher the chances for failure. Unfortunately, failure is visible in the later phases, and thus self-awareness, self-control and other similar “qualities” are needed, like small actors that keep the system in check and react whenever is needed. Ideally, the employees are the best resources to react whenever something doesn’t work as per design. 

Previous Post <<||>> Next Post 

Resources:
[1] Wikipedia (2023) Data Management [link]
[2] Tiankai Feng (2023) How to Turn Your Data Team Into Governance Heroes [link]


20 March 2024

🗄️Data Management: Master Data Management (Part I: Understanding Integration Challenges) [Answer]

Data Management
Data Management Series

Answering Piethein Strengholt’s post [1] on Master Data Management’s (MDM) integration challenges, the author of "Data Management at Scale".

Master data can be managed within individual domains though the boundaries must be clearly defined, and some coordination is needed. Attempting to partition the entities based on domains doesn’t always work. The partition needs to be performed at attribute level, though even then might be some exceptions involved (e.g. some Products are only for Finance to use). One can identify then attributes inside of the system to create the boundaries.

MDM is simple if you have the right systems, processes, procedures, roles, and data culture in place. Unfortunately, people make it too complicated – oh, we need a nice shiny system for managing the data before they are entered in ERP or other systems, we need a system for storing and maintaining the metadata, and another system for managing the policies, and the story goes on. The lack of systems is given as reason why people make no progress. Moreover, people will want to integrate the systems, increasing the overall complexity of the ecosystem.

The data should be cleaned in the source systems and assessed against the same. If that's not possible, then you have the wrong system! A set of well-built reports can make data assessment possible. 

The metadata and policies can be maintained in Excel (and stored in SharePoint), SharePoint or a similar system that supports versioning. Also, for other topics can be found pragmatic solutions.

ERP systems allow us to define workflows and enable a master data record to be published only when the information is complete, though there will always be exceptions (e.g., a Purchase Order must be sent today). Such exceptions make people circumvent the MDM systems with all the issues deriving from this.

Adding an MDM system within an architecture tends to increase the complexity of the overall infrastructure and create more bottlenecks. Occasionally, it just replicates the structures existing in the target system(s).

Integrations are supposed to reduce the effort, though in the past 20 years I never saw an integration to work without issues, even in what MDM concerns. One of the main issues is that the solutions just synchronized the data without considering the processual dependencies, and sometimes also the referential dependencies. The time needed for troubleshooting the integrations can easily exceed the time for importing the data manually over an upload mechanism.

To make the integration work the MDM will arrive to duplicate the all the validation available in the target system(s). This can make sense when daily or weekly a considerable volume of master data is created. Native connectors simplify the integrations, especially when it can handle the errors transparently and allow to modify the records manually, though the issues start as soon the target system is extended with more attributes or other structures.

If an organization has an MDM system, then all the master data should come from the MDM. As soon as a bidirectional synchronization is used (and other integrations might require this), Pandora’s box is open. One can define hard rules, though again, there are always exceptions in which manual interference is needed.

Attempting an integration of reference data is not recommended. ERP systems can have hundreds of such entities. Some organizations tend to have a golden system (a copy of production) with all the reference data. It works for some time, until people realize that the solution is expensive and time-consuming.

MDM systems do make sense in certain scenarios, though to get the integrations right can involve a considerable effort and certain assumptions and requirements must be met.

Previous Post <<||>> Next Post

References:
[1] Piethein Strengholt (2023) Understanding Master Data Management’s Integration Challenges (link)


03 March 2023

🧊Data Warehousing: Architecture (Part IV: Building a Modern Data Warehouse with Azure Synapse)

Data Warehousing

Introduction

When building a data warehouse (DWH) several key words or derivatives of them appear in requirements: secure, flexible, simple, scalable, reliable, performant, non-redundant, modern, automated, real-timed, etc. As it proves in practice, all these requirements are sometimes challenging to address with the increased complexity of the architecture chosen. There are so many technologies on the DWH market promising all these at low costs, low effort and high ROI, though DWH projects continue to fail addressing the business and technical requirements.

On a basic level for building a DWH is needed a data storage layer and an ETL (Extract, Transfer, Load) tool responsible for the data movement between the various source systems and DWH, and eventually within the DWH itself. After that, each technology added to the landscape tends to increase the overall complexity (and should be regarded with a critical eye in what concerns the advantages and disadvantages).

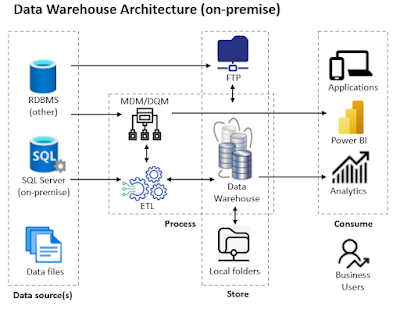
Data Warehouse Architecture (on-premise)

A Reference Architecture

When building a DWH or a data migration solution, which has many of the characteristics of a DWH, from the many designs, I prefer to keep things as simple as possible.  An approach based on a performant database engine like SQL Server as storage layer and SSIS (SQL Server Integration Services) as ETL proved to be the best choice until now, allowing to address most of the technical requirements by design. Then come the choices on how and where to import and transform the data, at what level of granularity, on how the semantic layer is built, how the data are accessed, etc.

Being able to pull (see extract subprocess) the data from the data sources on a need by basis offers the most flexible approach, however there are cases in which the direct access to source data is not possible, having to rely on a push approach, where data are dumped regularly to a given location (e.g. FTP folder structure), following to be picked up as needed. It's actually a hybrid between a push and pull, because a fully push approach would mean pushing the data directly to the DWH, which can be also acceptable, though might offer lower control on data's movement and involve a few other challenges (e.g. permissions, concurrency). 

Data can be prepared for the DWH in the source systems (e.g. exposed via data objects or API calls), anywhere in between via ETL-based transformations (see transform subprocess) or directly in the DWH. I prefer importing the data (see load subprocess) 1:1 without any transformations from the various sources via SSIS (or similar technologies) into a set of tables that designated the staging area. It's true that in this way the ETL technology is used to a minimum, though unless there's a major benefit to use it for data transformations, using DWH's capabilities and SQL for data processing can provide better performance and flexibility

Besides the selection of the columns in scope (typically columns with meaningful values), it's important not to do any transformations in the extraction layer because the data is imported faster (eventually using fast load options as in SSIS) and it assures a basis for troubleshooting (as the data don't change between loads). Some filters can be applied only when the volume of data is high, and the subset of the data could be identified clearly (e.g. when data are partitioned based on a key like business unit, legal entity or creation date).

For better traceability, the staging schemas can reflect the systems they come from, the tables and the columns should have the same names, respectively same data types. On such tables no constraints are applied and no indexes are needed. They can be constructed however on the production tables (aka base tables) - copy of the tables from production. 

Some DWH architects try replicating the constraints from the source systems and/or add more constraints on top to define the various business rules. Rigor is good in some scenarios, though it can involve a considerable effort and it might be challenging to keep over time, especially when considering the impact of big data on DWH architectures. Instead of using constraints, building a set of SQL scripts that pinpoint the issues as reports allow more flexibility with the risk of having inconsistencies running wild through the reports. The data should be cleaned in the source system and not possible then properly addressed in the DWH. Applying constraints will make the data unavailable for reporting until data are corrected, while being more permissive would allow dirty data. Thus, either case has advantages or disadvantages, though the latter seems to be more appropriate. 

Indexes on the production schema should reflect the characteristics of the queries run on the data and shouldn't replicate the indexes from the source environments, even if some overlaps might exist. In practice, dropping the non-clustered indexes on the production tables before loading the data from staging, and recreating them afterwards proves to provide faster loading (see load optimization techniques). 

The production tables are used for building a "semantic" data model or something similar. Several levels of views, table-valued functions and/or indexed/materialized views allows building the dimensions and facts tables, the latter incorporating the business logic needed by the reports. Upon case, stored-procedures, physical or temporary tables, table variables can be used to prepare the data, though they tend to break the "free" flow of data as steps in-between need to be run. On the other side, in certain scenarios their use is unavoidable. 

The first level of views (aka base views) is based on the base tables without any joins, though they include only the fields in use (needed by the business) ordered and "grouped" together based on their importance or certain characteristics. The views can include conversions of data types, translations of codes into meaningful values, and quite seldom filters on the data. Based on these "base" views the second level is built, which attempts to define the dimension and fact tables at the lowest granularity. These views include joins between tables coming from the same or different systems, respectively mappings of values defined in tables, and whatever it takes to build such entities. However, transformations on individual fields are pushed, when possible, to the lower level to minimize logic redundancy. From similar reasons, the logic could be broken down over two or more "helper" views when visible benefits could be obtained from it (e.g troubleshooting, reuse, maintenance). It's important to balance between creating too many helper views and encapsulating too much logic in a view. 

One of the design principles used in building the entities is to minimize the redundance of the fields used, ideally without having columns duplicated between entities at this level. This would facilitate the traceability of columns to the source tables within the "semantic" layer (typically in the detriment of a few more joins). In practice, one is forced to replicate some columns to simplify some parts of the logic. 

Further views can be built based on the dimension and fact entities to define the logic needed by the reports. Only these objects are used and no direct reference to the "base" tables or views are made. Moreover, to offer better performance when the views can be materialized or, when there's an important benefit, physically saved as table (e.g. having multiple indexes for different scenarios). It's the case of entities with considerable data volume called over and over. 

This approach of building the entities is usually flexible enough to address most of the reporting requirements, independently whether the technical solution has the characteristics of a DWH, data mart or data migration layer. Moreover, the overall architectural approach can be used on-premise as well in cloud architectures, where Azure SQL Server and ADF (Azure Data Factory) provide similar capabilities. Compared with standard SQL Server, some features might not be available, while other features might bring further benefits, though the gaps should be neglectable.

Data Management topics like Master Data Management (MDM), Data Quality Management (DQM) and/or Metadata Management can be addressed as well by using third-party tools or tools from the Microsoft stack - Master Data Services (MDS) and Data Quality Services (DQS) in combination with SSIS help addressing a wide range of scenarios - however these are optional. 

Moving to the Cloud

Within the context of big data, characterized by (high/variable) volume, value, variety, velocity, veracity, and further less important V's, the before technical requirements still apply, however within a cloud environment the overall architecture becomes more complex. Each component becomes a service. There are thus various services for data ingestion, storage, processing, sharing, collaboration, etc. The way data are processed involves also several important transformations: ETL becomes ELT, FTP and local storage by Data Lakes, data packages by data pipelines, stateful by stateless, SMP (Symmetric Multi-Processing) by MPP (Massive Parallel Processing), and so on.

As file storage is less expensive than database storage, there's an increasing trend of dumping business critical data into the Data Lake via data pipelines or features like Link to Data Lake or Export to Data Lake (*), which synchronize the data between source systems and Data Lake in near real-time at table or entity level. Either saved as csv, parquet, delta lake or any other standard file format, in single files or partitions, the data can be used directly or indirectly for analytics.

Cloud-native warehouses allow addressing topics like scalability, elasticity, fault-tolerance and performance by design, though further challenges appear as compute needs to be decoupled from storage, the workloads need to be estimated for assuring the performance, data may be distributed across data centers spanning geographies, the infrastructure is exposed to attacks, etc. 

Azure Synapse

If one wants to take advantage of the MPP architecture's power, Microsoft provides an analytical architecture based on Azure Synapse, an analytics service that brings together data integration, enterprise DWH, and big data analytics. Besides two types of SQL-based data processing services  (dedicated vs serverless SQL pools) it comes also with a Spark pool for in-memory cluster computing.

A DWH based on Azure Synapse is not that different from the reference architecture described above for an on-premise solution. Actually, a DWH based on a dedicated SQL pool (aka a physical data warehouse) involves the same steps mentioned above. 
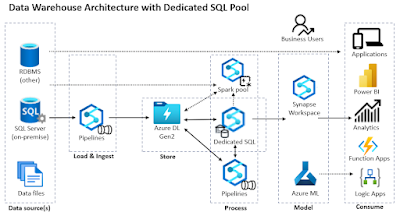
Data Warehouse Architecture with Dedicated SQL Pool

The data can be imported via ETL/ELT pipelines in the DWH, though there are also mechanisms for consuming the data directly from the files stored in the Data Lake or Azure storage. CETAS (aka Create External Table as Select) can be defined on top of the data files, the external tables acting as "staging" or "base" tables in the architecture described above. When using a dedicated SQL pool it makes sense to use the CETAS as "staging" tables, the processed data following to be dumped to "optimized" physical tables for consumption and refreshed periodically. However, when this happens the near real-time character of data is lost. Using the CETAs as base tables would keep this characteristic as long the data isn't saved physically in tables or files, maybe in the detriment of performance.

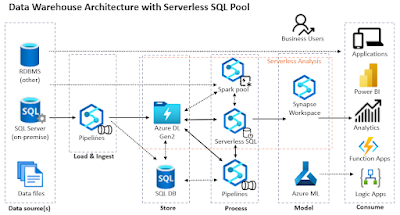
Using a dedicated SQL pool for direct reporting can become expensive as the pool needs to be available at least during business hours for incoming user requests, or at least for importing the data and refreshing the datasets. When using the CETAS as a base table, a serverless (aka on-demand) SQL pool, which uses a per-pay-use billing model could prove to be more cost-effective and flexible in many scenarios. By design, it helps to keep the near real-time character of the data. Moreover, even if the data are actually moved from the source tables into the Data Lake, this architecture has the characteristics of a logical data warehouse:

Data Warehouse Architecture with Serverless SQL Pool

Unfortunately, unless one uses Spark tables, misuses views or adds an Azure SQL database to the architecture, there are no physical tables or materialized views in a serverless SQL pool. There's still the option to use data pipelines for regullarly exporting intermediary data to files (incl. over partitions or folders), even if this involves more overhead as it's not possible to export data over SQL syntax to files more than once (though this might change in the future). For certain scenario it could be useful to store data in a Azure SQL Server or similar database, including a dedicated SQL pool. 

Choosing between serverless and dedicated SQL pool is not an exclusive choice, both or all 3 types of pools (if we consider also the Spark pool) can be used in the architecture for addressing specific challenges, especially when we consider that there are important differences between the features available in each of the pools. Moreover, one can start the PoC based on the serverless SQL pool and when the solution became mature enough and used in all enterprise, parts of the logic or all of it can be migrated to a dedicated SQL pool. This would allow to save costs at the beginning in the detriment of further effort later. 

Talking about the physical storage, data engineers recommend defining within a Data Lake several layers (aka regions, zones) labeled as bronze, silver and gold (and probably platinum will join the club anytime soon). The bronze layer refers to the raw data available in the Data Lake, including the files on which the initial CETAS are defined upon. The silver refers to transformed, cleaned, enriched and integrated data, data resulting from the second layer of views described above. The gold layer refers to the data to which business logic was applied and prepared for consumption, data resulting from the final layer of views. Of course, data pipelines can be used to prepare the data at these stages, though a view-based approach offers more flexibility, are easier to troubleshoot, manage and reuse than data pipelines.

Ideally the gold data should involve no or minimal further transformation before reaching the users, though that's not realistic. Building a DWH takes a considerable time and the business can't usually wait until everything is in place. Therefore, reports based on DWH will continue to coexist with reports directly accessing the source data, which will lead to controversies. Enforcing a single source of truth will help to minimize the gap, though will not eliminate it completely. 

Closing Notes

These are just outlines of a minimal reference architecture. There's more to consider, as there are several alternatives (see [1] [2] [3] [4]) for each of the steps considered in here, each technology, new features or mechanisms opening new opportunities. The advantages and disadvantages should be always considered against the business needs and requirements. One approach, even if recommended, might not work for all, though unless there's an important requirement or an opportunity associated with an additional technology, deviating from reference architectures might not be such a good idea afterall.

Note:
(*) Existing customers have until 1-Nov-2024 to transition from Export to Data lake to Synapse link. Microsoft advises new customers to use Synapse Link. 


Resources:
[1] Microsoft Learn (2022) Modern data warehouse for small and medium business (link)
[2] Microsoft Learn (2022) Data warehousing and analytics (link)
[3] Microsoft Learn (2022) Enterprise business intelligence (link)
[4] Microsoft Learn (2022) Serverless Modern Data Warehouse Sample using Azure Synapse Analytics and Power BI (link)
[5] Coursera (2023) Data Warehousing with Microsoft Azure Synapse Analytics (link) [course, free to audit]
[6] SQLBits (2020) Mahesh Balija's Building Modern Data Warehouse with Azure Synapse Analytics (link)
[7] Matt How (2020) The Modern Data Warehouse in Azure: Building with Speed and Agility on Microsoft’s Cloud Platform (Amazon)
[8] James Serra's blog (2022) Data lake architecture (link)
[9] SQL Stijn (2022) SQL Building a Modern Lakehouse Data Warehouse with Azure Synapse Analytics: Moving your Database to the lake (link)
[10] Solliance (2022) Azure Synapse Analytics Workshop 400 (link) [GitHub repository]

03 January 2020

🗄️Data Management: Data Literacy (Part I: A Second Language)

Data Management

At the Gartner Data & Analytics Summit that took place in 2018 in Grapevine, Texas, it was reiterated the importance of data literacy for taking advantage of the emergence of data analytics, artificial intelligence (AI) and machine learning (ML) technologies. Gartner expected then that by 2020, 80% of organizations will initiate deliberate competency development in the field of data literacy [1] – or how they put it – learning to ‘speak data’ as a ‘second language’.

Data literacy is typically defined as the ability to read, work with, analyze, and argue with data. Sure, these form the blocks of data literacy, though what I’m missing from this definition is the ability to understand the data, even if understanding should be the outcome of reading, and the ability to put data into the context of business problems, even if the analyzes of data could involve this later aspect too.

Understanding has several aspects: understanding the data structures available within an organization, understanding the problems with data (including quality, governance, privacy and security), respectively understanding how the data are linked to the business processes. These aspects go beyond the simple ability included in the above definition, which from my perspective doesn’t include the particularities of an organization (data structure, data quality and processes) – the business component. This is reflected in one of the problems often met in the BI/data analytics industry – the solutions developed by the various service providers don’t reflect organizations’ needs, one of the causes being the inability to understand the business on segments or holistically.  

Putting data into context means being able to use the respective data in answering stringent business problems. A business problem needs to be first correctly defined and this requires a deep understanding of the business. Then one needs to identify the data that could help finding the answers to the problem, respectively of building one or more models that would allow elaborating further theories and performing further simulations. This is an ongoing process in which the models built are further enhanced, when possible, or replaced by better ones.

Probably the comparison with a second language is only partially true. One can learn a second language and argue in the respective language, though it doesn’t mean that the argumentations will be correct or constructive as long the person can’t do the same in the native language. Moreover, one can have such abilities in the native or a secondary language, but not be able do the same in what concerns the data, as different skillsets are involved. This aspect can make quite a difference in a business scenario. One must be able also to philosophize, think critically, as well to understand the forms of communication and their rules in respect to data.

To philosophize means being able to understand the causality and further relations existing within the business and think critically about them. Being able to communicate means more than being able to argue – it means being able to use effectively the communication tools – communication channels, as well the methods of representing data, information and knowledge. In extremis one might even go beyond the basic statistical tools, stepping thus in what statistical literacy is about. In fact, the difference between the two types of literacy became thinner, the difference residing in the accent put on their specific aspects.

These are the areas which probably many professionals lack. Data literacy should be the aim, however this takes time and is a continuous iterative process that can take years to reach maturity. It’s important for organizations to start addressing these aspects, progress in small increments and learn from the experience accumulated.

Previous Post <<||>> Next Post

References:
[1] Gartner (2018) How data and analytics leaders learn to master information as a second language, by Christy Pettey (link

29 April 2019

🗄️Data Management: Data Integration (Part I: From Disintegration to Integration)

Data Management
Data Management Series

No matter how tight the integration between the various systems or processes there will be always gaps that need to be addressed in one way or another. The problems are in general caused by design errors rooted in the complexity of the logic from the integration layer or from the systems integrated. The errors can range from missing or incorrect validation rules, mappings and parameters to data quality issues.

A unidirectional integration involves distributing data from one system (aka publisher) to one or more systems (aka subscribers), while in bidirectional integrations systems can act as publishers and subscribers, resulting thus complex data flows with multiple endpoints. In simplest integrations the records flow one-to-one between systems, though more complex scenarios can involve logic based on business rules, mappings and other type of transformations. The challenge is to reflect the states as needed by the system with minimal involvement from the users.

Typically, it falls in application/process owners or key users’ responsibilities to make sure that the integration works smoothly. When the integration makes use of interface or staging tables they can be used as starting point for the troubleshooting, however even then the troubleshooting can be troublesome and involve a considerable manual effort. When possible the data can be exported manually from the various systems and matched in Excel or similar solutions. This leads often to personal or departmental solutions hard to maintain, control and support.

A better approach is to automatize the process by importing the data from the integrated systems at regular points in time into the same database (much like in a data warehouse), model the entities and the needed logic in there, and report the differences. Even if this approach involves a small investment in the beginning and some optimization in logic or performance over time, it can become a useful tool for troubleshooting the differences. Such solutions can be used successfully in multiple integration scenarios (e.g. web shop or ERP integrations).

A set of reports for each entity can help identify the differences between the various entities. Starting from the reported differences the users can identify, categorize and devise specific countermeasures for the various issues. The best time to have such a solution is shortly before or during UAT. This would allow to make sure that the integration layer really works, and helps correcting the issues as long they still have a small impact on the systems. Some integration issues might even lead to a postponement of the Go-Live. The second best time is during the time the first important issues were found, as the issues can be used as support for a Business Case for implementing this type of solutions.

In general, it’s recommended to fix the problems in the integration layer and use the reports only for troubleshooting and for assuring that the integration runs smoothly. There are however situations in which the integration problems can’t be fixed without creating more issues. It’s the case in which multiple systems are involved and integrated over an integration bus.

One extreme approach, not advisable though, is to build a second integration to correct the issues of the first. This solution might work in theory however there’s the risk of multiplying the issues is really high and the complexity of troubleshooting increases with the degree of dependency between the two integrations. It would be more advisable to rebuild the integration anew, however also this approach has its advantages and disadvantages.

Bottom line is that integration issues should be addressed while they are small and that an automated solution for comparing the data can help in the process

10 November 2012

📦Data Migrations (DM): Data Quality’s Perspective I (A Bird’s-Eye View)

Data Migration
Data Migrations Series

Imagine you just finished a Data Migration (DM) project, everything went smoothly, the data were loaded into the new system with a minimum amount of issues, inherent sometimes to such complex projects, the users started to use the new system, everybody seemed to be satisfied, and a few weeks later within the company rumors propagate with the speed of light – “the migrated data are wrong”, “the new system can’t be used” , “IT did a bad job”, “we have to get back to the previous system”, and so on. The panic propagates, a few heads fall, the business tries to revert to the old system but there’s lot of new data available in the new system, and it’s not so trivial to move the data back to the old, in the meantime other rumors appear, and… it’s just a scenario but this could happen to any company if not the appropriate measures were taken at the right time. What could help a company when something like this happens?! A good Plan B aka a good Migration Fallback Plan/Policy, but that’s something nobody would like to do except extreme situations.

A common approach to any type of projects as well to a DM project is to identify and mitigate the risks before or during the project. That’s something I started to do a few days ago, to prepare a list with the risks associated with DM projects. For this exercise I tried to remember what things went wrong in previous similar projects I worked on and to figure out what else could go wrong. Some online resources helped me to refresh my memory too, and I think I found also two or three things I haven’t really thought about. My attempt was primarily focused on this type of problem mentioned above – minimizing the risks of not having the right data when the new system goes live. Before jumping into the thematic I would like to sketch the bigger picture, as I perceive it.

Having the right data when a system goes live primarily means having good Data Quality (DQ) in the target system after the data were migrated! As a DM is the best exemplification of the GIGO (Garbage-In Garbage-Out) principle, in order to have good DQ in the target is important to handle DQ latest during the DM project. That’s essential and common sense – you can’t expect to have good data in the new system when there’s lot of garbage in the old. So, a DM and a Risk Management for such a project should be built around this. In fact not having a DQ initiative or project in a DM project is one of the most important risks a company can take. Maybe in small DM, a DQ initiative isn’t necessary, though when the data are important for your company, DQ is a must! In addition DQ assessments have to be performed in alignment with the new system, and not the old. Even if the data have good quality into the old system, the quality of your data after DM will be judged in corroboration with the new system. This is a requirement that can be easily overlooked and its implications misunderstood!

Many think that DQ is one time activity, we do it for a DM project and we’ll have quality data and never have to care about their quality anymore. Totally false! DQ has to be part of a broader strategy, call it Data Governance, Master Data Management, Data Management or any other initiative in which data plays an important role. DQ is an on going, iterative and consolidated effort, it doesn’t end after DM but continues for the whole data life-cycle, as long the data have value for an organization. It doesn’t help if the data have high quality when the data are migrated and a few weeks or months later the overall quality and trust in data decreased considerably.

Keeping an acceptable level of DQ must be an organization’s strategy, and must be built a culture toward DQ. People need to be aware of the importance of having good quality data, and especially the consequences of having bad quality data. DQ doesn’t concern only the owners or stewards of data, or the people working with data, it concerns the whole organization because decisions are made based on those data, processes are changed and improved, an organization’s performance is often judged based on data. The quality of data is a matter of perception, on how users see the quality of data in corroboration with the needs they have, and the needs change over time. Primarily being aware what good DQ means and which are an organization’s needs in respect to data, it’s also a way of minimizing the negative perception of data, of gaining trust in data and some solid basis on which decisions can be made. Secondarily, these organizational data needs need to be addressed in a DM, they are the success factors upon which the success of a DM project is judged.

For sure considerable costs are associated with DQ initiatives and everything related to data which doesn’t always represent a direct cost component in the products or services handled by an organization. Considering that not all data have the same importance for an organization, it makes sense to prioritize the DQ effort as a whole and the data cleaning needs in particular, the focus should be the data with the highest impact and with time to tackle data with lower and lower impact. It must be found equilibrium between the DQ costs and the value of data. Most probably is important to spend resources on raising people’s awareness in respect to DQ early rather than cleaning retroactively data later. It also make sense to invest in tools that help to clean data using automated or semi-automated methods, though some manual/visual control need to be in place too.

DQ and the way the problems associated with it are tackled depends more on an organization’s internal kitchen – people, partners, organization, strategy, maturity, culture, geography, infrastructure, methodologies used, etc. What it matters is how the various negative and important aspects of an organization are aligned in order to take advantage of one of the most important assets an organization has is its data! For this is important to adopt methodologies that support DQ, align them and tweak them as requested, in order to make most of your data! But before or while doing that remember that a DM is an organization’s opportunity to change the quality of its data and its data strategy!

Previous Post <<||>> Next Post

07 August 2010

Database Design: Object Dependencies (Part I - An Introduction)

Data Management
Data Management Series

Introduction

Around the various data islands existing in the blue and the models that support them are created a whole range of database objects (views, stored procedures, user-defined functions) and other type of non-database objects (classes, strong-typed datasets, reports, ad-hoc queries, etc.) With each reference to a database object is created a database dependency, or simply dependency, between the database object and the other objects that reference it, thus any change occurring in a database object could impact the various referents resulting in broken links, invalid calls or any type of error that might brake the calling applications or the isolated pieces of code (e.g. reports, ad-hoc queries, SQL scripts-based logic).

Tracking Database Dependencies

Many organizations use to document such dependencies in data dictionaries or any other type of similar documentation, one of the reasons being the easier identification of the objects that are impacted by the changes occurring in the database structure. One of the problems is that the documentation is often application-oriented, targeting thus the application using the data, and if there are multiple applications consuming the same data, then it’s not so easy to aggregate all the dependencies especially when they are stored in Excel files, dispersed documents, repositories, with (complicated) permissions access, 

That’s one of the reasons for which an organization might consider storing in the source database as much of the business logic related directly to data. Encapsulating queries and procedural logic in views, stored procedures, user-defined functions or any other similar objects seems a good idea in order to reduce the maintenance of code, hide the complexity of a database from the consumers (users, services, web/desktop applications, etc.), and from several other considerations. 

The most important of these considerations is the fact that databases store not only the respective objects and statistics about them, but could store also the dependencies between them, making easier the impact analysis or any type of analysis based on the dependency between objects. It’s at the discretion of developers, architects or any other type of professional with decision power on whether they want to take advantage of such functionality.

Foreign Key Constraints

The simplest and most natural dependence information to store are the primary-foreign key relations implemented in the form of a constraint. The foreign key constraints, as they are called, identify and enforce the relationship between two tables; “identify” because it makes the relation explicit, and “enforce” because it checks the validity of foreign-primary key values pairs when records are inserted, updated or deleted, enforcing thus the referential integrity of the database. 

When a deletion is attempted on a record, the database engine checks if there is any dependent record (in the same or other table) that references the respective record, and if such a constraint is defined, the deletion is aborted raising also an error message. A check is performed also when a record is inserted or updated in the child table, the respective actions being aborted if the foreign key reference is not valid. 

Conversely, a foreign key constraint could bring additional complexity during migration tasks, though with a little effort and a good architecture the overhead is minimized. In addition the foreign key constraints could be used by third party tools to provide some degree of automation when joining tables or for other purposes.

Object Dependencies

More complex dependency regard the dependency between database objects  – views, stored procedures, user-defined functions or tables. In some cases is enough to see that there is a dependency between two objects, though in more complex situations would be useful to know which specific attribute is used from the dependency objects, especially when using the metadata for automation tasks. By creating the dependency tree, the tree of objects resulted from the dependency between the various database objects, it’s possible to provide more accurate impact assessments.

So until now were considered the dependencies between database objects, though, as highlighted above, there are many other objects stored outside of a database and referencing database objects. It makes sense to have a global repository in which to store information about dependencies, preferably in a relational database which could be easily interrogated using simple flat or hierarchical queries.

Metadata

The object definitions, statistics, dependencies and other type of information stored about data or the structures or objects related to data are encompassed under the denomination of metadata, which in common understanding is defined as “data about data”. The metadata could be used not only as input for impact analysis but also for automating business logic, functionality that opens new perspectives in development. Einstein’s believe that “problems cannot be solved by the same level of thinking that created them” is reflected in the world of databases by the fact that the metadata stored about database objects help to solved problems related to the objects and the data the databases contain. For example during a data migration project the two database structures could be mapped at table and attribute level, being possible thus to create validation rules in an automated manner.

Even if databases come with a predefined structure of storing metadata, the various solutions developed on top of such databases require additional metadata to be stored, and in theory it would be great if databases’ metadata structures could be extended for this purposes, though given the risks involved in altering such structures lead to the existence of parallel metadata repositories, in which an important percent of the database’s metadata are duplicated.

Beyond Database Dependencies

Talking about data mappings, integration projects and integration functionality/features rely heavily on data mappings, they involving a degree of automation too. Integration of data doesn’t necessarily occur only at application level, in the context of web’s evolution, the tendency is to link and integrate the various data islands (see linkeddata.org), especially the ones with public character, and provide thus cross-database functionality. Many of the problems such an approach implies are solved at metadata level, new metadata and dependency levels being required for this purpose.

Created: Aug-2010, Last Reviewed: Mar-2024

04 July 2010

🗄️Data Management: Data Profiling II (Using CLR functions)

Data Management
Data Management Series

In the previous post on Data Profiling I introduced basic data profiling techniques, the queries used for exemplification being quite simple. Probably many people will ask themselves on whether is possible to automate data profiling for a whole range of tables/datasets and the attributes they contain. The answer is simple, this relies entirely on databases’ capabilities of running dynamic scripts in an elegant manner – many such solutions relying on the use of cursors in which the dynamic created scripts are run by a stored procedure (e.g. EXEC or sp_executesql in SQL Server). There are also solution in which the dynamic queries are created, run and managed by third-party tools. In what concerns SQL Server, the CLR functions could prove to be an elegant solution for this purpose.

In a previous post, “Number of Records – The CLR Version”, I described the steps I followed in order to create a CLR function in order to get the number of records for a set of tables, the name of the table being provided as parameter. Instead of giving as parameter only the name of the table it could be provided instead the whole query string, thus having the possibility of running multiple types of query that return only a scalar. 

The problem is that the CLR function returns a value only of a certain data type, thus we could transform all the values to string or create a function for each data type. I will try to describe in this post both approaches, a reason for that being also the fact that initially I thought that the second solution is more practical, and probably easier to debug, though as I discovered the first technique is more flexible allowing to encapsulate the logic in a single query.

Let’s consider the following functions that could be added in a new Database Project or in the project created in the previous post on CLR functions. As mentioned above, is created a function for each important data type, thus ExecuteScalarToInt returns an integer value, ExecuteScalarToDate a date value, ExecuteScalarToString a string value, ExecuteScalarToDecimal a decimal value, amd ExecuteScalarToBoolean a boolean value:

Partial Public Class UserDefinedFunctions 
<SqlFunction(DataAccess:=DataAccessKind.Read, SystemDataAccess:=SystemDataAccessKind.Read)> _ Public Shared Function ExecuteScalarToInt(ByVal SqlScript As String) As Integer     
Using conn As New SqlConnection("context connection=true") 
conn.Open()     
Dim cmd As New SqlCommand(SqlScript, conn) 
Return CType(cmd.ExecuteScalar(), Integer)     
End Using End Function 

<SqlFunction(DataAccess:=DataAccessKind.Read, SystemDataAccess:=SystemDataAccessKind.Read)> _ Public Shared Function ExecuteScalarToDate(ByVal SqlScript As String) As Date     
Using conn As New SqlConnection("context connection=true") 
    conn.Open()     

    Dim cmd As New SqlCommand(SqlScript, conn)     

    Return CType(cmd.ExecuteScalar(), Date)     
End Using End Function 

<SqlFunction(DataAccess:=DataAccessKind.Read, SystemDataAccess:=SystemDataAccessKind.Read)> _ Public Shared Function ExecuteScalarToString(ByVal SqlScript As String) As String     
Using conn As New SqlConnection("context connection=true") 
    conn.Open()     

    Dim cmd As New SqlCommand(SqlScript, conn)   
  
    Return CType(cmd.ExecuteScalar(), String)     
End Using End Function 

<SqlFunction(DataAccess:=DataAccessKind.Read, SystemDataAccess:=SystemDataAccessKind.Read)> _ Public Shared Function ExecuteScalarToDecimal(ByVal SqlScript As String) As Decimal     
Using conn As New SqlConnection("context connection=true") 
    conn.Open()     

    Dim cmd As New SqlCommand(SqlScript, conn)     

    Return CType(cmd.ExecuteScalar(), Decimal)     
End Using End Function 

<SqlFunction(DataAccess:=DataAccessKind.Read, SystemDataAccess:=SystemDataAccessKind.Read)> _ Public 
Shared Function ExecuteScalarToBoolean(ByVal SqlScript As String) As Boolean     
Using conn As New SqlConnection("context connection=true") 
    conn.Open()     

    Dim cmd As New SqlCommand(SqlScript, conn)   
  
    Return CType(cmd.ExecuteScalar(), Boolean)     
End Using End Function 
End Class

After compiling the project and re-linking the assembly, must be declared the following functions:

-- returns int values 
CREATE FUNCTION dbo.ExecuteScalarToInt(@sql nvarchar(max)) 
RETURNS bigint  
AS  
EXTERNAL NAME SqlServerProject1.[SqlServerProject1.UserDefinedFunctions].ExecuteScalarToInt 
GO 

-- returns decimal values 
CREATE FUNCTION dbo.ExecuteScalarToDecimal(@sql nvarchar(max)) 
RETURNS decimal(18,2)  
AS  
EXTERNAL NAME SqlServerProject1.[SqlServerProject1.UserDefinedFunctions].ExecuteScalarToDecimal 
GO 

-- returns nvarchar values 
CREATE FUNCTION dbo.ExecuteScalarToString(@sql nvarchar(max)) 
RETURNS nvarchar(max)  
AS  
EXTERNAL NAME SqlServerProject1.[SqlServerProject1.UserDefinedFunctions].ExecuteScalarToString 
GO 

-- returns date values 
CREATE FUNCTION dbo.ExecuteScalarToDate(@sql nvarchar(max)) 
RETURNS date  
AS  
EXTERNAL NAME SqlServerProject1.[SqlServerProject1.UserDefinedFunctions].ExecuteScalarToDate 
GO 

-- returns boolean values 
CREATE FUNCTION dbo.ExecuteScalarToBoolean(@sql nvarchar(max)) 
RETURNS bit  
AS  
EXTERNAL NAME SqlServerProject1.[SqlServerProject1.UserDefinedFunctions].ExecuteScalarToBoolean 
GO 


-- testing the functions    
SELECT dbo.ExecuteScalarToInt('SELECT count(*) FROM Production.Product') NumberRecords 
SELECT dbo.ExecuteScalarToString('SELECT Max(ProductNumber) FROM Production.Product') GreatestStringValue 
SELECT dbo.ExecuteScalarToString('SELECT Max(ListPrice) FROM Production.Product') GreatestNumericValue 
SELECT dbo.ExecuteScalarToDate('SELECT Max(SellStartDate) FROM Production.Product') GreatestDateValue 
SELECT dbo.ExecuteScalarToString('SELECT CASE WHEN count(1)&gt;1 THEN 1 ELSE 0 END FROM Production.Product') HasRecords
 
Data Profiling - testing CLR functions

  The first example that returns the number of records could be easily adapted in order to return the respective value for a given set of tables:

-- number of records 
SELECT S.name [schema_name] 
, T.name table_name 
, dbo.ExecuteScalarToInt('SELECT count(*) NumberRecords FROM AdventureWorks.' + S.name + '.' + T.name) NumberRecords 
FROM AdventureWorks.sys.tables T 
    JOIN AdventureWorks.sys.schemas S 
      ON T.schema_id = S.schema_id 
WHERE S.name = 'Sales' 
ORDER BY S.name  
, T.name 
 
Data Profiling - number of records

The attribute-related metrics require a lower level of detail, to the above query adding the sys.colums table, for this purpose I will use the dbo.vTableColumns view created in the previous post on data profiling. And here’s the query based on AdventureWorks database:

-- data profiling attribute level SELECT[Schema_Name]  
, Table_Name  
, Column_Name  
, user_type  
, system_type  
-- number distinct values 
 , CASE  
    WHEN system_type NOT IN ('xml') THEN dbo.ExecuteScalarToInt('SELECT count(DISTINCT [' + Column_Name + ']) NumberRecords FROM AdventureWorks.' + [Schema_Name] + '.' + Table_Name)  
     ELSE -1 
END NumberDistinctValues 
-- number/percentage not null values 
, dbo.ExecuteScalarToInt('SELECT count(1) NumberRecords FROM AdventureWorks.' + [Schema_Name] + '.' + Table_Name + ' WHERE [' + Column_Name + '] IS NOT NULL') NumberNotNullValues  
, CASE  
    WHEN system_type NOT IN ('xml') THEN dbo.ExecuteScalarToDecimal('SELECT Cast(CASE WHEN count(1) &gt;0 THEN Cast(count([' + Column_Name + ']) as decimal(18,2))/count(1) ELSE 0 END as decimal(5,2)) PercentageNotNullValues FROM AdventureWorks.' + [Schema_Name] + '.' + Table_Name) 
    ELSE -1 
END PercentageNotNullValues 
-- min/max length of values 
, CASE  
    WHEN system_type NOT IN ('xml') THEN dbo.ExecuteScalarToInt('SELECT IsNull(Min(Len([' + Column_Name + '])), 0) MinLengthValue FROM AdventureWorks.' + [Schema_Name] + '.' + Table_Name) 
    ELSE -1 
END MinLengthValue 
, CASE  
     WHEN system_type NOT IN ('xml') THEN dbo.ExecuteScalarToInt('SELECT IsNull(Max(Len([' + Column_Name + '])), 0) MaxLengthValue FROM AdventureWorks.' + [Schema_Name] + '.' + Table_Name) 
    ELSE -1 
END MaxLengthValue 
-- Min/Max values , CASE  
    WHEN system_type NOT IN ('varbinary', 'uniqueidentifier', 'xml', 'sysname') THEN  
dbo.ExecuteScalarToString('SELECT IsNull(Cast(Min('  
    + CASE WHEN system_type = 'bit' THEN 'Cast(' ELSE '' END 
    + '[' + Column_Name + ']' 
    + CASE WHEN system_type = 'bit' THEN ' as smallint)' ELSE '' END 
     + ') as nvarchar(max)), ''NULL'') MinValue FROM AdventureWorks.' 
     + [Schema_Name] + '.' + Table_Name) 
   ELSE CAST('' as nvarchar(max))  
END MinValue 
, CASE  
     WHEN system_type NOT IN ('varbinary', 'uniqueidentifier', 'xml', 'sysname') THEN  
dbo.ExecuteScalarToString('SELECT IsNull(Cast(Max('  
    + CASE WHEN system_type = 'bit' THEN 'Cast(' ELSE '' END 
    + '[' + Column_Name + ']' 
    + CASE WHEN system_type = 'bit' THEN ' as smallint)' ELSE '' END 
+ ') as nvarchar(max)), ''NULL'') MaxValue FROM AdventureWorks.'  
    + [Schema_Name] + '.' + Table_Name )  
    ELSE CAST('' as nvarchar(max))  
END MaxValue  
FROM dbo.vTableColumns 
WHERE [Schema_Name] = 'Production' 
AND Table_Name = 'Product' ORDER BY [Schema_Name]  
, Table_Name  
, Column_Name  
, column_id 

   Here’s the output, the query run in about 30 seconds for the whole AdventureWorks database’s table:
  
Data Profiling - attribute level

 More likely, the above query requires some explanations. First of all some CASEs have been introduced in order to treat the exceptions, given the fact that not all data types support all the aggregate functions, while the xml data type doesn’t support any aggregate function at all. Hopefully I treated all the scenarios, if not the query could be easily updated. In other cases I applied a simple conversion, as in the case of bit data type casted to a smallint. In case the dynamic queries return other value than integer, the output value has been casted to a nvarchar(max). Most probably for easier understanding of the dynamic queries used is necessary also a review of the corresponding static queries presented in the previous post.

In case we use a specific function for each data type then we either choose to work with a query for each data type, or in case we want to use a UNION (ALL) join, then we’ll have to cast the output to nvarchar. So whatever method we choose, in order to create only one dataset out of our profiling implementation, a cast to nvarchar is required. I will resume myself to provide the queries for each data type, more for exemplifying the use of the above CLR functions:

-- getting Min/Max integer values 
SELECT [Schema_Name] 
, Table_Name  
, Column_Name 
, user_type 
, dbo.ExecuteScalarToInt('SELECT IsNull(Min(' + Column_Name + '), 0) MinValue FROM AdventureWorks.' + [Schema_Name] + '.' + Table_Name ) MinValue 
, dbo.ExecuteScalarToInt('SELECT IsNull(Max(' + Column_Name + '), 0) MaxValue FROM AdventureWorks.' + [Schema_Name] + '.' + Table_Name ) MaxValue 
FROM dbo.vTableColumns 
WHERE [Schema_Name] = 'Production' 
AND Table_Name = 'Product' 
AND user_type IN ('int', 'bigint') 

-- getting Min/Max String values 
SELECT [Schema_Name] 
, Table_Name  
, Column_Name 
, user_type 
, dbo.ExecuteScalarToString('SELECT IsNull(Min(' + Column_Name + '), '''') MinValue FROM AdventureWorks.' + [Schema_Name] + '.' + Table_Name ) MinValue 
, dbo.ExecuteScalarToString('SELECT IsNull(Max(' + Column_Name + '), '''') MaxValue FROM AdventureWorks.' + [Schema_Name] + '.' + Table_Name ) MaxValue 
FROM dbo.vTableColumns 
WHERE [Schema_Name] = 'Production' AND Table_Name = 'Product' 
AND user_type IN ('nvarchar', 'varchar', 'char', 'nchar') 

-- getting Min/Max Date values 
SELECT [Schema_Name] 
, Table_Name  
, Column_Name 
, user_type 
, dbo.ExecuteScalarToDate('SELECT IsNull(Min(' + Column_Name + '), Cast(''1800-01-01'' as date)) MinDateValue FROM AdventureWorks.' + [Schema_Name] + '.' + Table_Name ) MinDateValue 
, dbo.ExecuteScalarToDate('SELECT IsNull(Max(' + Column_Name + '), Cast(''1800-01-01'' as date)) MaxDateValue FROM AdventureWorks.' + [Schema_Name] + '.' + Table_Name ) MaxDateValue 
FROM dbo.vTableColumns 
WHERE [Schema_Name] = 'Production' 
AND Table_Name = 'Product' 
AND user_type IN ('datetime', 'date') 

-- getting Min/Max Boolean values 
SELECT [Schema_Name] 
, Table_Name  
, Column_Name 
, user_type 
, dbo.ExecuteScalarToBoolean('SELECT IsNull(Min(Cast(' + Column_Name + ' as smallint)), 0) MinValue FROM AdventureWorks.' + [Schema_Name] + '.' + Table_Name ) MinValue 
, dbo.ExecuteScalarToBoolean('SELECT IsNull(Max(Cast(' + Column_Name + ' as smallint)), 0) MaxValue FROM AdventureWorks.' + [Schema_Name] + '.' + Table_Name ) MaxValue 
FROM dbo.vTableColumns 
WHERE [Schema_Name] = 'Production' 
--AND Table_Name = 'Products' AND user_type IN ('bit') 

Notes:
1.   The problem with actual form of the functions is that when the query returns a null value, the database engine throws the following error message:
Msg 6522, Level 16, State 1, Line 2
A .NET Framework error occurred during execution of user-defined routine or aggregate "ExecuteScalarToDate":
System.InvalidCastException: Conversion from type 'DBNull' to type 'Date' is not valid.
System.InvalidCastException:
   at Microsoft.VisualBasic.CompilerServices.Conversions.ToDate(Object Value)
   at SqlServerProject1.UserDefinedFunctions.ExecuteScalarToDate(String SqlScript)

    
The error could be avoided by handling the NULL values with a default value, for example 0 for numeric values, the empty string for string values, a minimal value date for date values, and 0 for bit values. If for numeric and string value this translation has a minimum of impact, for date and 0 values kind of reduces from functionality.

2. SQL Server 2008 provides also a Data Profiling Task as part of its SSIS solution, quite easy to use, however in comparison with it, the above functions allow to profile not only a table but a set of tables, the statistics about attributes could be brought easily together in a tabular format and the logic could be further encapsulated in a UDF or view for reuse.

Related Posts Plugin for WordPress, Blogger...

About Me

My photo
Koeln, NRW, Germany
IT Professional with more than 24 years experience in IT in the area of full life-cycle of Web/Desktop/Database Applications Development, Software Engineering, Consultancy, Data Management, Data Quality, Data Migrations, Reporting, ERP implementations & support, Team/Project/IT Management, etc.