In almost all the reports I built, unless it was explicitly requested no to, I prefer adding a running number (aka ranking) for each record contained into the report, while providing different background colors for consecutive rows. The ranking allows easily identify a record when discussing about it within the report or extracts, while the different background colors allow differentiating between two records while following the values which scrolling horizontally. The logic for the background color can be based on two (or more) colors using the ranking as basis.
Tabular Reports
In a tabular report the RowNumber() function is the straightforward way for providing a ranking. One just needs to add a column into the report before the other columns, giving a meaningful name (e.g. RankingNo) and provide the following formula within its Expression:
= RowNumber(Nothing)
When 'Nothing' is provided as parameter, the ranking is performed across all the report. If is needed to restrict the Ranking only to a grouping (e.g. Category), then group's name needs to be provided as parameter:
= RowNumber("Category")
Matrix Reports
Unfortunately, in a matrix report based on aggregation of raw data the RowNumber() function stops working, the values shown being incorrect. The solution I use to solve this is based on the custom GetRank() VB function:
Dim Rank as Integer = 0
Dim LastValue as String = ""

Function GetRank(group as string) as integer
if group <> LastValue then
       Rank = Rank + 1
       LastValue = group
end if

return Rank
end function
The function compares the values provided in the call against a global scope LastValue text value. If the values are different, then a global scope Rank value is incremented by1, while the LastValue is initialized to the new value, otherwise the values remaining the same. The logic is basic also for a non-programmer.
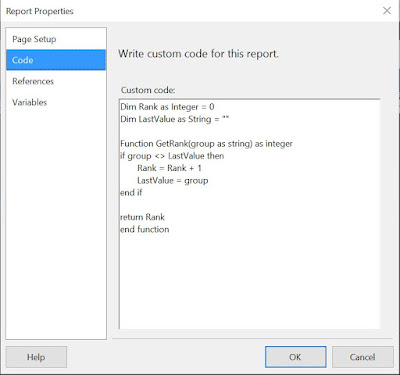
The above code needs to be added into the Code section of Report's Properties for the function to be available:
 |
| Adding the code in Report Properties |
=Code.GetRank(Fields!ProductNumber.Value)
Note:
As it seems, on the version of Reporting Services Extension I use, the function has only a page scope, the value being reset after each page. However when exporting the data with Excel the ranking is applied to the whole dataset.
Providing Alternate Colors
Independently of the report type, one can provide an alternate color for table's rows by selecting the row with the data and adding the following expression into the BackaroundColor property:
=Iif(ReportItems!RankingNo.Value Mod 2, "White", "LightSteelBlue")
Notes:
1) For a tabular report the cost of calling the RowNumber function instead of referring to the RankingNo cell is relatively small. One can write it also like this:
=llf(RowNumber(Nothing) Mod 2 = 0, "White", "LightSteelBlue")
Power BI Paginated Reports
The pieces of code considered above can be used also in Power BI Paginated Reports. Even if there's no functionality for adding custom code in the standard UI, one can make changes to the rdl file in Visual Studio or even in Notepad. For example, one can add the code within the "Code" tag at the end of the file before the closing tag for the report:
<Code>Dim Rank as Integer = 0 Dim LastValue as String = "" Dim Concatenation = "" Function GetRank(group as string) as integer if group <> LastValue then Rank = Rank + 1 LastValue = group end if Concatenation = Concatenation & vbCrLf & Rank & "/" & group & "/" & LastValue return Rank end function
</Code>
</Report>
One can consider using a pipeline "|" instead of a forward slash.
Happy coding!

No comments:
Post a Comment