17 March 2024

🧭Business Intelligence: Data Products (Part I: A Lego Exercise)

Business Intelligence
Business Intelligence Series

One can define a data product as the smallest unit of data-driven architecture that can be independently deployed and managed (aka product quantum) [1]. In other terms one can think of a data product like a box (or Lego piece) which takes data as inputs, performs several transformations on the data from which result several output data (or even data visualizations or a hybrid between data, visualizations and other content). 

At high-level each Data Analytics solution can be regarded as a set of inputs, a set of outputs and the transformations that must be performed on the inputs to generate the outputs. The inputs are the data from the operational systems, while the outputs are analytics data that can be anything from data to KPIs and other metrics. A data mart, data warehouse, lakehouse and data mesh can be abstracted in this way, though different scales apply. 

For creating data products within a data mesh, given a set of inputs, outputs and transformations, the challenge is to find horizontal and vertical partitions within these areas to create something that looks like a Lego structure, in which each piece of Lego represents a data product, while its color represents the membership to a business domain. Each such piece is self-contained and contains a set of transformations, respectively intermediary inputs and outputs. Multiple such pieces can be combined in a linear or hierarchical fashion to transform the initial inputs into the final outputs. 

Data Products with a Data Mesh

Finding such a partition is possible though it involves a considerable effort, especially in designing the whole thing - identifying each Lego piece uniquely. When each department is on its own and develops its own Lego pieces, there's no guarantee that the pieces from the various domains will fit together to built something cohesive, performant, secure or well-structured. Is like building a house from modules, the pieces must fit together. That would be the role of governance (federated computational governance) - to align and coordinate the effort. 

Conversely, there are transformations that need to be replicated for obtaining autonomous data products, and the volume of such overlapping can be considerable high. Consider for example the logic available in reports and how often it needs to be replicated. Alternatively, one can create intermediary data products, when that's feasible. 

It's challenging to define the inputs and outputs for a Lego piece. Now imagine in doing the same for a whole set of such pieces depending on each other! This might work for small pieces of data and entities quite stable in their lifetime (e.g. playlists, artists, songs), but with complex information systems the effort can increase by a few factors. Moreover, the complexity of the structure increases as soon the Lego pieces expand beyond their initial design. It's like the real Lego pieces would grow within the available space but still keep the initial structure - strange constructs may result, which even if they work, change the gravity center of the edifice in other directions. There will be thus limits to grow that can easily lead to duplication of functionality to overcome such challenges.

Each new output or change in the initial input for this magic boxes involves a change of all the intermediary Lego pieces from input to output. Just recollect the last experience of defining the inputs and the outputs for an important complex report, how many iterations and how much effort was involved. This might have been an extreme case, though how realistic is the assumption that with data products everything will go smoother? No matter of the effort involved in design, there will be always changes and further iterations involved.

Previous Post <<||>> Next Post

References:
[1] Zhamak Dehghani (2021) Data Mesh: Delivering Data-Driven Value at Scale (book review

16 March 2024

🧭Business Intelligence: A Software Engineer's Perspective (Part VII: Think for Yourself!)

Business Intelligence
Business Intelligence Series

After almost a quarter-century of professional experience the best advice I could give to younger professionals is to "gather information and think for themselves", and with this the reader can close the page and move forward! Anyway, everybody seems to be looking for sudden enlightenment with minimal effort, as if the effort has no meaning in the process!

In whatever endeavor you are caught, it makes sense to do upfront a bit of thinking for yourself - what's the task, or more general the problem, which are the main aspects and interpretations, which are the goals, respectively the objectives, how a solution might look like, respectively how can it be solved, how long it could take, etc. This exercise is important for familiarizing yourself with the problem and creating a skeleton on which you can build further. It can be just vague ideas or something more complex, though no matter the overall depth is important to do some thinking for yourself!

Then, you should do some research to identify how others approached and maybe solved the problem, what were the justifications, assumptions, heuristics, strategies, and other tools used in sense-making and problem solving. When doing research, one should not stop with the first answer and go with it. It makes sense to allocate a fair amount of time for information gathering, structuring the findings in a reusable way (e.g. tables, mind maps or other tools used for knowledge mapping), and looking at the problem from the multiple perspectives derived from them. It's important to gather several perspectives, otherwise the decisions have a high chance of being biased. Just because others preferred a certain approach, it doesn't mean one should follow it, at least not blindly!

The purpose of research is multifold. First, one should try not to reinvent the wheel. I know, it can be fun, and a lot can be learned in the process, though when time is an important commodity, it's important to be pragmatic! Secondly, new information can provide new perspectives - one can learn a lot from other people’s thinking. The pragmatism of problem solvers should be combined, when possible, with the idealism of theories. Thus, one can make connections between ideas that aren't connected at first sight.

Once a good share of facts was gathered, you can review the new information in respect to the previous ones and devise from there several approaches worthy of attack. Once the facts are reviewed, there are probably strong arguments made by others to follow one approach over the others. However, one can show that has reached a maturity when is able to evaluate the information and take a decision based on the respective information, even if the decision is not by far perfect.

One should try to develop a feeling for decision making, even if this seems to be more of a gut-feeling and stressful at times. When possible, one should attempt to collect and/or use data, though collecting data is often a luxury that tends to postpone the decision making, respectively be misused by people just to confirm their biases. Conversely, if there's any important benefit associated with it, one can collect data to validate in time one's decision, though that's a more of a scientist’s approach.

I know that's easier to go with the general opinion and do what others advise, especially when some ideas are popular and/or come from experts, though then would mean to also follow others' mistakes and biases. Occasionally, that can be acceptable, especially when the impact is neglectable, however each decision we are confronted with is an opportunity to learn something, to make a difference! 

Previous Post <<||>> Next Post

15 March 2024

🧊🗒️Data Warehousing: Data Mesh [Notes]

Disclaimer: This is work in progress intended to consolidate information from various sources. 

Last updated: 17-Mar-2024

Data Products with a Data Mesh

Data Mesh
  • {definition} "a sociotechnical approach to share, access and manage analytical data in complex and large-scale environments - within or across organizations" [1]
    • ⇐ there is no default standard or reference implementation of data mesh and its components [2]
  • {definition} a type of decentralized data architecture that organizes data based on different business domains [2]
    • ⇐ no centralized data architecture coexists with data mesh, unless in transition [1]
    • distributes the modeling of analytical data, the data itself and its ownership [1]
  • {characteristic} partitions data around business domains and gives data ownership to the domains [1]
    • each domain can model their data according to their context [1]
    • there can be multiple models of the same concept in different domains gives the data sharing responsibility to those who are most intimately familiar with the data [1]
    • endorses multiple models of the data
      • data can be read from one domain, transformed and stored by another domain [1]
  • {characteristic} evolutionary execution process
  • {characteristic} agnostic of the underlying technology and infrastructure [1]
  • {aim} respond gracefully to change [1]
  • {aim} sustain agility in the face of growth [1]
  • {aim} increase the ratio of value from data to investment [1]
  • {principle} data as a product
    • {goal} business domains become accountable to share their data as a product to data users
    • {goal} introduce a new unit of logical architecture that controls and encapsulates all the structural components needed to share data as a product autonomously [1]
    • {goal} adhere to a set of acceptance criteria that assure the usability, quality, understandability, accessibility and interoperability of data products*
    • usability characteristics
  • {principle} domain-oriented ownership
    • {goal} decentralize the ownership of sharing analytical data to business domains that are closest to the data [1]
    • {goal} decompose logically the data artefacts based on the business domain they represent and manage their life cycle independently [1]
    • {goal} align business, technology and analytical data [1]
  • {principle} self-serve data platform
    • {goal} provide a self-serve data platform to empower domain-oriented teams to manage and govern the end-to-end life cycle of their data products* [1]
    • {goal} streamline the experience of data consumers to discover, access, and use the data products [1]
  • {principle} federated computational governance
    • {goal} implement a federated decision making and accountability structure that balances the autonomy and agility of domains, while respecting the global conformance, interoperability and security of the mesh* [1]
    • {goal} codifying and automated execution of policies at a fine-grained level [1]
    • ⇐ the principles represent a generalization and adaptation of practices that address the scale of organization digitization* [1]
  • {concept} decentralization of data products
    • {requirement} ability to compose data across different modes of access and topologies [1]
      • data needs to be agnostic to the syntax of data, underlying storage type, and mode of access to it [1]
        • many of the existing composability techniques that assume homogeneous data won’t work
          • e.g.  defining primary and foreign key relationships between tables of a single schema [1]
    • {requirement} ability to discover and learn what is relatable and decentral [1]
    • {requirement} ability to seamlessly link relatable data [1]
    • {requirement} ability to relate data temporally [1]
  • {concept} data product 
    • the smallest unit of data-based architecture that can be independently deployed and managed (aka product quantum) [1]
    • provides a set of explicitly defined and data sharing contracts
    • provides a truthful portion of the reality for a particular domain (aka single slice of truth) [1]
    • constructed in alignment with the source domain [3]
    • {characteristic} autonomous
      • its life cycle and model are managed independently of other data products [1]
    • {characteristic} discoverable
      • via a centralized registry or catalog that list the available datasets with some additional information about each dataset, the owners, the location, sample data, etc. [1]
    • {characteristic} addressable
      • via a permanent and unique address to the data user to programmatically or manually access it [1] 
    • {characteristic} understandable
      • involves getting to know the semantics of its underlying data and the syntax in which the data is encoded [1]
      • describes which entities it encapsulates, the relationships between them, and their adjacent data products [1]
    • {characteristic} trustworthy and truthful
      • represents the fact of the business correctly [1]
      • provides data provenance and data lineage [1]
    • {characteristic} natively accessible
      • make it possible for various data users to access and read its data in their native mode of access [1]
      • meant to be broadcast and shared widely [3]
    • {characteristic} interoperable and composable
      • follows a set of standards and harmonization rules that allow linking data across domains easily [1]
    • {characteristic} valuable on its own
      • must have some inherent value for the data users [1]
    • {characteristic} secure
      • the access control is validated by the data product, right in the flow of data, access, read, or write [1] 
        • ⇐ the access control policies can change dynamically
    • {characteristic} multimodal 
      • there is no definitive 'right way' to create a data product, nor is there a single expected form, format, or mode that it is expected to take [3] 
    • shares its logs, traces, and metrics while consuming, transforming, and sharing data [1]
    • {concept} data quantum (aka product data quantum, architectural quantum) 
      • unit of logical architecture that controls and encapsulates all the structural components needed to share a data product [1]
        • {component} data
        • {component} metadata
        • {component} code
        • {component} policies
        • {component} dependencies' listing
    • {concept} data product observability
      • monitor the operational health of the mesh
      • debug and perform postmortem analysis
      • perform audits
      • understand data lineage
    • {concept} logs 
      • immutable, timestamped, and often structured events that are produced as a result of processing and the execution of a particular task [1]
      • used for debugging and root cause analysis
    • {concept} traces
      • records of causally related distributed events [1]
    • {concept} metrics
      • objectively quantifiable parameters that continue to communicate build-time and runtime characteristics of data products [1]
  • artefacts 
    • e.g. data, code, metadata, policies

References:
[1] Zhamak Dehghani (2021) Data Mesh: Delivering Data-Driven Value at Scale (book review)
[2] Zhamak Dehghani (2019) How to Move Beyond a Monolithic Data Lake to a Distributed Data Mesh (link)
[3] Adam Bellemare (2023) Building an Event-Driven Data Mesh: Patterns for Designing and Building Event-Driven Architectures

14 March 2024

🧭Business Intelligence: Architecture (Part I: Monolithic vs. Distributed and Zhamak Dehghani's Data Mesh - Debunked)

Business Intelligence
Business Intelligence Series

In [1] the author categorizes data warehouses (DWHs) and lakes as monolithic architectures, as opposed to data mesh's distributed architecture, which makes me circumspect about term's use. There are two general definitions of what monolithic means: (1) formed of a single large block (2) large, indivisible, and slow to change.

In software architecture one can differentiate between monolithic applications where the whole application is one block of code, multi-tier applications where the logic is split over several components with different functions that may reside on the same machine or are split non-redundantly between multiple machines, respectively distributed, where the application or its components run on multiple machines in parallel.

Distributed multi-tire applications are a natural evolution of the two types of applications, allowing to distribute redundantly components across multiple machines. Much later came the cloud where components are mostly entirely distributed within same or across distinct geo-locations, respectively cloud providers.

Data Warehouse vs. Data Lake vs. Lakehouse [2]

From licensing and maintenance convenience, a DWH resides typically on one powerful machine with many chores, though components can be moved to other machines and even distributed, the ETL functionality being probably the best candidate for this. In what concerns the overall schema there can be two or more data stores with different purposes (operational/transactional data stores, data marts), each of them with their own schema. Each such data store could be moved on its own machine though that's not feasible.

DWHs tend to be large because they need to accommodate a considerable number of tables where data is extracted, transformed, and maybe dumped for the various needs. With the proper design, also DWHs can be partitioned in domains (e.g. define one schema for each domain) and model domain-based perspectives, at least from a data consumer's perspective. The advantage a DWH offers is that one can create general dimensions and fact tables and build on top of them the domain-based perspectives, minimizing thus code's redundancy and reducing the costs.  

With this type of design, the DWH can be changed when needed, however there are several aspects to consider. First, it takes time until the development team can process the request, and this depends on the workload and priorities set. Secondly, implementing the changes should take a fair amount of time no matter of the overall architecture used, given that the transformations that need to be done on the data are largely the same. Therefore, one should not confuse the speed with which a team can start working on a change with the actual implementation of the change. Third, the possibility of reusing existing objects can speed up changes' implementation. 

Data lakes are distributed data repositories in which structured, unstructured and semi-structured data are dumped in raw form in standard file formats from the various sources and further prepared for consumption in other data files via data pipelines, notebooks and similar means. One can use the medallion architecture with a folder structure and adequate permissions for domains and build reports and other data artefacts on top. 

A data lake's value increases when is combined with the capabilities of a DWH (see dedicated SQL server pool) and/or analytics engine (see serverless SQL pool) that allow(s) building an enterprise semantic model on top of the data lake. The result is a data lakehouse that from data consumer's perspective and other aspects mentioned above is not much different than the DWH. The resulting architecture is distributed too. 

Especially in the context of cloud computing, referring to nowadays applications metaphorically (for advocative purposes) as monolithic or distributed is at most a matter of degree and not of distinction. Therefore, the reader should be careful!

Previous Post <<||>> Next Post

References:
[1] Zhamak Dehghani (2021) Data Mesh: Delivering Data-Driven Value at Scale (book review)
[2] Databricks (2022) Data Lakehouse (link)

13 March 2024

🔖Book Review: Zhamak Dehghani's Data Mesh: Delivering Data-Driven Value at Scale (2021)

Zhamak Dehghani's "Data Mesh: Delivering Data-Driven Value at Scale" (2021)

Zhamak Dehghani's "Data Mesh: Delivering Data-Driven Value at Scale" (2021) is a must read book for the data professional. So, here I am, finally managing to read it and give it some thought, even if it will probably take more time and a few more reads for the ideas to grow. Working in the fields of Business Intelligence and Software Engineering for almost a quarter-century, I think I can understand the historical background and the direction of the ideas presented in the book. There are many good ideas but also formulations that make me circumspect about the applicability of some assumptions and requirements considered. 

So, after data marts, warehouses, lakes and lakehouses, the data mesh paradigm seems to be the new shiny thing that will bring organizations beyond the inflection point with tipping potential from where organization's growth will have an exponential effect. At least this seems to be the first impression when reading the first chapters. 

The book follows to some degree the advocative tone of promoting that "our shiny thing is much better than previous thing", or "how bad the previous architectures or paradigms were and how good the new ones are" (see [2]). Architectures and paradigms evolve with the available technologies and our perception of what is important for businesses. Old and new have their place in the order of things, and the old will continue to exist, at least until the new proves its feasibility.  

The definition of the data mash as "a sociotechnical approach to share, access and manage analytical data in complex and large-scale environments - within or across organizations" [1] is too abstract even if it reflects at high level what the concept is about. Compared to other material I read on the topic, the book succeeds in explaining the related concepts as well the goals (called definitions) and benefits (called motivations) associated with the principles behind the data mesh, making the book approachable also by non-professionals. 

Built around four principles "data as a product", "domain-oriented ownership", "self-serve data platform" and "federated governance", the data mesh is the paradigm on which data as products are developed; where the products are "the smallest unit of architecture that can be independently deployed and managed", providing by design the information necessary to be discovered, understood, debugged, and audited.

It's possible to create Lego-like data products, data contracts and/or manifests that address product's usability characteristics, though unless the latter are generated automatically, put in the context of ERP and other complex systems, everything becomes quite an endeavor that requires time and adequate testing, increasing the overall timeframe until a data product becomes available. 

The data mesh describes data products in terms of microservices that structure architectures in terms of a collection of services that are independently deployable and loosely coupled. Asking from data products to behave in this way is probably too hard a constraint, given the complexity and interdependency of the data models behind business processes and their needs. Does all the effort make sense? Is this the "agility" the data mesh solutions are looking for?

Many pioneering organizations are still fighting with the concept of data mesh as it proves to be challenging to implement. At a high level everything makes sense, but the way data products are expected to function makes the concept challenging to implement to the full extent. Moreover, as occasionally implied, the data mesh is about scaling data analytics solutions with the size and complexity of organizations. The effort makes sense when the organizations have a certain size and the departments have a certain autonomy, therefore, it might not apply to small to medium businesses.

Previous Post <<||>>  Next Post

References:
[1] Zhamak Dehghani (2021) "Data Mesh: Delivering Data-Driven Value at Scale" (link)
[2] SQL-troubles (2024) Zhamak Dehghani's Data Mesh - Monolithic Warehouses and Lakes (link)

12 March 2024

🕸Systems Engineering: A Play of Problems (Much Ado about Nothing)

Disclaimer: This post was created just for fun. No problem was hurt or solved in the process! 
Updated: 12-Jun-2024

On Problems

Everybody has at least a problem. If somebody doesn’t have a problem, he’ll make one. If somebody can't make a problem, he can always find a problem. One doesn't need to search long for finding a problem. Looking for a problem one sees more problems. 

Not having a problem can easily become a problem. It’s better to have a problem than none. The none problem is undefinable, which makes it a problem. 

Avoiding a problem might lead you to another problem. Some problems are so old, that's easier to ignore them. 

In every big problem there’s a small problem trying to come out. Most problems can be reduced to smaller problems. A small problem may hide a bigger problem. 

It’s better to solve a problem when is still small, however problems can be perceived only when they grow bigger (big enough). 

In the neighborhood of a problem there’s another problem getting closer. Problems tend to attract each other. 

Between two problems there’s enough place for a third to appear. The shortest path between two problems is another problem. 

Two problems that appear together in successive situations might be the parts of the same problem. 

A problem is more than the sum of its parts.

Any problem can be simplified to the degree that it becomes another problem. 

The complementary of a problem is another problem. At the intersection/reunion of two problems lies another problem.

The inverse of a problem is another problem more complex than the initial problem.

Defining a problem correctly is another problem. A known problem doesn’t make one problem less. 

When a problem seems to be enough, a second appears. A problem never comes alone.  The interplay of the two problems creates a third.

Sharing the problems with somebody else just multiplies the number of problems. 

Problems multiply beyond necessity. Problems multiply beyond our expectations. Problems multiply faster than we can solve them. 

Having more than one problem is for many already too much. Between many big problems and an infinity of problems there seem to be no big difference. 

Many small problems can converge toward a bigger problem. Many small problems can also diverge toward two bigger problems. 

When neighboring problems exist, people tend to isolate them. Isolated problems tend to find other ways to surprise.

Several problems aggregate and create bigger problems that tend to suck within the neighboring problems.

If one waits long enough some problems will solve themselves or it will get bigger. Bigger problems exceed one's area of responsibility. 

One can get credit for a self-created problem. It takes only a good problem to become famous.

A good problem can provide a lifetime. A good problem has the tendency to kick back where it hurts the most. One can fall in love with a good problem. 

One should not theorize before one has a (good) problem. A problem can lead to a new theory, while a theory brings with it many more problems. 

If the only tool you have is a hammer, every problem will look like a nail. (paraphrasing Abraham H Maslow)

Any field of knowledge can be covered by a set of problems. A field of knowledge should be learned by the problems it poses.

A problem thoroughly understood is always fairly simple, but unfairly complex. (paraphrasing Charles F Kettering)

The problem solver created usually the problem. 

Problem Solving

Break a problem in two to solve it easier. Finding how to break a problem is already another problem. Deconstructing a problem to its parts is no guarantee for solving the problem.

Every problem has at least two solutions from which at least one is wrong. It’s easier to solve the wrong problem. 

It’s easier to solve a problem if one knows the solution already. Knowing a solution is not a guarantee for solving the problem.

Sometimes a problem disappears faster than one can find a solution. 

If a problem has two solutions, more likely a third solution exists. 

Solutions can be used to generate problems. The design of a problem seldom lies in its solutions. 

The solution of a problem can create at least one more problem. 

One can solve only one problem at a time. 

Unsolvable problems lead to problematic approximations. There's always a better approximation, one just needs to find it. One needs to be o know when to stop searching for an approximation. 

There's not only a single way for solving a problem. Finding another way for solving a problem provides more insight into the problem. More insight complicates the problem unnecessarily. 

Solving a problem is a matter of perspective. Finding the right perspective is another problem.

Solving a problem is a matter of tools. Searching for the right tool can be a laborious process. 

Solving a problem requires a higher level of consciousness than the level that created it. (see Einstein) With the increase complexity of the problems one an run out of consciousness.

Trying to solve an old problem creates resistance against its solution(s). 

The premature optimization of a problem is the root of all evil. (paraphrasing Donald Knuth)

A great discovery solves a great problem but creates a few others on its way. (paraphrasing George Polya)

Solving the symptoms of a problem can prove more difficult that solving the problem itself.

A master is a person who knows the solutions to his problems. To learn the solutions to others' problems he needs a pupil. 

"The final test of a theory is its capacity to solve the problems which originated it." (George Dantzig) It's easier to theorize if one has a set of problems.

A problem is defined as a gap between where you are and where you want to be, though nobody knows exactly where he is or wants to be.

Complex problems are the problems that persist - so are minor ones.

"The problems are solved, not by giving new information, but by arranging what we have known since long." (Ludwig Wittgenstein, 1953) Some people are just lost in rearranging. 

Solving problems is a practical skill, but impractical endeavor. (paraphrasing George Polya) 

"To ask the right question is harder than to answer it." (Georg Cantor) So most people avoid asking the right question.

Solve more problems than you create.

They Said It

"A great many problems do not have accurate answers, but do have approximate answers, from which sensible decisions can be made." (Berkeley's Law)

"A problem is an opportunity to grow, creating more problems. [...] most important problems cannot be solved; they must be outgrown." (Wayne Dyer)

"A system represents someone's solution to a problem. The system doesn't solve the problem." (John Gall, 1975)

"As long as a branch of science offers an abundance of problems, so long is it alive." (David Hilbert)

"Complex problems have simple, easy to understand, wrong answers." [Grossman's Misquote]

"Every solution breeds new problems." [Murphy's laws]

"Given any problem containing n equations, there will be n+1 unknowns." [Snafu]

"I have not seen any problem, however complicated, which, when you looked at it in the right way, did not become still more complicated." (Paul Anderson)

"If a problem causes many meetings, the meetings eventually become more important than the problem." (Hendrickson’s Law)

"If you think the problem is bad now, just wait until we’ve solved it." (Arthur Kasspe) [Epstein’s Law]

"Inventing is easy for staff outfits. Stating a problem is much harder. Instead of stating problems, people like to pass out half- accurate statements together with half-available solutions which they can't finish and which they want you to finish." [Katz's Maxims]

"It is better to do the right problem the wrong way than to do the wrong problem the right way." (Richard Hamming)

"Most problems have either many answers or no answer. Only a few problems have a single answer." [Berkeley's Law]

"Problems worthy of attack prove their worth by fighting back." (Piet Hein)

Rule of Accuracy: "When working toward the solution of a problem, it always helps if you know the answer."
Corollary: "Provided, of course, that you know there is a problem."

"Some problems are just too complicated for rational logical solutions. They admit of insights, not answers." (Jerome B Wiesner, 1963)

"Sometimes, where a complex problem can be illuminated by many tools, one can be forgiven for applying the one he knows best." [Screwdriver Syndrome]

"The best way to escape from a problem is to solve it." (Brendan Francis)

"The chief cause of problems is solutions." [Sevareid's Law]

"The first step of problem solving is to understand the existing conditions." (Kaoru Ishikawa)

"The human race never solves any of its problems, it only outlives them." (David Gerrold)

"The most fruitful research grows out of practical problems."  (Ralph B Peck)

"The problem-solving process will always break down at the point at which it is possible to determine who caused the problem." [Fyffe's Axiom]

"The worst thing you can do to a problem is solve it completely." (Daniel Kleitman)

"The easiest way to solve a problem is to deny it exists." (Isaac Asimov)

"The solution to a problem changes the problem." [Peers's Law]

"There is a solution to every problem; the only difficulty is finding it." [Evvie Nef's Law]

"There is no mechanical problem so difficult that it cannot be solved by brute strength and ignorance. [William's Law]

"Today's problems come from yesterday’s 'solutions'." (Peter M Senge, 1990)

"While the difficulties and dangers of problems tend to increase at a geometric rate, the knowledge and manpower qualified to deal with these problems tend to increase linearly." [Dror's First Law]

"You are never sure whether or not a problem is good unless you actually solve it." (Mikhail Gromov)

More quotes on Problem solving at QuotableMath.blogpost.com.

Resources:
Murphy's laws and corollaries (link)

🏭🗒️Microsoft Fabric: OneLake [Notes]

Disclaimer: This is work in progress intended to consolidate information from various sources for learning purposes. For the latest information please consult the documentation (see the links below)! 

Last updated: 12-Mar-2024

Microsoft Fabric & OneLake

[Microsoft Fabric] OneLake

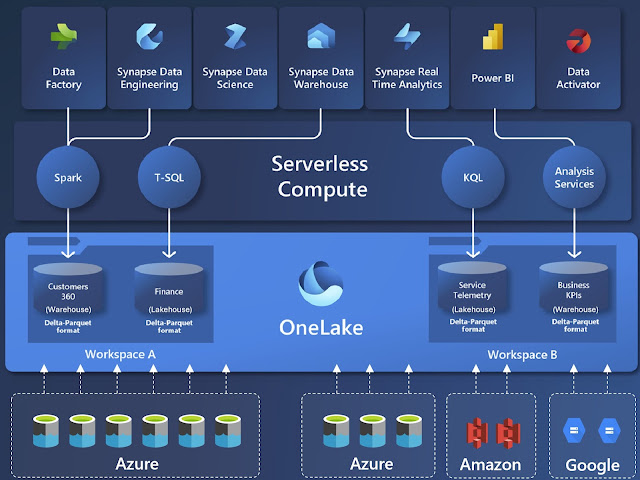
  • a single, unified, logical data lake for the whole organization [2]
    • designed to be the single place for all an organization's analytics data [2]
    • provides a single, integrated environment for data professionals and the business to collaborate on data projects [1]
    • stores all data in a single open format [1]
    • its data is governed by default
    • combines storage locations across different regions and clouds into a single logical lake, without moving or duplicating data
      • similar to how Office applications are prewired to use OneDrive
      • saves time by eliminating the need to move and copy data 
  • comes automatically with every Microsoft Fabric tenant [2]
    • automatically provisions with no extra resources to set up or manage [2]
    • used as native store without needing any extra configuration [1
  • accessible by all analytics engines in the platform [1]
    • all the compute workloads in Fabric are preconfigured to work with OneLake
      • compute engines have their own security models (aka compute-specific security) 
        • always enforced when accessing data using that engine [3]
        • the conditions may not apply to users in certain Fabric roles when they access OneLake directly [3]
  • built on top of ADLS  [1]
    • supports the same ADLS Gen2 APIs and SDKs to be compatible with existing ADLS Gen2 applications [2]
    • inherits its hierarchical structure
    • provides a single-pane-of-glass file-system namespace that spans across users, regions and even clouds
  • data can be stored in any format
    • incl. Delta, Parquet, CSV, JSON
    • data can be addressed in OneLake as if it's one big ADLS storage account for the entire organization [2]
  • uses a layered security model built around the organizational structure of experiences within MF [3]
    • derived from Microsoft Entra authentication [3]
    • compatible with user identities, service principals, and managed identities [3]
    • using Microsoft Entra ID and Fabric components, one can build out robust security mechanisms across OneLake, ensuring that you keep your data safe while also reducing copies and minimizing complexity [3]
  • hierarchical in nature 
    • {benefit} simplifies management across the organization
    • its data is divided into manageable containers for easy handling
    • can have one or more capacities associated with it
      • different items consume different capacity at a certain time
      • offered through Fabric SKU and Trials
  • {component} OneCopy
    • allows to read data from a single copy, without moving or duplicating data [1]
  • {concept} Fabric tenant
    • a dedicated space for organizations to create, store, and manage Fabric items.
      • there's often a single instance of Fabric for an organization, and it's aligned with Microsoft Entra ID [1]
        • ⇒ one OneLake per tenant
      • maps to the root of OneLake and is at the top level of the hierarchy [1]
    • can contain any number of workspaces [2]
  • {concept} capacity
    • a dedicated set of resources that is available at a given time to be used [1]
    • defines the ability of a resource to perform an activity or to produce output [1]
  • {concept} domain
    • a way of logically grouping together workspaces in an organization that is relevant to a particular area or field [1]
    • can have multiple [subdomains]
      • {concept} subdomain
        • a way for fine tuning the logical grouping of the data
  • {concept} workspace 
    • a collection of Fabric items that brings together different functionality in a single tenant [1]
      • different data items appear as folders within those containers [2]
      • always lives directly under the OneLake namespace [4]
      • {concept} data item
        • a subtype of item that allows data to be stored within it using OneLake [4]
        • all Fabric data items store their data automatically in OneLake in Delta Parquet format [2]
      • {concept} Fabric item
        • a set of capabilities bundled together into a single component [4] 
        • can have permissions configured separately from the workspace roles [3]
        • permissions can be set by sharing an item or by managing the permissions of an item [3]
    • acts as a container that leverages capacity for the work that is executed [1]
      • provides controls for who can access the items in it [1]
        • security can be managed through Fabric workspace roles
      • enable different parts of the organization to distribute ownership and access policies [2]
      • part of a capacity that is tied to a specific region and is billed separately [2]
      • the primary security boundary for data within OneLake [3]
    • represents a single domain or project area where teams can collaborate on data [3]
  • [encryption] encrypted at rest by default using Microsoft-managed key [3]
    • the keys are rotated appropriately per compliance requirements [3]
    • data is encrypted and decrypted transparently using 256-bit AES encryption, one of the strongest block ciphers available, and it is FIPS 140-2 compliant [3]
    • {limitation} encryption at rest using customer-managed key is currently not supported [3]
  • {general guidance} write access
    • users must be part of a workspace role that grants write access [4] 
    • rule applies to all data items, so scope workspaces to a single team of data engineers [4] 
  • {general guidance}Lake access: 
    • users must be part of the Admin, Member, or Contributor workspace roles, or share the item with ReadAll access [4] 
  • {general guidance} general data access 
    • any user with Viewer permissions can access data through the warehouses, semantic models, or the SQL analytics endpoint for the Lakehouse [4] 
  • {general guidance} object level security:
    • give users access to a warehouse or lakehouse SQL analytics endpoint through the Viewer role and use SQL DENY statements to restrict access to certain tables [4]
  • {feature|preview} trusted workspace access
    • allows to securely access firewall-enabled Storage accounts by creating OneLake shortcuts to Storage accounts, and then use the shortcuts in the Fabric items [5]
    • based on [workspace identity]
    • {benefit} provides secure seamless access to firewall-enabled Storage accounts from OneLake shortcuts in Fabric workspaces, without the need to open the Storage account to public access [5]
    • {limitation} available for workspaces in Fabric capacities F64 or higher
  • {concept} workspace identity
    • a unique identity that can be associated with workspaces that are in Fabric capacities
    • enables OneLake shortcuts in Fabric to access Storage accounts that have [resource instance rules] configured
    • {operation} creating a workspace identity
      • Fabric creates a service principal in Microsoft Entra ID to represent the identity [5]
  • {concept} resource instance rules
    • a way to grant access to specific resources based on the workspace identity or managed identity [5] 
    • {operation} create resource instance rules 
      • created by deploying an ARM template with the resource instance rule details [5]
https://sql-troubles.blogspot.com/2024/03/microsoft-fabric-medallion-architecture.html
Acronyms:
ADLS - Azure Data Lake Storage
AES - Advanced Encryption Standard 
ARM - Azure Resource Manager
FIPS - Federal Information Processing Standard
SKU - Stock Keeping Units

References:
[1] Microsoft Learn (2023) Administer Microsoft Fabric (link)
[2] Microsoft Learn (2023) OneLake, the OneDrive for data (link)
[3] Microsoft Learn (2023) OneLake security (link)
[4] Microsoft Learn (2023) Get started securing your data in OneLake (link}
[5] Microsoft Fabric Updates Blog (2024) Introducing Trusted Workspace Access for OneLake Shortcuts, by Meenal Srivastva (link)

Resources:
[1] 


11 March 2024

🧭🚥Business Intelligence: Key Performance Indicators [KPI] (Between Certainty and Uncertainty)

Business Intelligence
Business Intelligence Series

Despite the huge collection of documented Key Performance Indicators (KPIs) and best practices on which KPIs to choose, choosing a reliable set of KPIs that reflect how the organization performs in achieving its objectives continues to be a challenge for many organizations. Ideally, for each objective there should be only one KPIs that reflects the target and the progress made, though is that realistic?

Let's try to use the driver's metaphor to exemplify several aspects related to the choice of KPIs. A driver's goal is to travel from point A to point B over a distance d in x hours. The goal is SMART (Specific, Measurable, Achievable, Relevant, and Time-bound) if the speed and time are realistic and don't contradict Physics, legal or physical laws. The driver can define the objective as "arriving on time to the destination". 

One can define a set of metrics based on the numbers that can be measured. We have the overall distance and the number of hours planned, from which one can derive an expected average speed v. To track a driver's progress over time there are several metrics that can be thus used: e.g., (1) the current average speed, (2) the number of kilometers to the destination, (3) the number of hours estimated to the destination. However, none of these metrics can be used alone to denote the performance alone. One can compare the expected with the current average speed to get a grasp of the performance, and probably many organizations will use only (1) as KPI, though it's needed to use either (2) or (3) to get the complete picture. So, in theory two KPIs should be enough. Is it so?

When estimating (3) one assumes that there are no impediments and that the average speed can be attained, which might be correct for a road without traffic. There can be several impediments - planned/unplanned breaks, traffic jams, speed limits, accidents or other unexpected events, weather conditions (that depend on the season), etc. Besides the above formula, one needs to quantify such events in one form or another, e.g., through the perspective of the time added to the initial estimation from (3). However, this calculation is based on historical values or navigator's estimation, value which can be higher or lower than the final value. 

Therefore, (3) is an approximation for which is needed also a confidence interval (± t hours). The value can still include a lot of uncertainty that maybe needs to be broken down and quantified separately upon case to identify the deviation from expectations, e.g. on average there are 3 traffic jams (4), if the road crosses states or countries there may be at least 1 control on average (5), etc. These numbers can be included in (3) and the confidence interval, and usually don't need to be reported separately, though probably there are exceptions. 

When planning, one needs to also consider the number of stops for refueling or recharging the car, and the average duration of such stops, which can be included in (3) as well. However, (3) slowly becomes  too complex a formula, and even if there's an estimation, the more facts we're pulling into it, the bigger the confidence interval's variation will be. Sometimes, it's preferable to have instead two-three other metrics with a low confidence interval than one with high variation. Moreover, the longer the distance planned, the higher the uncertainty. One thing is to plan a trip between two neighboring city, and another thing is to plan a trip around the world. 

Another assumption is that the capability of the driver/car to drive is the same over time, which is not always the case. This can be neglected occasionally (e.g. one trip), though it involves a risk (6) that might be useful to quantify, especially when the process is repeatable (e.g. regular commuting). The risk value can increase considering new information, e.g. knowing that every a few thousand kilometers something breaks, or that there's a traffic fine, or an accident. In spite of new information, the objective might also change. Also, the objective might suffer changes, e.g. arrive on-time safe and without fines to the destination. As the objective changes or further objectives are added, more metrics can be defined. It would make sense to measure how many kilometers the driver covered in a lifetime with the car (7), how many accidents (8) or how many fines (9) the driver had. (7) is not related to a driver's performance, but (8) and (9) are. 

As can be seen, simple processes can also become very complex if one attempts to consider all the facts and/or quantify the uncertainty. The driver's metaphor applies to a simple individual, though once the same process is considered across the whole organization (a group of drivers), the more complexity is added and the perspective changes completely. E.g., some drivers might not even reach the destination or not even have a car to start with, and so on. Of course, with this also the objectives change and need to be redefined accordingly. 

The driver's metaphor is good for considering planning activities in which a volume of work needs to be completed in a given time and where a set of constraints apply. Therefore, for some organizations, just using two numbers might be enough for getting a feeling for what's happening. However, as soon one needs to consider other aspects like safety or compliance (considered in aggregation across many drivers), there might be other metrics that qualify as KPIs.

It's tempting to add two numbers and consider for example (8) and (9) together as the two are events that can be cumulated, even if they refer to different things that can overlap (an accident can result in a fine and should be counted maybe only once). One needs to make sure that one doesn't add apples with juice - the quantified values must have the same unit of measure, otherwise they might need to be considered separately. There's the tendency of mixing multiple metrics in a KPI that doesn't say much if the units of measure of its components are not the same. Some conversions can still be made (e.g. how much juice can be obtained from apples), though that's seldom the case.

Previous Post <<||>> Next Post

10 March 2024

🏭📑Microsoft Fabric: Medallion Architecture [Notes]

Disclaimer: This is work in progress intended to consolidate information from various sources for learning purposes. For the latest information please consult the documentation (see the links below)! 

Last updated: 10-Mar-2024

Medallion Architecture in Microsoft Fabric [1]


Medallion architecture
  • a recommended data design pattern used to organize data in a lakehouse logically [2]
    • compatible with the concept of data mesh
  • {goal} incrementally and progressively improve the structure and quality of data as it progresses through each stage [1]
    • brings structure and efficiency to a lakehouse environment [2]
    • ensures that data is reliable and consistent as it goes through various checks and changes [2]
    •  complements other data organization methods, rather than replacing them [2]
  • consists of three distinct layers (or zones)
    • {layer} bronze (aka raw zone
      • stores source data in its original format [1]
      • the data in this layer is typically append-only and immutable [1]
      • {recommendation} store the data in its original format, or use Parquet or Delta Lake [1]
      • {recommendation} create a shortcut in the bronze zone instead of copying the data across [1]
        • works with OneLake, ADLS Gen2, Amazon S3, Google
      • {operation} ingest data
        • {characteristic} maintains the raw state of the data source [3]
        • {characteristic} is appended incrementally and grows over time [3]
        • {characteristic} can be any combination of streaming and batch transactions [3]
        • ⇒ retaining the full, unprocessed history
          • ⇒ provides the ability to recreate any state of a given data system [3]
        • additional metadata may be added to data on ingest
            • e.g. source file names, recording the time data was processed
          • {goal} enhanced discoverability [3]
          • {goal} description of the state of the source dataset [3]
          • {goal} optimized performance in downstream applications [3]
    • {layer} silver (aka enriched zone
      • stores data sourced from the bronze layer
      • the raw data has been 
        • cleansed
        • standardized
        • structured as tables (rows and columns)
        • integrated with other data to provide an enterprise view of all business entities
      • {recommendation} use Delta tables 
        • provide extra capabilities and performance enhancements [1]
          • {default} every engine in Fabric writes data in the delta format and use V-Order write-time optimization to the Parquet file format [1]
      • {operation} validate and deduplicate data
      • for any data pipeline, the silver layer may contain more than one table [3]
    • {layer} gold (aka curated zone)
      • stores data sourced from the silver layer [1]
      • the data is refined to meet specific downstream business and analytics requirements [1]
      • tables typically conform to star schema design
        • supports the development of data models that are optimized for performance and usability [1]
      • use lakehouses (one for each zone), a data warehouse, or combination of both
        • the decision should be based on team's preference and expertise of your team. 
        • different analytic engines can be used [1]
    • ⇐ schemas and tables within each layer can take on a variety of forms and degrees of normalization [3]
      • depends on the frequency and nature of data updates and the downstream use cases for the data [3]
  • {pattern} create each zone as a lakehouse
    • business users access data by using the SQL analytics endpoint [1]
  • {pattern} create the bronze and silver zones as lakehouses, and the gold zone as data warehouse
    • business users access data by using the data warehouse endpoint [1]
  • {pattern} create all lakehouses in a single Fabric workspace
    • {recommendation} create each lakehouse in its own workspace [1]
    • provides more control and better governance at the zone level [1]
  • {concept} data transformation 
    • involves altering the structure or content of data to meet specific requirements [2] 
      • via Dataflows (Gen2), notebooks
  • {concept} data orchestration 
    • refers to the coordination and management of multiple data-related processes, ensuring they work together to achieve a desired outcome [2]
      • via data pipelines

Previous Post  <<||>>  Next Post

Acronyms:
ADLS - Azure Data Lake Store Gen2

References:
[1] Microsoft Learn: Fabric (2023) Implement medallion lakehouse architecture in Microsoft Fabric (link)
[2] Microsoft Learn: Fabric (2023) Organize a Fabric lakehouse using medallion architecture design (link)
[3] Microsoft Learn: Azure (2023) What is the medallion lakehouse architecture? (link)

Resources:
[R1] Serverless.SQL (2023) Data Loading Options With Fabric Workspaces, by Andy Cutler (link)
[R2] Microsoft Learn: Fabric (2023) Lakehouse end-to-end scenario: overview and architecture (link)

🏭📑Microsoft Fabric: Lakehouse [Notes]

Disclaimer: This is work in progress intended to consolidate information from various sources for learning purposes. For the latest information please consult the documentation (see the links below)! 

Last updated: 10-Mar-2024

[Microsoft Fabric] Lakehouse

  • a unified platform that combines the capabilities of 
    • data lake
      • built on top of the OneLake scalable storage layer using and Delta format tables [1]
        • support ACID  transactions through Delta Lake formatted tables for data consistency and integrity [1]
          • ⇒ scalable analytics solution that maintains data consistency [1]
      • {capability} scalable, distributed file storage
        • can scale automatically and provide high availability and disaster recovery [1]
      • {capability} flexible schema-on-read semantics
        • ⇒ the schema can be changed as needed [1]
        • ⇐ rather than having a predefined schema
      • {capability} big data technology compatibility
        • store all data formats 
        • can be used with various analytics tools and programming languages
        • use Spark and SQL engines to process large-scale data and support machine [1] learning or predictive modeling analytics
    • data warehouse
      • {capability} relational schema modeling
      • {capability} SQL-based querying
        • {feature} has a built-in SQL analytics endpoint
          • ⇐ the data can be queried by using SQL without any special setup [2]
      • {capability} proven basis for analysis and reporting
      • ⇐ unlocks data warehouse capabilities without the need to move data [2]
    • ⇐ a database built on top of a data lake 
      • ⇐  includes metadata
    • ⇐ a data architecture platform for storing, managing, and analyzing structured and unstructured data in a single location [2]
      • ⇒ single location for data engineers, data scientists, and data analysts to access and use data [1]
      • ⇒ it can easily scale to large data volumes of all file types and sizes
      • ⇒ it's easily shared and reused across the organization
  • supports data governance policies [1]
    • e.g. data classification and access control
  • can be created in any premium tier workspace [1]
    • appears as a single item within the workspace in which was created [1]
      • ⇒ access is controlled at this level as well [1]
        • directly within Fabric
        • via the SQL analytics endpoint
  • permissions are granted either at the workspace or item level [1]
  • users can work with data via
    • lakehouse UI
      • add and interact with tables, files, and folders [1]
    • SQL analytics endpoint 
      • enables to use SQL to query the tables in the lakehouse and manage its relational data model [1]
  • two physical storage locations are provisioned automatically
    • tables
      • a managed area for hosting tables of all formats in Spark
        • e.g. CSV, Parquet, or Delta
      • all tables are recognized as tables in the lakehouse
      • delta tables are recognized as tables as well
    • files 
      • an unmanaged area for storing data in any file format [2]
      • any Delta files stored in this area aren't automatically recognized as tables [2]
      • creating a table over a Delta Lake folder in the unmanaged area requires to explicitly create a shortcut or an external table with a location that points to the unmanaged folder that contains the Delta Lake files in Spark [2]
    • ⇐ the main distinction between the managed area (tables) and the unmanaged area (files) is the automatic table discovery and registration process [2]
      • {concept} registration process
        • runs over any folder created in the managed area only [2]
  • {operation} ingest data into lakehouse
    • {medium} manual upload
      • upload local files or folders to the lakehouse
    • {medium} dataflows (Gen2)
      • import and transform data from a range of sources using Power Query Online, and load it directly into a table in the lakehouse [1]
    • {medium} notebooks
      • ingest and transform data, and load it into tables or files in the lakehouse [1]
    • {medium} Data Factory pipelines
      • copy data and orchestrate data processing activities, loading the results into tables or files in the lakehouse [1]
  • {operation} explore and transform data
    • {medium} notebooks
      •  use code to read, transform, and write data directly to the lakehouse as tables and/or files [1]
    • {medium} Spark job definitions
      • on-demand or scheduled scripts that use the Spark engine to process data in the lakehouse [1]
    • {medium} SQL analytic endpoint: 
      • run T-SQL statements to query, filter, aggregate, and otherwise explore data in lakehouse tables [1]
    • {medium} dataflows (Gen2): 
      • create a dataflow to perform subsequent transformations through Power Query, and optionally land transformed data back to the lakehouse [1]
    • {medium} data pipelines: 
      • orchestrate complex data transformation logic that operates on data in the lakehouse through a sequence of activities [1]
        • (e.g. dataflows, Spark jobs, and other control flow logic).
  • {operation} analyze and visualize data
    • use the semantic model as the source for Power BI reports 
  • {concept} shortcuts
    • embedded references within OneLake that point to other files or storage locations
    • enable to integrate data into lakehouse while keeping it stored in external storage [1]
      • ⇐ allow to quickly source existing cloud data without having to copy it
      • e.g. different storage account or different cloud provider [1]
      • the user must have permissions in the target location to read the data [1]
      • data can be accessed via Spark, SQL, Real-Time Analytics, and Analysis Services
    • appear as a folder in the lake
    • {limitation} have limited data source connectors
      • {alternatives} ingest data directly into your lakehouse [1]
    • enable Fabric experiences to derive data from the same source to always be in sync
  • {concept} Lakehouse Explorer
    • enables to browse files, folders, shortcuts, and tables; and view their contents within the Fabric platform [1]

References:
[1] Microsoft Learn: Fabric (2023) Get started with lakehouses in Microsoft Fabric (link)
[2] Microsoft Learn: Fabric (2023) Implement medallion lakehouse architecture in Microsoft Fabric (link)

🏭🗒️Microsoft Fabric: Dataflows Gen 1 [Notes]

Disclaimer: This is work in progress intended to consolidate information from various sources. 

Last updated: 10-Mar-2024

Dataflows Architecture in Power BI
Dataflows Architecture [3]

[Microsoft Fabric] Dataflow (Gen1)

  • a type of cloud-based ETL tool for building and executing scalable data transformation processes [1]
  • a collection of tables created and managed in workspaces in the Power BI service [4]
  • acts as building blocks on top of one another [4]
  • includes all of the transformations to reduce data prep time and then can be loaded into a new table, included in a Data Pipeline, or used as a data source by data analysts [1]
  • {benefit} promote reusability of underlying data elements
    • prevent the need to create separate connections with your cloud or on-premises data sources.
  • supports a wide range of cloud and on-premises sources [3]
  • {operation} refreshing a dataflow 
    • is required before it can be consumed in a semantic model in Power BI Desktop, or referenced as a linked or computed table [4]
    • can be refreshed at the same frequency as a semantic model [4]
    • {concept} incremental refresh
    • [Premium capacity] can be set to refresh incrementally
      • adds parameters to the dataflow to specify the date range
      • {contraindication} linked tables shouldn't use incremental refresh if they reference a dataflow
        • ⇐ dataflows don't support query folding (even if the table is DirectQuery enabled).
      • {contraindication} semantic models referencing dataflows shouldn't use incremental refresh
        • ⇐ refreshes to dataflows are generally performant, so incremental refreshes shouldn't be necessary
        • if refreshes take too long, consider using the compute engine, or DirectQuery mode
  • {operation} deleting a workflow
    • if a workspace that contains dataflows is deleted, all its dataflows are also deleted [4]
      • even if recovery of the workspace is possible, one cannot recover the deleted dataflows
        • ⇐ either directly or through support from Microsoft [4]
  • {operation} consuming a dataflow
    • create a linked table from the dataflow
    • allows another dataflow author to use the data [4]
    • create a semantic model from the dataflow
    • allows a user to utilize the data to create reports [4]
    • create a connection from external tools that can read from the CDM format [4]
  • {feature} [premium] Enhanced compute engine.
    • enables premium subscribers to use their capacity to optimize the use of dataflows
    • {advantage} reduces the refresh time required for long-running ETL steps over computed entities, such as performing joins, distinct, filters, and group by [7]
    • {advantage} performs DirectQuery queries over entities [7]
    • individually set for each dataflow
    • {configuration} disabled
    • {configuration|default} optimized
      • automatically turned on when a table in the dataflow is referenced by another table or when the dataflow is connected to another dataflow in the same workspace.
    • {configuration} On
    • {limitation} works only for A3 or larger Power BI capacities [7]
  • {feature} [premium] DirectQuery
    • allows to use DirectQuery to connect directly to dataflows without having to import its data [7]
  • {advantage} avoid separate refresh schedules 
    • removes the need to create an imported semantic model [7]
  • {advantage} filtering data 
    • allows to filter dataflow data and work with the filtered subset [7]
    • {limitation} composite/mixed models that have import and DirectQuery data sources are currently not supported [7]
    • {limitation} large dataflows might have trouble with timeout issues when viewing visualizations [7]
      • {workaround} use Import mode [7]
    • {limitation} under data source settings, the dataflow connector will show invalid credentials [7]
      • the warning doesn't affect the behavior, and the semantic model will work properly [7]
  • {feature} [premium] Computed entities
    • allows to perform calculations on your existing dataflows, and return results [7]
    • enable to focus on report creation and analytics [7]
    • {limitation} work properly only when the entities reside in the same storage account [7]
  • {feature} [premium] Linked Entities
    • allows to reference existing dataflows
    • one can perform calculations on these entities using computed entities [7]
    • allows to create a "single source of the truth" table that can be reused within multiple dataflows [7]
    • {limitation} work properly only when the entities reside in the same storage account [7]
  • {feature} [premium] Incremental refresh
    • adds parameters to the dataflow to specify the date range [7]
  • {concept} table
    • represents the data output of a query created in a dataflow, after the dataflow has been refreshed
    • represents data from a source and, optionally, the transformations that were applied to it
  • {concept} computed tables
    • similar to other tables 
      • one get data from a source and one can apply further transformations to create them
    • their data originates from the storage dataflow used, and not the original data source [6]
      • ⇐ they were previously created by a dataflow and then reused [6]
    • created by referencing a table in the same dataflow or in a different dataflow [6]
  • {concept} [Power Query] custom function
    • a mapping from a set of input values to a single output value [5]
  • {scenario} create reusable transformation logic that can be shared by many semantic models and reports inside Power BI [3]
  • {scenario} persist data in ADL Gen 2 storage, enabling you to expose it to other Azure services outside Power BI [3]
  • {scenario} create a single source of truth
    • encourages uptake by removing analysts' access to underlying data sources [3]
  • {scenario} strengthen security around underlying data sources by exposing data to report creators in dataflows
    • allows to limit access to underlying data sources, reducing the load on source systems [3]
    • gives administrators finer control over data refresh operations [3]
  • {scenario} perform ETL at scale, 
    • dataflows with Power BI Premium scales more efficiently and gives you more flexibility [3]
  • {best practice} chose the best connector for the task provides the best experience and performance [5] 
  • {best practice} filter data in the early stages of the query
    • some connectors can take advantage of filters through query folding [5]
  • {best practice} do expensive operations last
    • help minimize the amount of time spend waiting for the preview to render each time a new step is added to the query [5]
  • {best practice} temporarily work against a subset of your data
    • if adding new steps to the query is slow, consider using "Keep First Rows" operation and limiting the number of rows you're working against [5]
  • {best practice} use the correct data types
    • some features are contextual to the data type [5]
  • {best practice} explore the data
  • {best practice} document queries by renaming or adding a description to steps, queries, or groups [5]
  • {best practice} take a modular approach
    • split queries that contains a large number of steps into multiple queries
    • {goal} simplify and decouple transformation phases into smaller pieces to make them easier to understand [5]
  • {best practice} future-proof queries 
    • make queries resilient to changes and able to refresh even when some components of data source change [5]
  • {best practice] creating queries that are dynamic and flexible via parameters [5]
    • parameters serves as a way to easily store and manage a value that can be reused in many different ways [5]
  • {best practice} create reusable functions
    • can be created from existing queries and parameters [5]

Acronyms:
CDM - Common Data Model
ETL - Extract, Transform, Load

References:
[1] Microsoft Learn: Fabric (2023) Ingest data with Microsoft Fabric (link)
[2] Microsoft Learn: Fabric (2023) Dataflow Gen2 pricing for Data Factory in Microsoft Fabric (link)
[3] Microsoft Learn: Fabric (2023) Introduction to dataflows and self-service data prep (link)
[4] Microsoft Learn: Fabric (2023) Configure and consume a dataflow (link)
[5] Microsoft Learn: Fabric (2023) Dataflows best practices* (link)
[6] Microsoft Learn: Fabric (2023) Computed table scenarios and use cases (link)
[7] Microsoft Lean: Power BI - Learn (2024) Premium features of dataflows (link

Resources:

🏭🗒️Microsoft Fabric: Dataflows Gen2 [Notes]

Disclaimer: This is work in progress intended to consolidate information from various sources for learning purposes. For the latest information please consult the documentation (see the links below)! 

Last updated: 10-Mar-2024

Dataflow (Gen2) Architecture [4]

[Microsoft Fabric] Dataflow (Gen2) 

  •  new generation of dataflows that resides alongside the Power BI Dataflow (Gen1) [2]
  • allows to 
    • extract data from various sources
    • transform it using a wide range of transformation operations 
    • load it into a destination [1]
  • {goal} provide an easy, reusable way to perform ETL tasks using Power Query Online [1]
    • allows to promote reusable ETL logic 
      • ⇒ prevents the need to create more connections to the data source.
      • offer a wide variety of transformations
    • can be horizontally partitioned
  • {component} Lakehouse 
    • used to stage data being ingested
  • {component} Warehouse 
    • used as a compute engine and means to write back results to staging or supported output destinations faster
  • {component} Mashup Engine
    • extracts, transforms, or loads the data to staging or data destinations when either [4]
      • Warehouse compute cannot be used [4]
      • staging is disabled for a query [4]
  • {operation} creating a dataflow
    • can be created in a
      • Data Factory workload
      • Power BI workspace
      • Lakehouse
  • {operation} publishing a dataflow
    • generates dataflow's definition  
      • ⇐ the program that runs once the dataflow is refreshed to produce tables in staging storage and/or output destination [4]
      • used by the dataflow engine to generate an orchestration plan, manage resources, and orchestrate execution of queries across data sources, gateways, and compute engines, and to create tables in either the staging storage or data destination [4]
    • saves changes and runs validations that must be performed in the background [2]
  • {operation} refreshing a dataflow
  • {operation} running a dataflow 
    • can be run
      • manually
      • on a refresh schedule
      • as part of a Data Pipeline orchestration
  • {feature} author dataflows with Power Query
    • uses the full Power Query experience of Power BI dataflows [2]
  • {feature} shorter authoring flow
    • uses step-by-step for getting the data into your the dataflow [2]
      • the number of steps required to create dataflows were reduced [2]
    • a few new features were added to improve the experience [2]
  • {feature} Auto-Save and background publishing
    • changes made to a dataflow are autosaved to the cloud (aka draft version of the dataflow) [2]
      • ⇐ without having to wait for the validation to finish [2]
    • {functionality} save as draft 
      • stores a draft version of the dataflow every time you make a change [2]
      • seamless experience and doesn't require any input [2]
    • {concept} published version
      • the version of the dataflow that passed validation and is ready to refresh [5]
  • {feature} integration with data pipelines
    • integrates directly with Data Factory pipelines for scheduling and orchestration [2] 
  • {feature} high-scale compute
    • leverages a new, higher-scale compute architecture [2] 
      •  improves the performance of both transformations of referenced queries and get data scenarios [2]
      • creates both Lakehouse and Warehouse items in the workspace, and uses them to store and access data to improve performance for all dataflows [2]
  • {feature} improved monitoring and refresh history
    • integrate support for Monitoring Hub [2]
    • Refresh History experience upgraded [2]
  • {feature} get data via Dataflows connector
    • supports a wide variety of data source connectors
      • include cloud and on-premises relational databases
  • {feature|planned} incremental refresh 
    • enables you to incrementally extract data from data sources, apply Power Query transformations, and load into various output destinations [5]
  • {feature|planned} Fast Copy 
    • enables large-scale data ingestion directly utilizing the pipelines Copy Activity capability [6]
    • supports sources such Azure SQL Databases, CSV, and Parquet files in Azure Data Lake Storage and Blob Storage [6]
    • significantly scales up the data processing capacity providing high-scale ELT capabilities [6]
  • {feature|planned}Cancel refresh
    • enables to cancel ongoing Dataflow Gen2 refreshes from the workspace items view [6]
  • {feature} data destinations
    • allows to 
      • specify an output destination
      • separate ETL logic and destination storage [2]
    • every tabular data query can have a data destination [3]
      • available destinations
        • Azure SQL databases
        • Azure Data Explorer (Kusto)
        • Fabric Lakehouse
        • Fabric Warehouse
        • Fabric KQL database
      • a destination can be specified for every query individually [3]
      • multiple different destinations can be used within a dataflow [3]
      • connecting to the data destination is similar to connecting to a data source
      • {limitation} functions and lists aren't supported
    • {operation} creating a new table
      • {default} table name has the same name as the query name.
    • {operation} picking an existing table
    • {operation} deleting a table manually from the data destination 
      • doesn't recreate the table on the next refresh [3]
    • {operation} reusing queries from Dataflow Gen1
      • {method} export Dataflow Gen1 query and import it into Dataflow Gen2
        • export the queries as a PQT file and import them into Dataflow Gen2 [2]
      • {method} copy and paste in Power Query
        • copy the queries and paste them in the Dataflow Gen2 editor [2]
    • automatic settings:
      • {limitation} supported only for Lakehouse and Azure SQL database
      • {setting} Update method replace: 
        • data in the destination is replaced at every dataflow refresh with the output data of the dataflow [3]
      • {setting} Managed mapping: 
        • the mapping is automatically adjusted when republishing the data flow to reflect the change 
          • ⇒ doesn't need to be updated manually into the data destination experience every time changes occur [3]
      • {setting} Drop and recreate table: 
        • on every dataflow refresh the table is dropped and recreated to allow schema changes
        • {limitation} the dataflow refresh fails if any relationships or measures were added to the table [3]
    • update methods
      • {method} replace: 
        • on every dataflow refresh, the data is dropped from the destination and replaced by the output data of the dataflow.
        • {limitation} not supported by Fabric KQL databases and Azure Data Explorer 
      • {method} append: 
        • on every dataflow refresh, the output data from the dataflow is appended (aka merged) to the existing data in the data destination table (aka upsert)
    • staging 
      • {default} enabled
        • allows to use Fabric compute to execute queries
          • ⇐ enhances the performance of query processing
        • the data is loaded into the staging location
          • ⇐ an internal Lakehouse location accessible only by the dataflow itself
        • [Warehouse] staging is required before the write operation to the data destination
          • ⇐ improves performance
          • {limitation} only loading into the same workspace as the dataflow is supported
        •  using staging locations can enhance performance in some cases
      • disabled
        • {recommendation} [Lakehouse] disable staging on the query to avoid loading twice into a similar destination
          • ⇐ once for staging and once for data destination
          • improves dataflow's performance
    • {scenario} use a dataflow to load data into the lakehouse and then use a notebook to analyze the data [2]
    • {scenario} use a dataflow to load data into an Azure SQL database and then use a data pipeline to load the data into a data warehouse [2]
  • {benefit} extends data with consistent data, such as a standard date dimension table [1]
  • {benefit} allows self-service users access to a subset of data warehouse separately [1]
  • {benefit} optimizes performance with dataflows, which enable extracting data once for reuse, reducing data refresh time for slower sources [1]
  • {benefit} simplifies data source complexity by only exposing dataflows to larger analyst groups [1]
  • {benefit} ensures consistency and quality of data by enabling users to clean and transform data before loading it to a destination [1]
  • {benefit} simplifies data integration by providing a low-code interface that ingests data from various sources [1]
  • {limitation} not a replacement for a data warehouse [1]
  • {limitation} row-level security isn't supported [1]
  • {limitation} Fabric or Fabric trial capacity workspace is required [1]


Feature Data flow Gen2 Dataflow Gen1
Author dataflows with Power Query
Shorter authoring flow
Auto-Save and background publishing
Data destinations
Improved monitoring and refresh history
Integration with data pipelines
High-scale compute
Get Data via Dataflows connector
Direct Query via Dataflows connector
Incremental refresh ✓*
Fast Copy ✓*
Cancel refresh ✓*
AI Insights support
Dataflow Gen1 vs Gen2 [2]


Acronyms:
ETL - Extract, Transform, Load
KQL - Kusto Query Language
PQO - Power Query Online
PQT - Power Query Template

References:
[1] Microsoft Learn: Fabric (2023) Ingest data with Microsoft Fabric (link)
[2] Microsoft Learn: Fabric (2023) Getting from Dataflow Generation 1 to Dataflow Generation 2 (link)
[3] Microsoft Learn: Fabric (2023) Dataflow Gen2 data destinations and managed settings (link)
[4] Microsoft Learn: Fabric (2023) Dataflow Gen2 pricing for Data Factory in Microsoft Fabric (link)
[5] Microsoft Learn: Fabric (2023) Save a draft of your dataflow (link)
[6] Microsoft Learn: Fabric (2023) What's new and planned for Data Factory in Microsoft Fabric (link)

Resources:
[R1] Arshad Ali & Bradley Schacht (2024) Learn Microsoft Fabric (link)
[R2] Microsoft Learn: Fabric (2023) Data Factory limitations overview (link)
[R3] Microsoft Fabric Blog (2023) Data Factory Spotlight: Dataflow Gen2, by Miguel Escobar (link)
[R4] Microsoft Learn: Fabric (2023) Dataflow Gen2 connectors in Microsoft Fabric (link) 
[R5] Microsoft Learn: Fabric (2023) Pattern to incrementally amass data with Dataflow Gen2 (link)
[R6] Fourmoo (2004) Microsoft Fabric – Comparing Dataflow Gen2 vs Notebook on Costs and usability, by Gilbert Quevauvilliers (link)
[R7] Microsoft Learn: Fabric (2023) A guide to Fabric Dataflows for Azure Data Factory Mapping Data Flow users (link)
[R8] Microsoft Learn: Fabric (2023) Quickstart: Create your first dataflow to get and transform data (link)
[R9] Microsoft Learn: Fabric (2023) Microsoft Fabric decision guide: copy activity, dataflow, or Spark (link)
[R10] Microsoft Fabric Blog (2023) Dataflows Gen2 data destinations and managed settings, by Miquella de Boer  (link)
[R11] Microsoft Fabric Blog (2023) Service principal support to connect to data in Dataflow, Datamart, Dataset and Dataflow Gen 2, by Miquella de Boer (link)
[R12] Chris Webb's BI Blog (2023) Fabric Dataflows Gen2: To Stage Or Not To Stage? (link)
[R13] Power BI Tips (2023) Let's Learn Fabric ep.7: Fabric Dataflows Gen2 (link)

Related Posts Plugin for WordPress, Blogger...

About Me

My photo
Koeln, NRW, Germany
IT Professional with more than 24 years experience in IT in the area of full life-cycle of Web/Desktop/Database Applications Development, Software Engineering, Consultancy, Data Management, Data Quality, Data Migrations, Reporting, ERP implementations & support, Team/Project/IT Management, etc.