27 November 2020

🧊Data Warehousing: ETL (Part II: An Introduction)


ETL (Extract, Transform, Load) processes, technologies or tools are about extracting data from one or more data sources via a set of queries, performing changes on the data via conversions, aggregations, mappings or other types of transformations, respectively loading the data into target tables or other type of repositories. Thus, an ETL process allows moving and transforming data between predefined data structures on an ad-hoc basis or as part of stable repetitive processes, which makes ETL ideal for data warehousing, data integrations, data migrations or similar scenarios. 

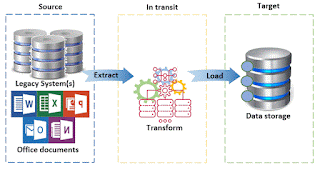
ETL Data Flow

Extract: The extraction of data is done typically based on SQL queries from relational databases or any OLEDB or ODBC-based data repositories including flat or MS Office files, though modern ETL tools can support other type of queries (CAML, XQuery, DAX) or even NoSQL architectures (Handoop). This allows addressing a wide range of requirements, the complexity of the logic depending on the functionality provided by the query languages, respectively the extraction functionality available.  

Transform: The transformation logic can be implemented based on the functionality provided by the ETL tool, and can involve after case any combination of aggregates, conditional splits, merges, lookups, multicasts, pivoting/unpivoting, cleansing, data conversions, sampling, mapping or any other transformations that can be performed on an in-transit dataset. On the other side, quite often the same can be achieved with the help of SQL-based manipulations directly in the extraction logic or later in the process. SQL can prove to be occasionally faster and more flexible than the transformations provided by the ETL tool, however despite the overlaps, the two approaches can complement each other when used adequately. 

Load: The load is usually just a dump of the data into one or more final or intermediary tables with predefined structures. Unless the data don’t match the data type, format or further defined constraints, the load seldom involve further challenges as long the solution was designed adequately. 

Within the logical model, extract, transform and load can be considered as process by themselves. Within the object model provided by the ETL tool, they are considered in the mentioned sequence within a data flow, which within a set of workflow constraints defines how the data move through the pipeline – the sequence of processing steps considered. The basic unit of work is the data flow and the workflow it belongs to, unit that can be encapsulated in one container for easier management or simply convenience. Several containers can be linked within a workflow to create more complex behavior. 

The data flows and workflow constraints, together with the supporting connections and containers form an ETL package, the main unit of work for encapsulating and running ETL logic. ETL packages are scheduled and run as fit for the purpose.

With the right design, these building blocks allow enough flexibility in handling ad-hoc requests or of building complex solutions. This involves decisions on how to partition the ETL packages, respectively the data flows, in which order they should be run, where and in which sequence the data should be transformed, how to handle exceptions, how to build eventually intermediary data repositories, how to handles audit requirements, and so on. Each of these choices can prove to be important. 

The knowledge of the ETL architecture and functionality is quintessential in providing the right solution for the problem considered, however once the basics were understood the challenges typically reside in understanding the source and/or target structures, the logical and physical entities available, identify the way the data can be partitioned horizontally or vertically, respectively what type of transformations are required for moving the data, as required by the solution. 

Previous Post <<||>> Next Post

07 November 2020

⛁DBMS: Event Streaming Databases (More of a Kafka’s Story)

Database Management

Event streaming architectures are architectures in which data are generated by different sources, and then processed, stored, analyzed, and acted upon in real-time by the different applications tapped into the data streams. An event streaming database is then a database that assures that its data are continuously up-to-date, providing specific functionality like management of connectors, materialized views and running queries on data-in-motion (rather than on static data). 

Reading about this type of technologies one can easily start fantasizing about the Web as a database in which intelligent agents can process streams of data in real-time, in which knowledge is derived and propagated over the networks in an infinitely and ever-growing flow in which the limits are hardly perceptible, in which the agents act as a mind disconnected in the end from the human intent. One is stroke by the fusing elements of realism and the fantastic aspects, more like in a Kafka’s story in which the metamorphosis of the technologies and social aspects can easily lead to absurd implications.

The link to Kafka was somehow suggested by Apache Kafka, an open-source distributed event streaming platform, which seems to lead the trends within this new-developing market. Kafka provides database functionality and guarantees the ACID (atomicity, concurrency, isolation, durability) properties of transactions while tapping into data streams. 

Data streaming is an appealing concept though it has some important challenges like data overload or over-flooding, the complexity derived from building specific (business) and integrity rules for processing the data, respectively for keeping data consistency and truth within the ever-growing and ever-changing flows. 

Data overload or over-flooding occurs when applications are not able to keep the pace with the volume of data or events fired with each change. Imagine the raindrops falling on a wide surface in which each millimeter or micrometer has its own rules for handling the raindrops and this at large scale. The raindrops must infiltrate into the surface to be processed and find their way to the beneath water flows, aggregating up to streams that could nurture seas or even oceans. Same metaphor can be applied to the data events, in which the data pervade applications accumulating in streams processed by engines to derive value. However heavy rains can easily lead to floods in which water aggregates at the surface. 

Business applications rely on predefined paths in which the flow of data is tidily linked to specific actions found themselves in processual sequences that reflect the material or cash flow. Any variation in the data flow from expectations will lead to inefficiencies and ultimately to chaos. Some benefit might be derived from data integrations between the business applications, however applications must be designed for this purpose and handle extreme behaviors like over-flooding. 

Data streams are maybe ideal for social media networks in which one broadcasts data through the networks and any consumer that can tap to the network can further use the respective data. We can see however the problems of nowadays social media – data, better said information, flow through the networks being changed as fit for purposes that can easily diverge from the initial intent. Moreover, information gets denatured, misused, overused to the degree that it overloads the networks, being more and more difficult to distinguish between reliable and non-reliable information. If common sense helps in the process of handling such information, not the same can be said about machines or applications. 

It will be challenging to deal with the vastness, vagueness, uncertainty, inconsistency, and deceit of the networks of the future, however data streaming more likely will have a future as long it can address such issues by design. 


06 November 2020

🧭Business Intelligence: Perspectives (Part VI: Data Soup - Reports vs. Data Visualizations)

Business Intelligence Series

Considering visualizations, John Tukey remarked that ‘the greatest value of a picture is when it forces us to notice what we never expected to see’, which is not always the case for many of the graphics and visualizations available in organizations, typically in the form of simple charts and dashboards, quite often with no esthetics or meaning behind.

In general, reports are needed as source for operational activities, in which the details in form of raw or aggregate data are important. As one moves further to the tactical or strategic aspects of a business, visualizations gain in importance especially when they allow encoding data and information, respectively variations, trends or relations in smaller places with minimal loss of information.

There are also different aspects of visualizations that need to be considered. Modern tools allow rapid visualization and interactive navigation of data across different variables which is great as long one knows what is searching for, which is not always the case.

There are junk charts in which the data drowns in graphical elements that bring no value to the reader, in extremis even distorting the message/meaning.

There are graphics/visualizations that attempt bringing together and encoding multiple variables in respect to a theme, and for which a ‘project’ is typically needed as data is not ad-hoc available, don’t have the desired quality or need further transformations to be ready for consumption. Good quality graphics/visualizations require time and a good understanding of the business, which are not necessarily available into the BI/Analytics teams, and unfortunately few organizations do something in that direction, ignoring typically such needs. In this type of environments is stressed the rapid availability of data for decision-making or action-relevant insight, which depends typically on the consumer.

The story-telling capabilities of graphics/visualizations are often exaggerated. Yes, they can tell a story though stories need to be framed into a context/problem, some background and further references need to be provided, while without detailed data the graphics/visualizations are just nice representations in which each consumer understands what he can.

In an ideal world the consumer and the ‘designer’ would work together to identify the important data for the theme considered, to find the appropriate level of detail, respectively the best form of encoding. Such attempts can stop at table-based representations (aka reports), respectively basic or richer forms of graphical representations. One can consider reports as an early stage of the visualization process, with the potential to derive move value when the data allow meaningful graphical representations. Unfortunately, the time, data and knowledge available seldom make this achievable.

In addition, a well-designed report can be used as basis for multiple purposes, while a graphic/visualization can enforce more limitations. Ideal would be when multiple forms of representation (including reports) are combined to harness the value of data. Navigations from visualizations to detailed data can be useful to understand what happens; learning and understanding the various aspects being an iterative process.

It’s also difficult to demonstrate the value of insight derived from visualizations, especially when graphical literacy goes behind the numeracy and statistical literacy - many consumers lacking the skills needed to evaluate numbers and statistics adequately. If for a good artistic movie you need an assistance to enjoy the show and understand the message(s) behind it, the same can be said also about good graphics/visualizations. Moreover, this requires creativity, abstraction-based thinking, and other capabilities to harness the value of representations.

Given the considerable volume of requirements related to the need of basis data, reports will continue to be on high demand in organizations. In exchange visualizations can complement them by providing insights otherwise not available.

Initially published on Medium as answer to a post on Reporting and Visualizations. 

31 October 2020

🧊Data Warehousing: Architecture (Part III: Data Lakes & other Puddles)

Data Warehousing

One can consider a data lake as a repository of all of an organization’s data found in raw form, however this constraint might be too harsh as the data found at different levels of processing can be imported as well, for example the results of data mining or other Data Science techniques/methods can be considered as raw data for further processing.

In the initial definition provided by James Dixon, the difference between a data lake and a data mart/warehouse was expressed metaphorically as the transition from bottled water to lakes streamed (artificially) from various sources. It’s contrasted thus the objective-oriented, limited and single-purposed role of the data mart/warehouse in respect to the flow of data in nature that could be tapped and harnessed as desired. These are though metaphors intended to sensitize the buyer. Personally, I like to think of the data lake as an extension of the data infrastructure, in which the data mart or warehouse is integrant part. Imposing further constrains seem to have no benefit.  

Probably the most important characteristic of a data lake is that it makes the data of an organization discoverable and consumable, though from there to insight and other benefits is a long road and requires specific knowledge about the techniques used, as well about organization’s processes and data. Without this data lake-based solutions can lead to erroneous results, same as mixing several ingredients without having knowledge about their usage can lead to cooking experiments aloof from the art of cooking.

A characteristic of data is that they go through continuous change and have different timeliness, respectively degrees of quality in respect to the data quality dimensions implied and sources considered. Data need to reflect the reality at the appropriate level of detail and quality required by the processing application(s), this applying to data warehouses/marts as well data lake-based solutions.

Data found in raw form don’t necessarily represent the true/truth and don’t necessarily acquire a good quality no matter how much they are processed. Solutions need to be resilient in respect to the data they handle through their layers, independently of the data quality and transmission problems. Whether one talks about ETL, data migration or other types of data processing, keeping the data integrity at various levels and layers can be maybe the most important demand upon solutions.

Snapshots as moment-in-time recordings of tables, entities, sets of entities, datasets or whole databases, prove to be often the best mechanisms in keeping data integrity when this aspect is essential to their processing (e.g. data migrations, high-accuracy measurements). Unfortunately, the more systems are involved in the process and the broader span of the solutions over the sources, the more difficult it become to take such snapshots.

A SQL query’s output represents a snapshot of the data, therefore SQL-based solutions are usually appropriate for most of the business scenarios in which the characteristics of data (typically volume, velocity and/or variety) make their processing manageable. However, when the data are extracted by other means integrity is harder to obtain, especially when there’s no timestamp to allow data partitioning on a time scale, the handling of data integrity becoming thus in extremis a programmer’s task. In addition, getting snapshots of the data as they are changed can be a costly and futile task.

Further on, maintaining data integrity can prove to be a matter of design in respect not only to the processing of data, but also in respect to the source applications and the business processes they implement. The mastery of the underlying principles, techniques, patterns and methodologies, helps in the process of designing the right solutions.

Note:
Written as answer to a Medium post on data lakes and batch processing in data warehouses. 

30 October 2020

Data Science: Data Strategy (Part II: Generalists vs Specialists in the Field)

Data Science

Division of labor favorizes the tasks done repeatedly, where knowledge of the broader processes is not needed, where aspects as creativity are needed only at a small scale. Division invaded the IT domains as tools, methodologies and demands increased in complexity, and therefore Data Science and BI/Analytics make no exception from this.

The scale of this development gains sometimes humorous expectations or misbelieves when one hears headhunters asking potential candidates whether they are upfront or backend experts when a good understanding of both aspects is needed for providing adequate results. The development gains tragicomical implications when one is limited in action only to a given area despite the extended expertise, or when a generalist seems to step on the feet of specialists, sometimes from the right entitled reasons. 

Headhunters’ behavior is rooted maybe in the poor understanding of the domain of expertise and implications of the job descriptions. It’s hard to understand how people sustain of having knowledge about a domain just because they heard the words flying around and got some glimpse of the connotations associated with the words. Unfortunately, this is extended to management and further in the business environment, with all the implications deriving from it. 

As Data Science finds itself at the intersection between Artificial Intelligence, Data Mining, Machine Learning, Neurocomputing, Pattern Recognition, Statistics and Data Processing, the center of gravity is hard to determine. One way of dealing with the unknown is requiring candidates to have a few years of trackable experience in the respective fields or in the use of a few tools considered as important in the respective domains. Of course, the usage of tools and techniques is important, though it’s a big difference between using a tool and understanding the how, when, why, where, in which ways and by what means a tool can be used effectively to create value. This can be gained only when one’s exposed to different business scenarios across industries and is a tough thing to demand from a profession found in its baby steps. 

Moreover, being a good data scientist involves having a deep insight into the businesses, being able to understand data and the demands associated with data – the various qualitative and quantitative aspects. Seeing the big picture is important in defining, approaching and solving problems. The more one is exposed to different techniques and business scenarios, with right understanding and some problem-solving skillset one can transpose and solve problems across domains. However, the generalist will find his limitations as soon a certain depth is reached, and the collaboration with a specialist is then required. A good collaboration between generalists and specialists is important in complex projects which overreach the boundaries of one person’s knowledge and skillset. 

Complexity is addressed when one can focus on the important characteristic of the problem, respectively when the models built can reflect the demands. The most important skillset besides the use of technical tools is the ability to model problems and root the respective problems into data, to elaborate theories and check them against reality. 

Complex problems can require specialization in certain fields, though seldom one problem is dependent only on one aspect of the business, as problems occur in overreaching contexts that span sometimes the borders of an organization. In addition, the ability to solve problems seem to be impacted by the diversity of the people involved into the task, sometimes even with backgrounds not directly related to organization’s activity. As in evolution, a team’s diversity is an important factor in achievement and learning, most gain being obtained when knowledge gets shared and harnessed beyond the borders of teams.

Note:
Written as answer to a Medium post on Data Science generalists vs specialists.

Data Science: Data Strategy (Part I: Big Data vs. Business Strategies)

Data Science

A strategy, independently on whether applied to organizations, chess, and other situations, allows identifying the moves having the most promising results from a range of possible moves that can change as one progresses into the game. Typically, the moves compete for same or similar resources, each move having at the respective time a potential value expressed in quantitative and/or qualitative terms, while the values are dependent on the information available about one’s and partners’ positions into the game. Therefore, a strategy is dependent on the decision-making processes in place, the information available about own business, respective the concurrence, as well about the game.

Big data is not about a technology but an umbrella term for multiple technologies that support in handling data with high volume, veracity, velocity or variety. The technologies attempt helping organizations in harnessing what is known as Big data (data having the before mentioned characteristics), for example by allowing answering to business questions, gaining insight into the business or market, improving decision-making. Through this Big data helps delivering value to businesses, at least in theory.

Big-data technologies can harness all data of an organization though this doesn’t imply that all data can provide value, especially when considered in respect to the investments made. Data bring value when they have the potential of uncovering hidden trends or (special) patterns of behavior, when they can be associated in new meaningful ways. Data that don’t reflect such characteristics are less susceptible of bringing value for an organization no matter how much one tries to process the respective data. However, looking at the data through multiple techniques can help organization get a better understanding of the data, though here is more about the processes of attempting understanding the data than the potential associated directly with the data.

Through active effort in understanding the data one becomes aware of the impact the quality of data have on business decisions, on how the business and processes are reflected in its data, how data can be used to control processes and focus on what matters. These are aspects that can be corroborated with the use of simple BI capabilities and don’t necessarily require more complex capabilities or tools. Therefore allowing employees the time to analyze and play with the data, can in theory have a considerable impact on how data are harnessed within an organization.

If an organization’s decision-making processes is dependent on actual data and insight (e.g. stock market) then the organization is more likely to profit from it. In opposition, organizations whose decision-making processes hand handle hours, days or months of latency in their data, then more likely the technologies will bring little value. Probably can be found similar examples for veracity, variety or similar characteristics consider under Big data.

The Big data technologies can make a difference especially when the extreme aspects of their characteristics can be harnessed. One talks about potential use which is different than the actual use. The use of technologies doesn’t equate with results, as knowledge about the tools and the business is mandatory to harness the respective tools. For example, insight doesn’t necessarily imply improved decision-making because it relies on people’s understanding about the business, about the numbers and models used.

That’s maybe one of the reasons why organization fail in deriving value from Big data. It’s great that companies invest in their Big data, Analytics/BI infrastructures, though without working actively in integrating the new insights/knowledge and upgrading people’s skillset, the effects will be under expectations. Investing in employees’ skillset is maybe one of the important decisions an organization can make as part of its strategy.

Note:
Written as answer to a Medium post on Big data and business strategies. 

14 October 2020

𖣯🧮Strategic Management: Simplicity VI (ERP Implementations' Story II)


Besides the witty sayings and theories advanced in defining what simplicity is about, life shows that there’s a considerable gap between theory and praxis. In the attempt at a definition, one is forced to pull more concepts like harmony, robustness, variety, balance, economy, or proportion, which can be grouped under organic unity or similar concepts. However, intuitionally one can advance the idea that from a cybernetic perspective simplicity is achieved when the information flows are not disrupted and don’t meet unnecessary resistance. By information here are considered the various data aggregations – data, information, knowledge, and eventually wisdom (aka DIKW pyramid) – though it can be extended to encompass materials, cash and vital energy.

One can go further and say that an organization is healthy when the various flows mentioned above run smoothly through the organization nourishing it. The comparison with the human body can go further and say that a blockage in the flow can cause minor headaches or states that can take a period of convalescence to recover from them. Moreover, the sustained effort applied by an organization can result in fatigue or more complex ailments or even diseases if the state is prolonged. 

For example, big projects like ERP implementations tend to suck the vital energy of an organization to the degree that it will take months to recover from the effort, while the changes in the other types of flow can lead to disruptions, especially when the change is not properly managed. Even if ERP implementations provide standard solutions for the value-added processes, they represent vendors’ perspective into the respective processes, which don’t necessarily fit an organization’s needs. One is forced then to make compromises either by keeping close to the standard or by expanding the standard processes to close the gap. Either way processual changes are implied, which affect the information flow, especially for the steps where further coordination is needed, respectively the data flow in respect to implementation or integration with the further systems. A new integration as well as a missing integration have the potential of disrupting the data and information flows.

The processual changes can imply changes in the material flow as the handling of the materials can change, however the most important impact is caused maybe by the processual bottlenecks, which can cause serious disruptions (e.g. late deliveries, production is stopped), and upon case also in the cash-flow (e.g. penalties for late deliveries, higher inventory costs). The two flows can be impacted by the data and information flows independently of the processual changes (e.g. when they have poor quality, when not available, respectively when don’t reach the consumer in timely manner). 

With a new ERP solution, the organization needs to integrate the new data sources into the existing BI infrastructure, or when not possible, to design and implement a new one by taking advantage of the technological advancements. Failing to exploit this potential will impact the other flows, however the major disruptions appear when the needed knowledge about business processes is not available in-house, in explicit and/or implicit form, before, during and after the implementation. 

Independently on how they are organized – in center of excellence or ad-hoc form – is needed a group of people who can manage the various flows and ideally, they should have the appropriate level of empowerment. Typically, the responsibility resides with key users, IT and one or two people from the management. Without a form of ‘organization’ to manage the flows, the organization will reside only on individual effort, which seldom helps reaching the potential. Independently of the number of resources involved, simplicity is achieved when the activities flow naturally. 

Previous Post <<||>> Next Post

Written: Sep-2020, Last Reviewed: Mar-2024

29 September 2020

𖣯🧮Strategic Management: Simplicity V (ERP Implementations' Story I)

Strategic Management

Probably ERP Implementations are one of the most complex type of projects one deals with in the IT world, however their complexity seldom resides in technologies themselves, but in the effort that needs to be made by organizations before, during and post-implementations. Through their transformative nature ERP implementations have the potential of changing the whole organization if their potential is exploited accordingly, which is unfortunately not always the case. Therefore, the challenges don’t resume only to managing a project or implementing a technology, but also in managing change, and that usually happens or needs to happen at several levels. 

Typically, the change is considered mainly at IT infrastructure and processual level, because at these levels most of the visible changes happen – that’s what steals the show. For the whole project duration is about replacing one or more legacy systems, making sure that the new infrastructure works as expected. The more an organization deviates from the standard the more effort is needed, and this effort can exhaust an organization’s resources to the degree that will need some time to recover after that, financially, but maybe more important from a vital point of view.

Even if the technological and processual layers are important, as they form the foundation on which an organization builds upon, besides the financial and material flow there are also the data, informational and knowledge flows, which seems to be neglected. Quite often that’s where the transformational potential resides. If an organization is not able to change positively these flows, on the long term the implementation will deal with problems people wished to be addressed much earlier, when the effort and effect would have met the lowest resistance, respectively the highest impact. 

An ERP implementation involves the migration of data between source(s) and target(s), the data requirements, including the one of appropriate quality, being regarded in respect to the target system(s). As within the data migration steps the data are extracted from the various sources, enriched, and prepared for import into the target system(s), there is the potential of bringing data quality to a level which would help the organization further. It’s probably simpler to imagine the process of taking the data from one place, cleaning and enriching the data to bring it to the needed form, and then putting the data into the new system. It’s a unique chance of improving data quality without touching the source or target system(s) while getting a considerable value.

Unfortunately, many organizations’ efforts to improve the quality of their data stop after the implementation. If there’s no focus and there are no structures in place to continue the effort, sooner or later data’s quality will decrease despite the earlier made efforts. Investing for example in a long-term data quality improvement or even a data management initiative might prove to be an exploratory and iterative process in which mistakes are maybe made, the direction might need to be changed, though, as long learning is involved, in this often resides the power of changing for the better.

When one talks about information there are two aspects to it: how an organization arrives from data to actionable information that reach timely the people who need it, respectively how information is further aggregated, recombined, shared, and harnessed into knowledge. These are the first three layers of knowledge (aka DIKW) pyramid, and an organization’s real success story is in how can manage these flows together, while increasing the value they provide for the organization. It’s an effort that must start with the implementation itself, or even earlier, and continue after the implementation, as an organization seems fit.

Previous Post <<||>> Next Post

Written: Sep-2020, Last Reviewed: Mar-2024

27 September 2020

𖣯Strategic Management: Strategy Design (Part IV: Designing for Simplicity)


More than two centuries ago, in his course on the importance of Style in Literature, George Lewes wisely remarked that 'the first obligation of Simplicity is that of using the simplest means to secure the fullest effect' [1]. This is probably the most important aspect the adopters of the KISS mantra seem to ignore – solutions need to be simple while covering all or most important aspects to assure the maximum benefit. The challenge for many resides in defining what the maximum benefit is about. This state of art is typically poorly understood, especially when people don’t understand what’s possible, respectively of what’s necessary to make things work smoothly. 

To make the simplicity principle work, one must envision the desired state of a product or solution and trace back what’s needed to achieve that vision. One can aim for the maximum or for the minimum possible, respectively for anything in between. That’s at least true in theory, in praxis there are constraints that limit the range of achievement, constraints ranging from the availability of resources, their maturity or the available time, respectively to the limits for growth - the learning capacity of individuals and organization as a whole. 

On the other side following the 80/20 principle, one could achieve in theory 80% of a working solution with 20% of the effort needed in achieving the full 100%. This principle comes with a trick too because one needs to focus on the important components or aspects of the solution for this to work. Otherwise, one is forced to do exploratory work in which the learning is gradually assimilated into the solution. This implies continuous feedback, respectively changing the targets as one progresses in multiple iterations. The approach is typically common to ERP implementations, BI and Data Management initiatives, or similar transformative projects which attempt changing an organization’s data, information, or knowledge flows - the backbones organizations are built upon.     

These two principles can be used together to shape an organization. While simplicity sets a target or compass for quality, the 80/20 principle provides the means of splitting the roadmap and effort into manageable targets while allowing to identify and prioritize the critical components, and they seldom resume only to technology. While technologies provide a potential for transformation, in the end is an organization’s setup that has the transformative role. 

For transformational synergies to happen, each person involved in the process must have a minimum of necessary skillset, knowledge and awareness of what’s required and how a solution can be harnessed. This minimum can be initially addressed through training and self-learning, however without certain mechanisms in place, the magic will not happen by itself. Change needs to be managed from within as part of an organization’s culture, by the people close to the flow, and when necessary, also from the outside, by the ones who can provide guiding direction. Ideally, a strategic approach is needed the vision, mission, goals, objectives, and roadmap are sketched, where intermediary targets are adequately mapped and pursued, and the progress is adequately tracked.

Thus, besides the technological components is needed to consider the required organizational components to support and manage change. These components form a structure which needs to adhere by design to the same principle of simplicity. According to Lewes, the 'simplicity of structure means organic unity' [1], which can imply harmony, robustness, variety, balance, economy or proportion. Without these qualities the structure of the resulting edifice can break under its own weight. Moreover, paraphrasing Eric Hoffer, simplicity marks the end of a continuous process of designing, building, and refining, while complexity marks a primitive stage.

Previous Post <<||>> Next Post

Written: Sep-2020, Last Reviewed: Mar-2024

References:
[1] George H Lewes (1865) "The Principles of Success in Literature"

Considered quotes:
"Simplicity of structure means organic unity, whether the organism be simple or complex; and hence in all times the emphasis which critics have laid upon Simplicity, though they have not unfrequently confounded it with narrowness of range." (George H Lewes, "The Principles of Success in Literature", 1865)
"The first obligation of Simplicity is that of using the simplest means to secure the fullest effect. But although the mind instinctively rejects all needless complexity, we shall greatly err if we fail to recognise the fact, that what the mind recoils from is not the complexity, but the needlessness." (George H Lewes, "The Principles of Success in Literature", 1865)
"In products of the human mind, simplicity marks the end of a process of refining, while complexity marks a primitive stage." (Eric Hoffer, 1954)

13 September 2020

🎓Knowledge Management: Definitions II (What's in a Name)

Knowledge Management

Browsing through the various books on databases and programming appeared over the past 20-30 years, it’s probably hard not to notice the differences between the definitions given even for straightforward and basic concepts like the ones of view, stored procedure or function. Quite often the definitions lack precision and rigor, are circular and barely differentiate the defined term (aka concept) from other terms. In addition, probably in the attempt of making the definitions concise, important definitory characteristics are omitted.

Unfortunately, the same can be said about other non-scientific books, where the lack of appropriate definitions make the understanding of the content and presented concepts more difficult. Even if the reader can arrive in time to an approximate understanding of what is meant, one might have the feeling that builds castles in the air as long there is no solid basis to build upon – and that should be the purpose of a definition – to offer the foundation on which the reader can build upon. Especially for the readers coming from the scientific areas this lack of appropriateness and moreover, the lack of definitions, feels maybe more important than for the professional who already mastered the respective areas.

In general, a definition of a term is a well-defined descriptive statement which serves to differentiate it from related concepts. A well-defined definition should be meaningful, explicit, concise, precise, non-circular, distinct, context-dependent, relevant, rigorous, and rooted in common sense. In addition, each definition needs to be consistent through all the content and when possible, consistent with the other definitions provided. Ideally the definitions should cover as much of possible from the needed foundation and provide a unitary consistent multilayered non-circular and hierarchical structure that facilitates the reading and understanding of the given material.

Thus, one can consider the following requirements for a definition:

Meaningful: the description should be worthwhile and convey the required meaning for understanding the concept.

Explicit: the description must state clearly and provide enough information/detail so it can leave no room for confusion or doubt.

Context-dependent: the description should provide upon case the context in which the term is defined.

Concise: the description should be as succinct as possible – obtaining the maximum of understanding from a minimum of words.

Precise: the description should be made using unambiguous words that provide the appropriate meaning individually and as a whole.

Intrinsic non-circularity: requires that the term defined should not be used as basis for definitions, leading thus to trivial definitions like “A is A”.

Distinct: the description should provide enough detail to differentiate the term from other similar others.

Relevant: the description should be closely connected or appropriate to what is being discussed or presented.

Rigorous: the descriptions should be the result of a thorough and careful thought process in which the multiple usages and forms are considered.  

Extrinsic non-circularity: requires that the definitions of two distinct terms should not be circular (e.g. term A’s definition is based on B, while B’s definition is based on A), situation usually met occasionally in dictionaries.

Rooted in common sense: the description should not deviate from the common-sense acceptance of the terms used, typically resulted from socially constructed or dictionary-based definitions.

Unitary consistent multilayered hierarchical structure: the definitions should be given in an evolutive structure that facilitates learning, typically in the order in which the concepts need to be introduced without requiring big jumps in understanding. Even if concepts have in general a networked structure, hierarchies can be determined, especially based on the way concepts use other concepts in their definitions. In addition, the definitions must be consistent – hold together – respectively be unitary – form a whole.

04 August 2020

💼Project Management: Project Execution (Part I: Redefining Projects' Success I)

Mismanagement

A project is typically considered as successful if has met the beforehand defined objectives within the allocated budget, timeframe and expected quality levels. Any negative deviation from any of these equates with a project failure. In other words, the success or failure of a project is judged as black or white with no grays in between, which is utopic, especially for mid to big software projects, typically associated with lot of uncertainty. According to this definition a project which had a delay of a few months, or the budget was overrun by 10%, or the users got only 90% from the planned functionality, or any combination of these negative deviations, can be considered as failed.

If a small project needed 6 instead of 3 months to complete, which is normal for projects with reduced priority, as long the project costs haven’t changed, then the increase in duration can be ignored. In exchange, 3 months of a delay for a 2 years project is normal, especially when the project is complex. Even if additional costs incurred within this timeframe, as long they are a small percentage in comparison with the overall project costs, then the impact can be acceptable for the business. On the other side, when the delays have an exponential growth with further implications, then the problem changes dramatically.

Big projects have typically a strategic importance. It’s the case of ERP implementations, which besides the technology changes have in theory have the potential to transform an organization pushing it to reach further performance levels. Such projects are estimated to take on average one to two years for a medium organization, however the delays can easily reach 50% to 100% from the initial estimation. Independently of what caused the delay, as long the organization achieved the intended goals and can cover project’s costs, one can say that the project made a (positive) difference.

Independently of project’s size, if 90% of the important functionality is available, then more likely the 10% can be covered in a first step with manual work, following in time to further invest into the system as part of a continuous improvement process. It’s maybe not ideal for the users, however the approach incorporates also the learning curve of working with the system and understanding ist possibilities and limitations. Of course, when the percentage of the available functionality decreases below a given limit, system’s acceptance is endangered, which users eventually start looking for alternatives.

There are also projects which opened the door to new possibilities and which require more investments to leverage the full capabilities. Some ERP implementations have this potential, despite overruns. Some of such investments are entitled while others are not. Related to this last category, there are projects which are on time, on budget, and the deliverables satisfy the quality criteria and objectives, however they make no difference for the organization despite the important investments made. Sure, some of the projects from this category are a must (e.g. updates, upgrade, technology changes), however there are also projects which can be considered as self-occupational hazard. In extremis such projects run in the background and cost organizations lot of energy and resources, while their effects are questionable.

At least from these examples the definition of a project's success needs to be changed or maybe standardized to consider not only intrinsic but also extrinsic aspects. In theory, that is the role of a Project Management Office (PMO), however it’s challenging to find an evaluation methodology that fits all needs. Further on, from same considerations, benchmarking projects across organizations and industries can prove to be a foolhardy attempt.

07 July 2020

🪄SSRS: Graphical Representations II (Sixth Magic Class)

Introduction 

Using a single chart to display multiple series in SQL Server Reporting Services (SSRS) or any other reporting tool works well when the number of series is somehow manageable - usually being enough to display 2-10 series within the same chart. The more series one adds, the more complicated will be for users to read the chart. One has the choice to find either
-  a level of detail (e.g. Category) which, when grouping the data, leads to a number of manageable series,
-  compare the data within a certain grouping (e.g. Category),
-  displaying the individual trends (e.g. for each Product). 

Let's consider the last choice. The report from this post will display the Sales Volume per Product and Year/Month of the Sales Orders available in the AdventureWorks2014 database. The logic uses the Sales.SalesOrderDetail and Sales.SalesOrderHeader tables, respectively the Production.vProducts view created in a previous post

Note:
A Sales Volume report is more appropriate to be built using a data warehouse's data, which are already aggregated and prepared for such reports. There's actually an AdventureWorksDW2014 data warehouse model made available which can be used to display the same information, however the intent is to demonstrate the techniques of working with data in an OLTP environment. 

Preparing the Data

Creating a view to build the Sales Orders details is usually recommended, though for the current report we just need the Product Category, Subcategory, Number and Name, respectively Sales Date, Quantity and Value, which is only a small part from the attributes available. Another choice to consider is whether to use the raw data, though then the number of records sent to the client can be considerably high, or aggregate the data and the lowermost level of detail needed for the report, in this case the Category, Subcategory, Product, Month and Year:


-- Sales volume per Product   
SELECT ITM.Category
, ITM.Subcategory
, ITM.ProductNumber
, ITM.Name
, Month(SOH.OrderDate) [Month]
, Year(SOH.OrderDate) [Year]
, Sum(SOD.OrderQty) OrderQty
, Sum(SOD.LineTotal) OrderValue
FROM Sales.SalesOrderDetail SOD
     JOIN Sales.SalesOrderHeader SOH
       ON SOD.SalesOrderID = SOH.SalesOrderID
     JOIN Production.vProducts ITM
       ON SOD.ProductId = ITM.Productid 
WHERE ITM.ProductNumber IN ('BB-7421', 'BB-9108')
GROUP BY ITM.Category
, ITM.Subcategory
, ITM.ProductNumber
, ITM.Name
, Month(SOH.OrderDate)
, Year(SOH.OrderDate)
ORDER BY ITM.Category
, ITM.Subcategory
, ITM.ProductNumber
, [Year]
, [Month]

The query contains all the needed data, however one could have more flexibility if the data would contain cumulative or total values as well: 


-- Sales volume per Product (extended)  
SELECT SOD.Category
, SOD.Subcategory
, SOD.ProductNumber
, SOD.Name
, SOD.[Month]
, SOD.[Year]
, SOD.OrderQty
, SOD.OrderValue
, SUM(SOD.OrderQty) OVER (PARTITION BY SOD.ProductNumber) TotalQty
, SUM(SOD.OrderValue) OVER (PARTITION BY SOD.ProductNumber) TotalValue
, SUM(SOD.OrderQty) OVER (PARTITION BY SOD.ProductNumber ORDER BY [Year], [Month]) CumulatedQty
, SUM(SOD.OrderValue) OVER (PARTITION BY SOD.ProductNumber ORDER BY [Year], [Month]) CumulatedValue
FROM (-- cumulated values
 SELECT ITM.Category
 , ITM.Subcategory
 , ITM.ProductNumber
 , ITM.Name
 , Month(SOH.OrderDate) [Month]
 , Year(SOH.OrderDate) [Year]
 , Sum(SOD.OrderQty) OrderQty
 , Sum(SOD.LineTotal) OrderValue
 FROM Sales.SalesOrderDetail SOD
   JOIN Sales.SalesOrderHeader SOH
    ON SOD.SalesOrderID = SOH.SalesOrderID
   JOIN [Production].[vProducts] ITM
     ON SOD.ProductId = ITM.Productid 
 WHERE ITM.ProductNumber IN ('BB-7421', 'BB-9108')
 GROUP BY ITM.Category
    , ITM.Subcategory
 , ITM.ProductNumber
 , ITM.Name
 , Month(SOH.OrderDate)
 , Year(SOH.OrderDate)
  ) SOD
ORDER BY SOD.Category
, SOD.Subcategory
, SOD.ProductNumber
, SOD.[Year]
, SOD.[Month]
In the end one can use any of the above queries.
Note:When prototyping a report is usually recommended to consider only a small number of records (e.g. only two Products). In addition, do not forget to validate the number or records considered by the logic:

-- checking the view for internal data consistency
SELECT count(*)
FROM Sales.SalesOrderDetail SOD
     JOIN Sales.SalesOrderHeader SOH
   ON SOD.SalesOrderID = SOH.SalesOrderID
  JOIN Production.vProducts ITM
    ON SOD.ProductId = ITM.Productid 
Creating the Report
Using the Report Wizard create a new matrix report called "Sales Volume per Product" based on either of the above queries (I considered the second). Within "Design the Matrix" select the attributes as follows:
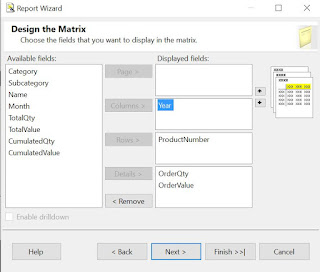
Design the Matrix

This will create the backbone for our report:
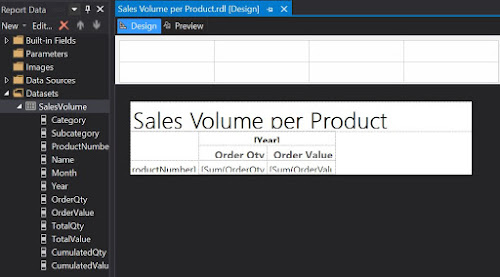
First draft in Design mode

Which is pretty basic, if we consider the output:

First draft in Preview mode

Now, returning in Design mode, right click on the "Sum of OrderQty" cell and from the floating menu select Insert/Chart, while from the list of available charts select Line. Do the same for "Sum of OrderValue". And here's the result:
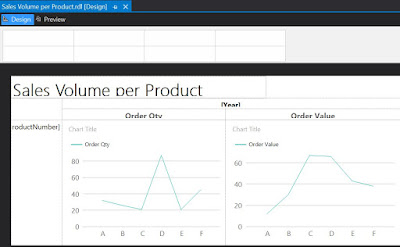
Second draft in Design mode

As only one series will be displayed, select the Chart Title and delete the respective label. Delete the Series label as well. When running the report you'll observe that the horizontal axis values are not really appealing. To dix this right click on the respective area and from the floating menu select Horizontal Axis Properties. Within Axis Options section change the Axis type as 'Scalar', enter '1' as Minimum, '12' as Maximum, '1' as Interval and 'Number' as Interval type:
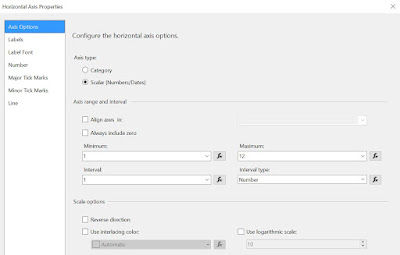
Horizontal Axis Properties

In the same window, within the Labels section select 'Enable auto-fit' and uncheck the "Labels can be offset", respectively the "Labels can be rotated" checkboxes. 

To include the Category, Subcategory and eventually the Product Name, select the Product Number cell, right click on it, and from the floating menu select Insert Column/Inside Group - Left, then select from the Category as attribute:
Inserting a column within the group

Repeat the process to add the Subcategory. Eventually you can add also the Product Name, though for it you'll have to select "Inside Group - Right". 

To improve the design, you can add a Page Header and move the report's title into it add a timestamp, respectively a page count textbox, resize the boxes to fit the columns. You can also align the column header values to the center, change the font to 10pt, etc.
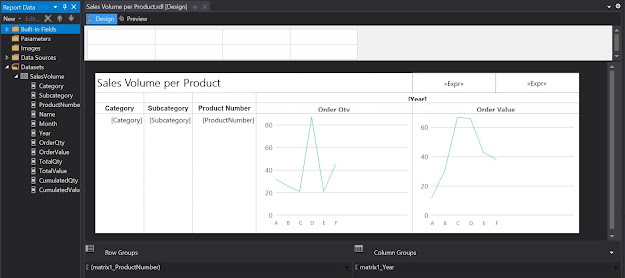
Third draft in Design mode

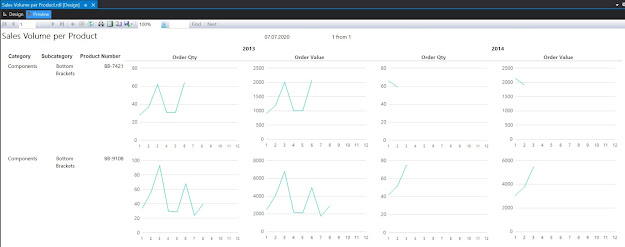
Here's the report in preview mode:

Third draft in Preview mode

One can use the report the way it is, or add the Category and Subcategory as parameters. Similarly, one can use the cumulative values as input for the charts. 

Revamping the Report with Sparklines

Even if the charts allow displaying the scales, the problem with them is that they are too big, which makes it difficult to compare the data across records. One can correct this by using the other types of graphics available in reports, e.g. sparklines. For this make a copy of the report already built, and within the Detail cells select a Sparkine Column instead of a chart:

Sparkline types


In comparison with Lines, Column-based representations allow to see how many data points are represented. Because spartklines are more compact as graphic forms, you can resize the cells as follows:

Fourth draft in Design mode

And here's the report in preview mode (the constraints from the source query were removed):
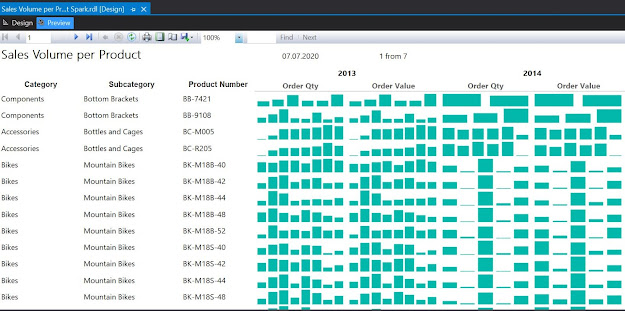
Fourth draft in Preview mode

As can be seen one can easily identify the trends however the volume scale was lost, being impossible to compare which of the Products sold better. One can bring the Total Quantity and Value as display information and sort the dataset from the highest to lowest value. One can even select a top x, to reduce the focus only to the most sold Products.

If the prices remained relatively constant over time, there's actually almost no difference between the graphic displays for Order Quantity, respectively for Order Value. Therefore one can remove one of them (e.g. Order Quantity). Being more compact, sparkline-based representations allow to better use the space, therefore you can add more fields into the report. 

Happy coding!

06 July 2020

🪄SSRS: Graphical Representations I (SQL Server CPU Utilization)

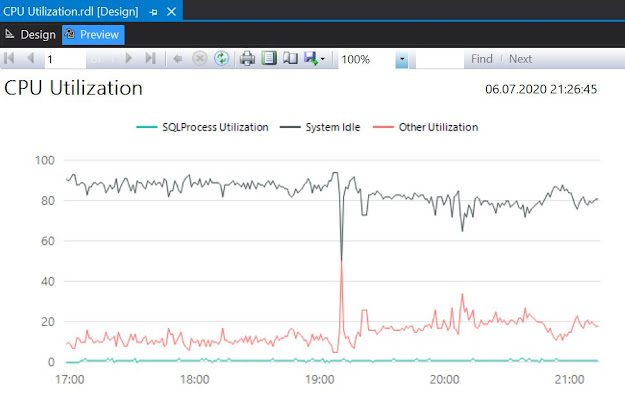
As described in a previous post, the Scheduler Monitor buffer exposed via the sys.dm_os_ring_buffers  data management view (DMV) provides a history of 4 hours uptime with minute by minute data points (in total 256 entries) with the CPU utilization for the SQL Server, other processes, respectively the system idle time as percentages. SSRS is ideal for showing the respective information within a chart.

For this create a new report (e.g. CPU Utilization) by using the Report Wizard based on the following query: 

-- cpu utilization for SQL Server and other applications
DECLARE @ts_now bigint = (SELECT cpu_ticks/(cpu_ticks/ms_ticks)
        FROM sys.dm_os_sys_info); 

SELECT DAT.record_id
, DAT.EventTime
, DAT.SQLProcessUtilization 
, DAT.SystemIdle 
, 100 - (DAT.SystemIdle + DAT.SQLProcessUtilization) OtherUtilization
FROM ( 
 SELECT record.value('(./Record/@id)[1]', 'int') record_id
 , record.value('(./Record/SchedulerMonitorEvent/SystemHealth/SystemIdle)[1]', 'int') SystemIdle 
 , record.value('(./Record/SchedulerMonitorEvent/SystemHealth/ProcessUtilization)[1]', 'int') SQLProcessUtilization
 , EventTime 
 FROM ( 
  SELECT DATEADD(ms, -1 * (@ts_now - [timestamp]), GETDATE()) EventTime
  , [timestamp]
  , CONVERT(xml, record) AS [record] 
  FROM sys.dm_os_ring_buffers 
  WHERE ring_buffer_type = N'RING_BUFFER_SCHEDULER_MONITOR' 
    AND record LIKE N'%<SystemHealth>%') AS x 
 ) AS DAT
ORDER BY DAT.record_id DESC;

After creating the report delete the available table and add a chart by right-clicking inside the report and from the floating menu choose Inser/Chart. Within the Select Chart Type select Line/Shape as chart type:


Resize the chart to provide an acceptable level of detail, then click within the chart area and add the SQLProcesUtilization, SystemIdle and OtherUtilization as values Values, respectively the EventTime as Category Group. 


It is needed to edit horizontal's axis properties - select the respective region and from the floating menu chose Horizontal Axis Properties. Within Axis Options chose Scalar as axis type, ideal for numeric and date values:
Axis Options

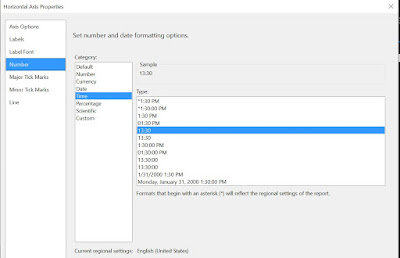
Within the Number section select the Time as category and provide the type as below (e.g. 13:30):

Number Section

As last change, add a header, move report's title within the header and add a text box next to it with the following formula to show the time when the report was run:
= Now().ToString("dd.MM.yyyy HH:mm:ss")

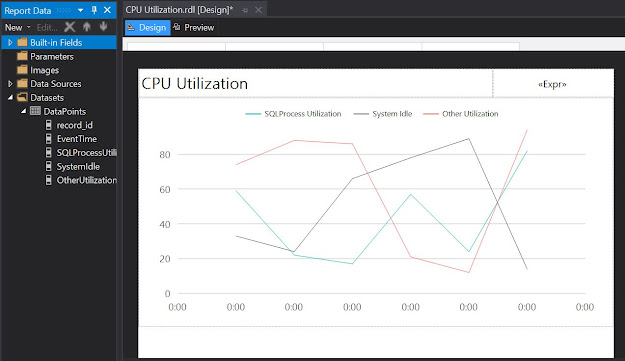
With these changes the report is set to be run:

Design mode

Here's the preview

Preview mode

Unfortunately the default choice of colors is not really ideal as red is used for warnings, and green for positive trends, which is not necessarily the case for a CPU's utilization. 

One can play with the various chart types, for example by selecting the chart area and changing the chart type as Area/Range one can obtain the following chart (it is needed to change the Axis Type as Scalar again):


Happy coding!

Related Posts Plugin for WordPress, Blogger...

About Me

My photo
Koeln, NRW, Germany
IT Professional with more than 24 years experience in IT in the area of full life-cycle of Web/Desktop/Database Applications Development, Software Engineering, Consultancy, Data Management, Data Quality, Data Migrations, Reporting, ERP implementations & support, Team/Project/IT Management, etc.