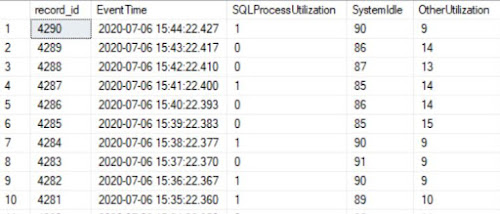
-- cpu utilization for SQL Server and other applications
DECLARE @ts_now bigint = (SELECT cpu_ticks/(cpu_ticks/ms_ticks)
        FROM sys.dm_os_sys_info);

SELECT DAT.record_id
, DAT.EventTime
, DAT.SQLProcessUtilization
, DAT.SystemIdle
, 100 - (DAT.SystemIdle + DAT.SQLProcessUtilization) OtherUtilization
FROM (
	SELECT record.value('(./Record/@id)[1]', 'int') record_id
	, record.value('(./Record/SchedulerMonitorEvent/SystemHealth/SystemIdle)[1]', 'int') SystemIdle
	, record.value('(./Record/SchedulerMonitorEvent/SystemHealth/ProcessUtilization)[1]', 'int') SQLProcessUtilization
	, EventTime
	FROM (
		SELECT DATEADD(ms, -1 * (@ts_now - [timestamp]), GETDATE()) EventTime
		, [timestamp]
		, CONVERT(xml, record) AS [record]
		FROM sys.dm_os_ring_buffers
		WHERE ring_buffer_type = N'RING_BUFFER_SCHEDULER_MONITOR'
		  AND record LIKE N'%<SystemHealth>%') AS x
	) AS DAT
ORDER BY DAT.record_id DESC;
 |
| CPU Utilization for my home SQL Server lab |
-- dropping the table
-- DROP TABLE IF EXISTS dbo.T_RingBufferReadings

-- reinitilizing the history
-- TRUNCATE TABLE dbo.T_RingBufferReadings

-- creating the table
CREATE TABLE dbo.T_RingBufferReadings (
  Id bigint IDENTITY (1,1) NOT NULL
, RecordId bigint
, EventTime datetime2(3) NOT NULL
, SQLProcessUtilization int NOT NULL
, SystemIdle int NOT NULL
, OtherUtilization int NOT NULL
)


-- reviewing the data
SELECT *
FROM dbo.T_RingBufferReadings
ORDER BY EventTime DESC
If there are many records, to improve the performance, one can create also an index, which can include the reading points as well:
-- creating a unique index with an include
CREATE UNIQUE NONCLUSTERED INDEX [UI_T_RingBufferReadings_EventTime] ON dbo.T_RingBufferReadings
(
	EventTime ASC,
    RecordId ASC
) INCLUDE (SQLProcessUtilization, SystemIdle, OtherUtilization)
GO
The above query based on the DMV becomes:
-- cpu utilization by SQL Server and other applications
DECLARE @ts_now bigint = (SELECT cpu_ticks/(cpu_ticks/ms_ticks)
        FROM sys.dm_os_sys_info);

INSERT INTO dbo.T_RingBufferReadings
SELECT record_id
, DAT.EventTime
, DAT.SQLProcessUtilization
, DAT.SystemIdle
, 100 - (DAT.SystemIdle + DAT.SQLProcessUtilization) OtherUtilization
FROM (
	SELECT record.value('(./Record/@id)[1]', 'int') record_id
	, record.value('(./Record/SchedulerMonitorEvent/SystemHealth/SystemIdle)[1]', 'int') SystemIdle
	, record.value('(./Record/SchedulerMonitorEvent/SystemHealth/ProcessUtilization)[1]', 'int') SQLProcessUtilization
	, EventTime
	FROM (
		SELECT DATEADD(ms, -1 * (@ts_now - [timestamp]), GETDATE()) EventTime
		, [timestamp]
		, CONVERT(xml, record) AS [record]
		FROM sys.dm_os_ring_buffers
		WHERE ring_buffer_type = N'RING_BUFFER_SCHEDULER_MONITOR'
		  AND record LIKE N'%<SystemHealth>%') AS x
	) AS DAT
	LEFT JOIN dbo.T_RingBufferReadings RBR
	  ON DAT.record_id = RBR.Recordid
WHERE RBR.Recordid IS NULL
ORDER BY DAT.record_id DESC;
Note:
A ServerName column can be added to the table if is needed to store the values for different SQL Servers. Then the LEFT JOIN has to consider the new added column.
Either of the two queries can be used to display the data points within a chart via SSRS, Power BI or any reporting tool available.
Happy coding!
References:
[1] Grant Fritchey (2014) SQL Server Query Performance Tuning: Troubleshoot and Optimize Query Performance in SQL Server 2014, 4th Ed.
[2] Sunil Agarwal et al (2005), Troubleshooting Performance Problems in SQL Server 2005, Source: TShootPerfProbs.docx
[3] Sunil Agarwal et al (2008), Troubleshooting Performance Problems in SQL Server 2008, Source: TShootPerfProbs2008.docx
[4] Microsoft SQL Docs (2018) Related Dynamic Management Views, Source
[5] Microsoft SQL Docs (2017) Use ring buffers to obtain health information about Always On availability groups, Source

No comments:
Post a Comment