11 March 2024

🧭🚥Business Intelligence: Key Performance Indicators [KPI] (Between Certainty and Uncertainty)

Business Intelligence
Business Intelligence Series

Despite the huge collection of documented Key Performance Indicators (KPIs) and best practices on which KPIs to choose, choosing a reliable set of KPIs that reflect how the organization performs in achieving its objectives continues to be a challenge for many organizations. Ideally, for each objective there should be only one KPIs that reflects the target and the progress made, though is that realistic?

Let's try to use the driver's metaphor to exemplify several aspects related to the choice of KPIs. A driver's goal is to travel from point A to point B over a distance d in x hours. The goal is SMART (Specific, Measurable, Achievable, Relevant, and Time-bound) if the speed and time are realistic and don't contradict Physics, legal or physical laws. The driver can define the objective as "arriving on time to the destination". 

One can define a set of metrics based on the numbers that can be measured. We have the overall distance and the number of hours planned, from which one can derive an expected average speed v. To track a driver's progress over time there are several metrics that can be thus used: e.g., (1) the current average speed, (2) the number of kilometers to the destination, (3) the number of hours estimated to the destination. However, none of these metrics can be used alone to denote the performance alone. One can compare the expected with the current average speed to get a grasp of the performance, and probably many organizations will use only (1) as KPI, though it's needed to use either (2) or (3) to get the complete picture. So, in theory two KPIs should be enough. Is it so?

When estimating (3) one assumes that there are no impediments and that the average speed can be attained, which might be correct for a road without traffic. There can be several impediments - planned/unplanned breaks, traffic jams, speed limits, accidents or other unexpected events, weather conditions (that depend on the season), etc. Besides the above formula, one needs to quantify such events in one form or another, e.g., through the perspective of the time added to the initial estimation from (3). However, this calculation is based on historical values or navigator's estimation, value which can be higher or lower than the final value. 

Therefore, (3) is an approximation for which is needed also a confidence interval (± t hours). The value can still include a lot of uncertainty that maybe needs to be broken down and quantified separately upon case to identify the deviation from expectations, e.g. on average there are 3 traffic jams (4), if the road crosses states or countries there may be at least 1 control on average (5), etc. These numbers can be included in (3) and the confidence interval, and usually don't need to be reported separately, though probably there are exceptions. 

When planning, one needs to also consider the number of stops for refueling or recharging the car, and the average duration of such stops, which can be included in (3) as well. However, (3) slowly becomes  too complex a formula, and even if there's an estimation, the more facts we're pulling into it, the bigger the confidence interval's variation will be. Sometimes, it's preferable to have instead two-three other metrics with a low confidence interval than one with high variation. Moreover, the longer the distance planned, the higher the uncertainty. One thing is to plan a trip between two neighboring city, and another thing is to plan a trip around the world. 

Another assumption is that the capability of the driver/car to drive is the same over time, which is not always the case. This can be neglected occasionally (e.g. one trip), though it involves a risk (6) that might be useful to quantify, especially when the process is repeatable (e.g. regular commuting). The risk value can increase considering new information, e.g. knowing that every a few thousand kilometers something breaks, or that there's a traffic fine, or an accident. In spite of new information, the objective might also change. Also, the objective might suffer changes, e.g. arrive on-time safe and without fines to the destination. As the objective changes or further objectives are added, more metrics can be defined. It would make sense to measure how many kilometers the driver covered in a lifetime with the car (7), how many accidents (8) or how many fines (9) the driver had. (7) is not related to a driver's performance, but (8) and (9) are. 

As can be seen, simple processes can also become very complex if one attempts to consider all the facts and/or quantify the uncertainty. The driver's metaphor applies to a simple individual, though once the same process is considered across the whole organization (a group of drivers), the more complexity is added and the perspective changes completely. E.g., some drivers might not even reach the destination or not even have a car to start with, and so on. Of course, with this also the objectives change and need to be redefined accordingly. 

The driver's metaphor is good for considering planning activities in which a volume of work needs to be completed in a given time and where a set of constraints apply. Therefore, for some organizations, just using two numbers might be enough for getting a feeling for what's happening. However, as soon one needs to consider other aspects like safety or compliance (considered in aggregation across many drivers), there might be other metrics that qualify as KPIs.

It's tempting to add two numbers and consider for example (8) and (9) together as the two are events that can be cumulated, even if they refer to different things that can overlap (an accident can result in a fine and should be counted maybe only once). One needs to make sure that one doesn't add apples with juice - the quantified values must have the same unit of measure, otherwise they might need to be considered separately. There's the tendency of mixing multiple metrics in a KPI that doesn't say much if the units of measure of its components are not the same. Some conversions can still be made (e.g. how much juice can be obtained from apples), though that's seldom the case.

Previous Post <<||>> Next Post

10 March 2024

🏭📑Microsoft Fabric: Medallion Architecture [Notes]

Disclaimer: This is work in progress intended to consolidate information from various sources for learning purposes. For the latest information please consult the documentation (see the links below)! 

Last updated: 10-Mar-2024

Medallion Architecture in Microsoft Fabric [1]


Medallion architecture
  • a recommended data design pattern used to organize data in a lakehouse logically [2]
    • compatible with the concept of data mesh
  • {goal} incrementally and progressively improve the structure and quality of data as it progresses through each stage [1]
    • brings structure and efficiency to a lakehouse environment [2]
    • ensures that data is reliable and consistent as it goes through various checks and changes [2]
    •  complements other data organization methods, rather than replacing them [2]
  • consists of three distinct layers (or zones)
    • {layer} bronze (aka raw zone
      • stores source data in its original format [1]
      • the data in this layer is typically append-only and immutable [1]
      • {recommendation} store the data in its original format, or use Parquet or Delta Lake [1]
      • {recommendation} create a shortcut in the bronze zone instead of copying the data across [1]
        • works with OneLake, ADLS Gen2, Amazon S3, Google
      • {operation} ingest data
        • {characteristic} maintains the raw state of the data source [3]
        • {characteristic} is appended incrementally and grows over time [3]
        • {characteristic} can be any combination of streaming and batch transactions [3]
        • ⇒ retaining the full, unprocessed history
          • ⇒ provides the ability to recreate any state of a given data system [3]
        • additional metadata may be added to data on ingest
            • e.g. source file names, recording the time data was processed
          • {goal} enhanced discoverability [3]
          • {goal} description of the state of the source dataset [3]
          • {goal} optimized performance in downstream applications [3]
    • {layer} silver (aka enriched zone
      • stores data sourced from the bronze layer
      • the raw data has been 
        • cleansed
        • standardized
        • structured as tables (rows and columns)
        • integrated with other data to provide an enterprise view of all business entities
      • {recommendation} use Delta tables 
        • provide extra capabilities and performance enhancements [1]
          • {default} every engine in Fabric writes data in the delta format and use V-Order write-time optimization to the Parquet file format [1]
      • {operation} validate and deduplicate data
      • for any data pipeline, the silver layer may contain more than one table [3]
    • {layer} gold (aka curated zone)
      • stores data sourced from the silver layer [1]
      • the data is refined to meet specific downstream business and analytics requirements [1]
      • tables typically conform to star schema design
        • supports the development of data models that are optimized for performance and usability [1]
      • use lakehouses (one for each zone), a data warehouse, or combination of both
        • the decision should be based on team's preference and expertise of your team. 
        • different analytic engines can be used [1]
    • ⇐ schemas and tables within each layer can take on a variety of forms and degrees of normalization [3]
      • depends on the frequency and nature of data updates and the downstream use cases for the data [3]
  • {pattern} create each zone as a lakehouse
    • business users access data by using the SQL analytics endpoint [1]
  • {pattern} create the bronze and silver zones as lakehouses, and the gold zone as data warehouse
    • business users access data by using the data warehouse endpoint [1]
  • {pattern} create all lakehouses in a single Fabric workspace
    • {recommendation} create each lakehouse in its own workspace [1]
    • provides more control and better governance at the zone level [1]
  • {concept} data transformation 
    • involves altering the structure or content of data to meet specific requirements [2] 
      • via Dataflows (Gen2), notebooks
  • {concept} data orchestration 
    • refers to the coordination and management of multiple data-related processes, ensuring they work together to achieve a desired outcome [2]
      • via data pipelines

Previous Post  <<||>>  Next Post

Acronyms:
ADLS - Azure Data Lake Store Gen2

References:
[1] Microsoft Learn: Fabric (2023) Implement medallion lakehouse architecture in Microsoft Fabric (link)
[2] Microsoft Learn: Fabric (2023) Organize a Fabric lakehouse using medallion architecture design (link)
[3] Microsoft Learn: Azure (2023) What is the medallion lakehouse architecture? (link)

Resources:
[R1] Serverless.SQL (2023) Data Loading Options With Fabric Workspaces, by Andy Cutler (link)
[R2] Microsoft Learn: Fabric (2023) Lakehouse end-to-end scenario: overview and architecture (link)

🏭📑Microsoft Fabric: Lakehouse [Notes]

Disclaimer: This is work in progress intended to consolidate information from various sources for learning purposes. For the latest information please consult the documentation (see the links below)! 

Last updated: 10-Mar-2024

[Microsoft Fabric] Lakehouse

  • a unified platform that combines the capabilities of 
    • data lake
      • built on top of the OneLake scalable storage layer using and Delta format tables [1]
        • support ACID  transactions through Delta Lake formatted tables for data consistency and integrity [1]
          • ⇒ scalable analytics solution that maintains data consistency [1]
      • {capability} scalable, distributed file storage
        • can scale automatically and provide high availability and disaster recovery [1]
      • {capability} flexible schema-on-read semantics
        • ⇒ the schema can be changed as needed [1]
        • ⇐ rather than having a predefined schema
      • {capability} big data technology compatibility
        • store all data formats 
        • can be used with various analytics tools and programming languages
        • use Spark and SQL engines to process large-scale data and support machine [1] learning or predictive modeling analytics
    • data warehouse
      • {capability} relational schema modeling
      • {capability} SQL-based querying
        • {feature} has a built-in SQL analytics endpoint
          • ⇐ the data can be queried by using SQL without any special setup [2]
      • {capability} proven basis for analysis and reporting
      • ⇐ unlocks data warehouse capabilities without the need to move data [2]
    • ⇐ a database built on top of a data lake 
      • ⇐  includes metadata
    • ⇐ a data architecture platform for storing, managing, and analyzing structured and unstructured data in a single location [2]
      • ⇒ single location for data engineers, data scientists, and data analysts to access and use data [1]
      • ⇒ it can easily scale to large data volumes of all file types and sizes
      • ⇒ it's easily shared and reused across the organization
  • supports data governance policies [1]
    • e.g. data classification and access control
  • can be created in any premium tier workspace [1]
    • appears as a single item within the workspace in which was created [1]
      • ⇒ access is controlled at this level as well [1]
        • directly within Fabric
        • via the SQL analytics endpoint
  • permissions are granted either at the workspace or item level [1]
  • users can work with data via
    • lakehouse UI
      • add and interact with tables, files, and folders [1]
    • SQL analytics endpoint 
      • enables to use SQL to query the tables in the lakehouse and manage its relational data model [1]
  • two physical storage locations are provisioned automatically
    • tables
      • a managed area for hosting tables of all formats in Spark
        • e.g. CSV, Parquet, or Delta
      • all tables are recognized as tables in the lakehouse
      • delta tables are recognized as tables as well
    • files 
      • an unmanaged area for storing data in any file format [2]
      • any Delta files stored in this area aren't automatically recognized as tables [2]
      • creating a table over a Delta Lake folder in the unmanaged area requires to explicitly create a shortcut or an external table with a location that points to the unmanaged folder that contains the Delta Lake files in Spark [2]
    • ⇐ the main distinction between the managed area (tables) and the unmanaged area (files) is the automatic table discovery and registration process [2]
      • {concept} registration process
        • runs over any folder created in the managed area only [2]
  • {operation} ingest data into lakehouse
    • {medium} manual upload
      • upload local files or folders to the lakehouse
    • {medium} dataflows (Gen2)
      • import and transform data from a range of sources using Power Query Online, and load it directly into a table in the lakehouse [1]
    • {medium} notebooks
      • ingest and transform data, and load it into tables or files in the lakehouse [1]
    • {medium} Data Factory pipelines
      • copy data and orchestrate data processing activities, loading the results into tables or files in the lakehouse [1]
  • {operation} explore and transform data
    • {medium} notebooks
      •  use code to read, transform, and write data directly to the lakehouse as tables and/or files [1]
    • {medium} Spark job definitions
      • on-demand or scheduled scripts that use the Spark engine to process data in the lakehouse [1]
    • {medium} SQL analytic endpoint: 
      • run T-SQL statements to query, filter, aggregate, and otherwise explore data in lakehouse tables [1]
    • {medium} dataflows (Gen2): 
      • create a dataflow to perform subsequent transformations through Power Query, and optionally land transformed data back to the lakehouse [1]
    • {medium} data pipelines: 
      • orchestrate complex data transformation logic that operates on data in the lakehouse through a sequence of activities [1]
        • (e.g. dataflows, Spark jobs, and other control flow logic).
  • {operation} analyze and visualize data
    • use the semantic model as the source for Power BI reports 
  • {concept} shortcuts
    • embedded references within OneLake that point to other files or storage locations
    • enable to integrate data into lakehouse while keeping it stored in external storage [1]
      • ⇐ allow to quickly source existing cloud data without having to copy it
      • e.g. different storage account or different cloud provider [1]
      • the user must have permissions in the target location to read the data [1]
      • data can be accessed via Spark, SQL, Real-Time Analytics, and Analysis Services
    • appear as a folder in the lake
    • {limitation} have limited data source connectors
      • {alternatives} ingest data directly into your lakehouse [1]
    • enable Fabric experiences to derive data from the same source to always be in sync
  • {concept} Lakehouse Explorer
    • enables to browse files, folders, shortcuts, and tables; and view their contents within the Fabric platform [1]

References:
[1] Microsoft Learn: Fabric (2023) Get started with lakehouses in Microsoft Fabric (link)
[2] Microsoft Learn: Fabric (2023) Implement medallion lakehouse architecture in Microsoft Fabric (link)

🏭🗒️Microsoft Fabric: Dataflows Gen 1 [Notes]

Disclaimer: This is work in progress intended to consolidate information from various sources. 

Last updated: 10-Mar-2024

Dataflows Architecture in Power BI
Dataflows Architecture [3]

[Microsoft Fabric] Dataflow (Gen1)

  • a type of cloud-based ETL tool for building and executing scalable data transformation processes [1]
  • a collection of tables created and managed in workspaces in the Power BI service [4]
  • acts as building blocks on top of one another [4]
  • includes all of the transformations to reduce data prep time and then can be loaded into a new table, included in a Data Pipeline, or used as a data source by data analysts [1]
  • {benefit} promote reusability of underlying data elements
    • prevent the need to create separate connections with your cloud or on-premises data sources.
  • supports a wide range of cloud and on-premises sources [3]
  • {operation} refreshing a dataflow 
    • is required before it can be consumed in a semantic model in Power BI Desktop, or referenced as a linked or computed table [4]
    • can be refreshed at the same frequency as a semantic model [4]
    • {concept} incremental refresh
    • [Premium capacity] can be set to refresh incrementally
      • adds parameters to the dataflow to specify the date range
      • {contraindication} linked tables shouldn't use incremental refresh if they reference a dataflow
        • ⇐ dataflows don't support query folding (even if the table is DirectQuery enabled).
      • {contraindication} semantic models referencing dataflows shouldn't use incremental refresh
        • ⇐ refreshes to dataflows are generally performant, so incremental refreshes shouldn't be necessary
        • if refreshes take too long, consider using the compute engine, or DirectQuery mode
  • {operation} deleting a workflow
    • if a workspace that contains dataflows is deleted, all its dataflows are also deleted [4]
      • even if recovery of the workspace is possible, one cannot recover the deleted dataflows
        • ⇐ either directly or through support from Microsoft [4]
  • {operation} consuming a dataflow
    • create a linked table from the dataflow
    • allows another dataflow author to use the data [4]
    • create a semantic model from the dataflow
    • allows a user to utilize the data to create reports [4]
    • create a connection from external tools that can read from the CDM format [4]
  • {feature} [premium] Enhanced compute engine.
    • enables premium subscribers to use their capacity to optimize the use of dataflows
    • {advantage} reduces the refresh time required for long-running ETL steps over computed entities, such as performing joins, distinct, filters, and group by [7]
    • {advantage} performs DirectQuery queries over entities [7]
    • individually set for each dataflow
    • {configuration} disabled
    • {configuration|default} optimized
      • automatically turned on when a table in the dataflow is referenced by another table or when the dataflow is connected to another dataflow in the same workspace.
    • {configuration} On
    • {limitation} works only for A3 or larger Power BI capacities [7]
  • {feature} [premium] DirectQuery
    • allows to use DirectQuery to connect directly to dataflows without having to import its data [7]
  • {advantage} avoid separate refresh schedules 
    • removes the need to create an imported semantic model [7]
  • {advantage} filtering data 
    • allows to filter dataflow data and work with the filtered subset [7]
    • {limitation} composite/mixed models that have import and DirectQuery data sources are currently not supported [7]
    • {limitation} large dataflows might have trouble with timeout issues when viewing visualizations [7]
      • {workaround} use Import mode [7]
    • {limitation} under data source settings, the dataflow connector will show invalid credentials [7]
      • the warning doesn't affect the behavior, and the semantic model will work properly [7]
  • {feature} [premium] Computed entities
    • allows to perform calculations on your existing dataflows, and return results [7]
    • enable to focus on report creation and analytics [7]
    • {limitation} work properly only when the entities reside in the same storage account [7]
  • {feature} [premium] Linked Entities
    • allows to reference existing dataflows
    • one can perform calculations on these entities using computed entities [7]
    • allows to create a "single source of the truth" table that can be reused within multiple dataflows [7]
    • {limitation} work properly only when the entities reside in the same storage account [7]
  • {feature} [premium] Incremental refresh
    • adds parameters to the dataflow to specify the date range [7]
  • {concept} table
    • represents the data output of a query created in a dataflow, after the dataflow has been refreshed
    • represents data from a source and, optionally, the transformations that were applied to it
  • {concept} computed tables
    • similar to other tables 
      • one get data from a source and one can apply further transformations to create them
    • their data originates from the storage dataflow used, and not the original data source [6]
      • ⇐ they were previously created by a dataflow and then reused [6]
    • created by referencing a table in the same dataflow or in a different dataflow [6]
  • {concept} [Power Query] custom function
    • a mapping from a set of input values to a single output value [5]
  • {scenario} create reusable transformation logic that can be shared by many semantic models and reports inside Power BI [3]
  • {scenario} persist data in ADL Gen 2 storage, enabling you to expose it to other Azure services outside Power BI [3]
  • {scenario} create a single source of truth
    • encourages uptake by removing analysts' access to underlying data sources [3]
  • {scenario} strengthen security around underlying data sources by exposing data to report creators in dataflows
    • allows to limit access to underlying data sources, reducing the load on source systems [3]
    • gives administrators finer control over data refresh operations [3]
  • {scenario} perform ETL at scale, 
    • dataflows with Power BI Premium scales more efficiently and gives you more flexibility [3]
  • {best practice} chose the best connector for the task provides the best experience and performance [5] 
  • {best practice} filter data in the early stages of the query
    • some connectors can take advantage of filters through query folding [5]
  • {best practice} do expensive operations last
    • help minimize the amount of time spend waiting for the preview to render each time a new step is added to the query [5]
  • {best practice} temporarily work against a subset of your data
    • if adding new steps to the query is slow, consider using "Keep First Rows" operation and limiting the number of rows you're working against [5]
  • {best practice} use the correct data types
    • some features are contextual to the data type [5]
  • {best practice} explore the data
  • {best practice} document queries by renaming or adding a description to steps, queries, or groups [5]
  • {best practice} take a modular approach
    • split queries that contains a large number of steps into multiple queries
    • {goal} simplify and decouple transformation phases into smaller pieces to make them easier to understand [5]
  • {best practice} future-proof queries 
    • make queries resilient to changes and able to refresh even when some components of data source change [5]
  • {best practice] creating queries that are dynamic and flexible via parameters [5]
    • parameters serves as a way to easily store and manage a value that can be reused in many different ways [5]
  • {best practice} create reusable functions
    • can be created from existing queries and parameters [5]

Acronyms:
CDM - Common Data Model
ETL - Extract, Transform, Load

References:
[1] Microsoft Learn: Fabric (2023) Ingest data with Microsoft Fabric (link)
[2] Microsoft Learn: Fabric (2023) Dataflow Gen2 pricing for Data Factory in Microsoft Fabric (link)
[3] Microsoft Learn: Fabric (2023) Introduction to dataflows and self-service data prep (link)
[4] Microsoft Learn: Fabric (2023) Configure and consume a dataflow (link)
[5] Microsoft Learn: Fabric (2023) Dataflows best practices* (link)
[6] Microsoft Learn: Fabric (2023) Computed table scenarios and use cases (link)
[7] Microsoft Lean: Power BI - Learn (2024) Premium features of dataflows (link

Resources:

🏭🗒️Microsoft Fabric: Dataflows Gen2 [Notes]

Disclaimer: This is work in progress intended to consolidate information from various sources for learning purposes. For the latest information please consult the documentation (see the links below)! 

Last updated: 10-Mar-2024

Dataflow (Gen2) Architecture [4]

[Microsoft Fabric] Dataflow (Gen2) 

  •  new generation of dataflows that resides alongside the Power BI Dataflow (Gen1) [2]
  • allows to 
    • extract data from various sources
    • transform it using a wide range of transformation operations 
    • load it into a destination [1]
  • {goal} provide an easy, reusable way to perform ETL tasks using Power Query Online [1]
    • allows to promote reusable ETL logic 
      • ⇒ prevents the need to create more connections to the data source.
      • offer a wide variety of transformations
    • can be horizontally partitioned
  • {component} Lakehouse 
    • used to stage data being ingested
  • {component} Warehouse 
    • used as a compute engine and means to write back results to staging or supported output destinations faster
  • {component} Mashup Engine
    • extracts, transforms, or loads the data to staging or data destinations when either [4]
      • Warehouse compute cannot be used [4]
      • staging is disabled for a query [4]
  • {operation} creating a dataflow
    • can be created in a
      • Data Factory workload
      • Power BI workspace
      • Lakehouse
  • {operation} publishing a dataflow
    • generates dataflow's definition  
      • ⇐ the program that runs once the dataflow is refreshed to produce tables in staging storage and/or output destination [4]
      • used by the dataflow engine to generate an orchestration plan, manage resources, and orchestrate execution of queries across data sources, gateways, and compute engines, and to create tables in either the staging storage or data destination [4]
    • saves changes and runs validations that must be performed in the background [2]
  • {operation} refreshing a dataflow
  • {operation} running a dataflow 
    • can be run
      • manually
      • on a refresh schedule
      • as part of a Data Pipeline orchestration
  • {feature} author dataflows with Power Query
    • uses the full Power Query experience of Power BI dataflows [2]
  • {feature} shorter authoring flow
    • uses step-by-step for getting the data into your the dataflow [2]
      • the number of steps required to create dataflows were reduced [2]
    • a few new features were added to improve the experience [2]
  • {feature} Auto-Save and background publishing
    • changes made to a dataflow are autosaved to the cloud (aka draft version of the dataflow) [2]
      • ⇐ without having to wait for the validation to finish [2]
    • {functionality} save as draft 
      • stores a draft version of the dataflow every time you make a change [2]
      • seamless experience and doesn't require any input [2]
    • {concept} published version
      • the version of the dataflow that passed validation and is ready to refresh [5]
  • {feature} integration with data pipelines
    • integrates directly with Data Factory pipelines for scheduling and orchestration [2] 
  • {feature} high-scale compute
    • leverages a new, higher-scale compute architecture [2] 
      •  improves the performance of both transformations of referenced queries and get data scenarios [2]
      • creates both Lakehouse and Warehouse items in the workspace, and uses them to store and access data to improve performance for all dataflows [2]
  • {feature} improved monitoring and refresh history
    • integrate support for Monitoring Hub [2]
    • Refresh History experience upgraded [2]
  • {feature} get data via Dataflows connector
    • supports a wide variety of data source connectors
      • include cloud and on-premises relational databases
  • {feature|planned} incremental refresh 
    • enables you to incrementally extract data from data sources, apply Power Query transformations, and load into various output destinations [5]
  • {feature|planned} Fast Copy 
    • enables large-scale data ingestion directly utilizing the pipelines Copy Activity capability [6]
    • supports sources such Azure SQL Databases, CSV, and Parquet files in Azure Data Lake Storage and Blob Storage [6]
    • significantly scales up the data processing capacity providing high-scale ELT capabilities [6]
  • {feature|planned}Cancel refresh
    • enables to cancel ongoing Dataflow Gen2 refreshes from the workspace items view [6]
  • {feature} data destinations
    • allows to 
      • specify an output destination
      • separate ETL logic and destination storage [2]
    • every tabular data query can have a data destination [3]
      • available destinations
        • Azure SQL databases
        • Azure Data Explorer (Kusto)
        • Fabric Lakehouse
        • Fabric Warehouse
        • Fabric KQL database
      • a destination can be specified for every query individually [3]
      • multiple different destinations can be used within a dataflow [3]
      • connecting to the data destination is similar to connecting to a data source
      • {limitation} functions and lists aren't supported
    • {operation} creating a new table
      • {default} table name has the same name as the query name.
    • {operation} picking an existing table
    • {operation} deleting a table manually from the data destination 
      • doesn't recreate the table on the next refresh [3]
    • {operation} reusing queries from Dataflow Gen1
      • {method} export Dataflow Gen1 query and import it into Dataflow Gen2
        • export the queries as a PQT file and import them into Dataflow Gen2 [2]
      • {method} copy and paste in Power Query
        • copy the queries and paste them in the Dataflow Gen2 editor [2]
    • automatic settings:
      • {limitation} supported only for Lakehouse and Azure SQL database
      • {setting} Update method replace: 
        • data in the destination is replaced at every dataflow refresh with the output data of the dataflow [3]
      • {setting} Managed mapping: 
        • the mapping is automatically adjusted when republishing the data flow to reflect the change 
          • ⇒ doesn't need to be updated manually into the data destination experience every time changes occur [3]
      • {setting} Drop and recreate table: 
        • on every dataflow refresh the table is dropped and recreated to allow schema changes
        • {limitation} the dataflow refresh fails if any relationships or measures were added to the table [3]
    • update methods
      • {method} replace: 
        • on every dataflow refresh, the data is dropped from the destination and replaced by the output data of the dataflow.
        • {limitation} not supported by Fabric KQL databases and Azure Data Explorer 
      • {method} append: 
        • on every dataflow refresh, the output data from the dataflow is appended (aka merged) to the existing data in the data destination table (aka upsert)
    • staging 
      • {default} enabled
        • allows to use Fabric compute to execute queries
          • ⇐ enhances the performance of query processing
        • the data is loaded into the staging location
          • ⇐ an internal Lakehouse location accessible only by the dataflow itself
        • [Warehouse] staging is required before the write operation to the data destination
          • ⇐ improves performance
          • {limitation} only loading into the same workspace as the dataflow is supported
        •  using staging locations can enhance performance in some cases
      • disabled
        • {recommendation} [Lakehouse] disable staging on the query to avoid loading twice into a similar destination
          • ⇐ once for staging and once for data destination
          • improves dataflow's performance
    • {scenario} use a dataflow to load data into the lakehouse and then use a notebook to analyze the data [2]
    • {scenario} use a dataflow to load data into an Azure SQL database and then use a data pipeline to load the data into a data warehouse [2]
  • {benefit} extends data with consistent data, such as a standard date dimension table [1]
  • {benefit} allows self-service users access to a subset of data warehouse separately [1]
  • {benefit} optimizes performance with dataflows, which enable extracting data once for reuse, reducing data refresh time for slower sources [1]
  • {benefit} simplifies data source complexity by only exposing dataflows to larger analyst groups [1]
  • {benefit} ensures consistency and quality of data by enabling users to clean and transform data before loading it to a destination [1]
  • {benefit} simplifies data integration by providing a low-code interface that ingests data from various sources [1]
  • {limitation} not a replacement for a data warehouse [1]
  • {limitation} row-level security isn't supported [1]
  • {limitation} Fabric or Fabric trial capacity workspace is required [1]


Feature Data flow Gen2 Dataflow Gen1
Author dataflows with Power Query
Shorter authoring flow
Auto-Save and background publishing
Data destinations
Improved monitoring and refresh history
Integration with data pipelines
High-scale compute
Get Data via Dataflows connector
Direct Query via Dataflows connector
Incremental refresh ✓*
Fast Copy ✓*
Cancel refresh ✓*
AI Insights support
Dataflow Gen1 vs Gen2 [2]


Acronyms:
ETL - Extract, Transform, Load
KQL - Kusto Query Language
PQO - Power Query Online
PQT - Power Query Template

References:
[1] Microsoft Learn: Fabric (2023) Ingest data with Microsoft Fabric (link)
[2] Microsoft Learn: Fabric (2023) Getting from Dataflow Generation 1 to Dataflow Generation 2 (link)
[3] Microsoft Learn: Fabric (2023) Dataflow Gen2 data destinations and managed settings (link)
[4] Microsoft Learn: Fabric (2023) Dataflow Gen2 pricing for Data Factory in Microsoft Fabric (link)
[5] Microsoft Learn: Fabric (2023) Save a draft of your dataflow (link)
[6] Microsoft Learn: Fabric (2023) What's new and planned for Data Factory in Microsoft Fabric (link)

Resources:
[R1] Arshad Ali & Bradley Schacht (2024) Learn Microsoft Fabric (link)
[R2] Microsoft Learn: Fabric (2023) Data Factory limitations overview (link)
[R3] Microsoft Fabric Blog (2023) Data Factory Spotlight: Dataflow Gen2, by Miguel Escobar (link)
[R4] Microsoft Learn: Fabric (2023) Dataflow Gen2 connectors in Microsoft Fabric (link) 
[R5] Microsoft Learn: Fabric (2023) Pattern to incrementally amass data with Dataflow Gen2 (link)
[R6] Fourmoo (2004) Microsoft Fabric – Comparing Dataflow Gen2 vs Notebook on Costs and usability, by Gilbert Quevauvilliers (link)
[R7] Microsoft Learn: Fabric (2023) A guide to Fabric Dataflows for Azure Data Factory Mapping Data Flow users (link)
[R8] Microsoft Learn: Fabric (2023) Quickstart: Create your first dataflow to get and transform data (link)
[R9] Microsoft Learn: Fabric (2023) Microsoft Fabric decision guide: copy activity, dataflow, or Spark (link)
[R10] Microsoft Fabric Blog (2023) Dataflows Gen2 data destinations and managed settings, by Miquella de Boer  (link)
[R11] Microsoft Fabric Blog (2023) Service principal support to connect to data in Dataflow, Datamart, Dataset and Dataflow Gen 2, by Miquella de Boer (link)
[R12] Chris Webb's BI Blog (2023) Fabric Dataflows Gen2: To Stage Or Not To Stage? (link)
[R13] Power BI Tips (2023) Let's Learn Fabric ep.7: Fabric Dataflows Gen2 (link)

07 March 2024

📦Data Migrations (DM): The SQL Server Perspective (Licensing Costs and Edition Choices)

Data Migration
Data Migration Series

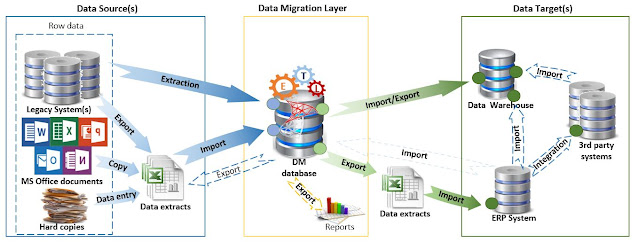
A Data Migration (DM) moves all or a subset of the data available from one or more system(s) into other system(s). For this purpose, especially in ERP Implementations, one can use a SQL Server as intermediate layer, where SSIS can be used for the data extraction and exporting, SSRS for reporting the errors, while the database engine for the heavy processing. Master Data and Data Quality Services can be used as well in certain scenarios. Therefore, SQL Server allows by design to address the various challenges related to a DM. At high level the architecture can be depicted as follows:

Data Migration Architecture

Once the decision to go with SQL Server for the DM layer is made, one needs to define which edition to use. If the DM doesn't have special requirements, one can use for it an available SQL Server instance, as long as the cumulated workloads don't create major issues. Therefore, in the past I used existing licensed versions of SQL Server to build solutions for DMs in ERP implementations, though I evaluated in each project whether it's possible to reduce the costs and remain compliant with the license requirements. 

Of course, there's always the alternative of using SQL Server Express which supports databases with a maximum of 10 GB, which should be enough for most of DMs, though it has also further limitations (see [2]). There are also ways of moving around existing limitations, like splitting the logic across multiple databases. 

Then there's the SQL Server Developer edition, which involves no license costs, has the full SQL Server functionality available, and can be used to build and test applications. In a recent post [1], Bob Ward, principal architect at Microsoft made several clarifications on the licenses for the Developer edition, which is "licensed for development, test, and demonstration purposes only" and "may not be used in a production environment”. Bob Ward makes the following clarifications:
(1) "Production environments include any system that is accessed by end-users for anything more than acceptance testing, environments that connects to production systems (such as Linked servers), disaster recovery or backups of production systems, and environments that are 'rotated' into production at any point in time." [1]
(2) One "cannot use Developer edition to build test data and move that same data into production" [1].
(3) One can "restore a production set of data backup for testing purposes" [1].

There are two-three impediments for using the Developer edition completely for a DM. The first, at least during Go Live and UAT, one needs to work with data coming directly from the various production environments. Secondly, the data generated by the solution are used primarily for UAT and in a second step for Production, which seems to be against the rule (2), or at least it's a grey area (which might be overlooked by Microsoft). Thirdly, some data from the production environment might need to be imported back into the DM layer for validation or enhancing the entities with data generated in the target systems. 

In what concerns the first issue, the DM solution can always point to the test environments used as source, following that during UAT to copy the databases from production into the test environments. This might be anyway necessary for other purposes. Otherwise, the effort might be considerable and not working in the last phases with the data timeliness might raise other concerns. 

The second issue is a matter of interpretation. The UAT phase makes sure that the data generated by the DM solution respects the criteria for Go Live. If there are no issues, the same data can be used for Go-Live. If for this is required another licensed edition, then an environment can be built only for UAT and Go Live, project phases which usually span over a couple of weeks, unless multiple migrations need to be performed at different time intervals. If the environments are in the cloud, probably the instances can be turned on and off on a as-needed basis. 

One can plan for different environments between Production and Development and the environments can be on the same SQL Server as distinct databases, respectively use the Developer edition for Development, and use a different licensed edition for UAT and Production. This approach involves additional overhead in synchronizing the logic between environments. Conversely, in the case of the DM layer, the same environment can be used from beginning to the end, while the code should/must be backed-up periodically. For multiple migrations based on the same data, one should archive the data after each migration or important phase. 

For the scenarios in which after migration the data are copied back to the DM solution, it's enough to have these steps performed against the UAT target system(s). This should work as long there are no differences in configuration between UAT and Production. There are however exceptions, e.g. data generated by the target systems, for which the values between Prod and UAT are different. At least in Dynamics 365 one can attempt to generate the values in the DM layer and import them as they are into the target system. It worked for many scenarios, though there can be exceptions here as well. 

A more complex scenario is when data from the DM layer needs to be exported to Data Warehouses or similar solutions that can be considered as Production systems. Here a licensed edition seems to be mandatory. For other scenarios in which Master Data and/or Data Quality Services are needed, there's only the option to use the Enterprise or Developer editions.

To summarize, to reduce the overall costs for the DM, consider using an existing licensed SQL Server instance for building the solution. If separates environments need to be built, the Express edition might have some limitations though it can prove to be a viable solutions in many cases. Otherwise, consider the above workarounds for using the Developer edition, including the scenario in which distinct environments are used for Production and Development. 

Resources:
[1] Microsoft Data Platform (2024) How SQL developers can maximize savings, by Bob Ward (link)
[2] Microsoft Learn (2024) Editions and supported features of SQL Server 2022 (link)
[3] Microsoft Learn (2023) Master Data Services and Data Quality Services Features Support (link)

06 March 2024

🧭Business Intelligence: Data Culture (Part II: Leadership, Necessary but not Sufficient)

Business Intelligence
Business Intelligence Series

Continuing the idea from the previous post on Brent Dykes’ article on data culture and Generative AI [1], it’s worth discussing about the relationship between data culture and leadership. Leadership belongs to a list of select words everybody knows about but fails to define them precisely, especially when many traits are associated with leadership, respectively when most of the issues existing in organizations ca be associated with it directly or indirectly.

Take for example McKinsey’s definition: "Leadership is a set of behaviors used to help people align their collective direction, to execute strategic plans, and to continually renew an organization." [2] It gives an idea of what leadership is about, though it lacks precision, which frankly is difficult to accomplish. Using modifiers like strong or weak with the word leadership doesn’t increase the precision of its usage. Several words stand out though: direction, strategy, behavior, alignment, renewal.

Leadership is about identifying and challenging the status quo, defining how the future will or could look like for the organization in terms of a vision, a mission and a destination, translating them into a set of goals and objectives. Then, it’s about defining a set of strategies, focusing on transformation and what it takes to execute it, adjusting the strategic bridge between goals and objectives, or, reading between the lines, identifying and doing the right things, being able to introduce a new order of things, reinventing the organization, adapting the organization to circumstances.

Aligning resumes in aligning the various strategies, aligning people with the vision and mission, while renewal is about changing course in response to new information or business context, identifying and transforming weaknesses into strengths, risks into opportunities, respectively opportunities into certitudes, seeing possibilities and multiplying them.

Leadership is also about working on the system, addressing the systemic failure, addressing structural and organizational issues, making sure that the preconditions and enablers for organizational change are in place, that no barriers exist or other factors impact negatively the change, that the positive aspects of complex systems like emergence or exponential growth do happen in time.

And leadership is about much more - interpersonal influence, inspiring people, Inspiring change, changing mindsets, assisting, motivating, mobilizing, connecting, knocking people out of their comfort zones, conviction, consistency, authority, competence, wisdom, etc. Leadership seems to be an idealistic concept where too many traits are considered, traits that ideally should apply to the average knowledge worker as well.

An organization’s culture is created, managed, nourished, and destroyed through leadership, and that’s a strong statement and constraint. By extension this statement applies to the data culture as well. It’s about leading by example and not by words or preaching, and many love to preach, even when no quire is around. It’s about demanding the same from the managers as managers demand from their subalterns, it’s about pushing the edges of culture. As Dykes mentions, it should be about participating in the data culture initiatives, making expectations explicit, and sharing mental models.

Leadership is a condition necessary but not sufficient for an organizations culture to mature. Financial and other type of resources are needed, though once a set of behaviors is seeded, they have the potential to grow and multiply when the proper conditions are met. Growth occurs also by being aware of what needs to be done and doing it day by day consciously, through self-mastery. Nowadays there are so many ways to learn and search for support, one just needs a bit of curiosity and drive to learn anything. Blaming in general the lack of leadership is just a way of passing the blame one level above on the command chain.

Resources:
[1] Forbes (2024) Why AI Isn’t Going To Solve All Your Data Culture Problems, by Brent Dykes (link)
[2] McKinsey (2022) What is leadership? (link)

Previous Post <<||>> Next Post

05 March 2024

🧭Business Intelligence: Data Culture (Part I: Generative AI - No Silver Bullet)

Business Intelligence
Business Intelligence Series

Talking about holy grails in Data Analytics, another topic of major importance for an organization’s "infrastructure" is data culture, that can be defined as the collective beliefs, values, behaviors, and practices of an organization’s employees in harnessing the value of data for decision-making, operations, or insight. Rooted in data literacy, data culture is an extension of an organization’s culture in respect to data that acts as enabler in harnessing the value of data. It’s about thinking critically about data and how data is used to create value. 

The current topic was suggested by PowerBI.tips’s webcast from today [3] and is based on Brent Dykes’ article from Forbes ‘Why AI Isn’t Going to Solve All Your Data Culture Problems’ [1]. Dykes’ starting point for the discussion is Wavestone's annual data executive survey based on which the number of companies that reported they had "created a data-driven organization" rose sharply from 23.9 percent in 2023 to 48.1 percent in 2024 [2]. The report’s authors concluded that the result is driven by the adoption of Generative AI, the capabilities of OpenAI-like tools to generate context-dependent meaningful text, images, and other content in response to prompts. 

I agree with Dykes that AI technologies can’t be a silver bullet for an organization data culture given that AI either replaces people’s behaviors or augments existing ones, being thus a substitute and not a cure [1]. Even for a disruptive technology like Generative AI, it’s impossible to change so much employees’ mindset in a so short period of time. Typically, a data culture matures over years with sustained effort. Therefore, the argument that the increase is due to respondent’s false perception is more than plausible. There’s indeed a big difference between thinking about an organization as being data-driven and being data-driven. 

The three questions-based evaluation considered in the article addresses this difference, thinking vs. being. Changes in data culture don’t occur just because some people or metrics say so, but when people change their mental models based on data, when the interpersonal relations change, when the whole dynamics within the organization changes (positively). If people continue the same behavior and practices, then there are high chances that no change occurred besides the Brownian movement in a confined space of employees, that’s just chaotic motion.  

Indeed, a data culture should encourage the discovery, exploration, collaboration, discussions [1] respectively knowledge sharing and make people more receptive and responsive about environmental or circumstance changes. However, just involving leadership and having things prioritized and funded is not enough, no matter how powerful the drive. These can act as enablers, though more important is to awaken and guide people’s interest, working on people’s motivation and supporting the learning process through mentoring. No amount of brute force can make a mind move and evolve freely unless the mind is driven by an inborn curiosity!

Driving a self-driving car doesn’t make one a better driver. Technology should challenge people and expand their understanding of how data can be used in different contexts rather than give solutions based on a mass of texts available as input. This is how people grow meaningfully and how an organization’s culture expands. Readily available answers make people become dull and dependent on technology, which in the long-term can create more problems. Technology can solve problems when used creatively, when problems and their context are properly understood, and the solutions customized accordingly.

Unfortunately, for many organizations data culture will be just a topic to philosophy about. Data culture implies a change of mindset, perception, mental models, behavior, and practices based on data and not only consulting the data to confirm one’s biases on how the business operates!

Previous Post <<||>> Next Post

Resources:
[1] Forbes (2024) Why AI Isn’t Going To Solve All Your Data Culture Problems, by Brent Dykes (link)
[2] Wavestone (2024) 2024 Data and AI Leadership Executive Survey (link)
[3] Power BI tips (2024) Ep.299: AI & Data Culture Problems (link)

04 March 2024

🧭🏭Business Intelligence: Microsoft Fabric (Part II: Domains and the Data Mesh I -The Challenge of Structure Matching)

Business Intelligence Series

The holy grail of building a Data Analytics infrastructure seems to be nowadays the creation of a data mesh, a decentralized data architecture that organizes data by specific business domains. This endeavor proves to be difficult to achieve given the various challenges faced  – data integration, data ownership, data product creation and ownership, enablement of data citizens, respectively enforcing security and governance in a federated manner. 

Microsoft Fabric promises to facilitate the creation of data mashes with the help of domains and subdomain by providing built-in security, administration, and governance features associated with them. A domain is a way of logically grouping together all the data in an organization that is relevant to a particular area or field. A subdomain is a way for fine tuning the logical grouping of the data.

Business domains
Business domains & their entities

At high level the challenge of building a data mesh is on how to match or aggregate structures. On one side is the high-level structure of the data mesh, while on the other side is the structure of the business data entities. The data entities can be grouped within a taxonomy with multiple levels that expands to the departments. That’s why it seems somehow natural to consider the departments as the top-most domains of the data mesh. The issue is that if the segmentation starts from a high level, iI becomes inflexible in modeling. Moreover, one has only domains and subdomains, and thus a 2-level structure to model the main aspects of the data mesh.

Some organizations allow unrestricted access to the data belonging to a given department, while others breakdown the access to a more granular level. There are also organizations that don’t restrict the access at all, though this may change later. Besides permissions and a way of grouping together the entities, what value brings to set the domains as departments? 

Therefore, I’m not convinced about using an organizations’ departmental structure as domains, especially when such a structure may change and this would imply a full range of further changes. Moreover, such a structure doesn’t reflect the span of processes or how permissions are assigned for the various roles, which are better reflected on how information systems are structured. Most probably the solution needs to accommodate both perspective and be somehow in the middle. 

Take for example the internal structure of the modules from Dynamics 365 (D365). The Finance area is broken down in Accounts Payable, Accounts Receivables, Fixed Assets, General Ledger, etc. In some organizations the departments reflect this delimitation to some degree, while in others are just associated with finance-related roles. Moreover, the permissions are more granular and, reflecting the data entities the users work with. 

Conversely, SCM extends into Finance as Purchase orders, Sales orders and other business documents are the starting or intermediary points of processes that span modules. Similarly, there are processes that start in CRM or other systems. The span of processes seem to be more appropriate for structuring the data mesh, though the system overlapping with the roles involved in the processes and the free definition of process boundaries can overcomplicate the whole design.

It makes sense to define the domains at a level that resembles the structure of the modules available in D365, while the macro data-entities represent the subdomain. The subdomain would represent then master as well as transactional data entities from the perspective of the domains, with there will be entities that need to be shared between multiple domains. Such a structure has less chances to change over time, allowing more flexibility and smaller areas of focus and thus easier to design, develop, test, deploy and maintain.

Previous Post <<||>> Next Post

🧭Business Intelligence: A Software Engineer's Perspective (Part VI: The Data Citizen)

Business Intelligence
Business Intelligence Series

More than a century ago, Jerbert G Wells wrote on mathematical literacy: "[...] the time may not be very remote when it will be understood that for complete initiation as an efficient citizen of one of the new great complex world-wide States that are now developing, it is as necessary to be able to compute, to think in averages and maxima and minima, as it is now to be able to read and write” [1]. The quote is occasionally misquoted as referring to Statistics, though frankly the boundaries of mathematical, statistical, numerical and data literacy tend to melt into each other, existing multiple dependencies between them.

In the age of big data, data citizens, business people able to use data, data processing and visualization tools for building solutions that enable their job, become steadily a necessity for businesses in their quest of making data-driven decisions, gaining insight and whatever valuable use data might have for the organizations. The need is not new,  Microsoft Access and Excel were used for similar purposes already in the 90s, becoming a maintenance nightmare for IT, data islands without proper backup or documentation existing through the organizations, diverse numbers being reported and contradicting each other. 

Then IT took over, trying to find alternatives for the data islands, implementing concepts like single source(s) of truth, quality gates and supporting processes, designing data models and infrastructures for self-service, allowing users to tap into the data for data exploration, discovery, reporting, etc. Getting all this right required to redesign existing infrastructures, making one step forward and a few steps back, in the end everything is a learning process. Such an effort can easily consume an organization's resources. 

Microsoft and other vendors for data-driven solutions keep insisting on how much potential exist in their tools for the data citizen, how the citizens can bring competitive advantage for organizations, automating business and supporting processes. The potential is not to neglect, though it requires a considerable investment from organizations in training and mentoring data citizens, in building data warehouses or data meshes that focus on end-user self-service needs. The data citizen needs time to learn, to play with the data, build solutions, test their usefulness in the daily tasks, respectively incorporate and disseminate the knowledge gained within the organization. 

There are many scenarios in which results can be obtained with a minimum of effort, however there are also hard limits. Besides the learning effort and the time available, there are cognitive, knowledge and ability limits that vary from person to person. Understanding what good architecture, design and techniques means is unfortunately not for everybody, and here's where the concept of citizen data analyst or citizen scientist breaks, and this independently of the tools used. There are also IT people who have similar challenges. 

It must be also recognized that the solutions built in the early stages by data citizens are primarily personal solutions that need to be reviewed and brought to the standards adopted by the organization. In time, it's expected to reduce considerably such effort by evolving data citizen's knowledge and skillset. Without this further work, the solutions built will tend to display some of the shortcomings of the solutions built on MS Access or Excel

The concept of data citizen can work as long the various assumptions and needs are adequately addressed, however progress will not happen overnight. The effort needs to become part of organization's long-term strategy, and the effort can be considerable for many organizations. Mentorship in terms of technical and non-technical support is needed. It's advisable to proceed in small iterative steps and integrate gradually the lessons learned.

Previous Post <<||>> Next Post

Resources:

[1] “Mankind in the Making”, by Herbert G Wells, 1903 [Source]

02 March 2024

🧭Business Intelligence: Microsoft Releases for the BI Technology Stack (Timeline)

Business Intelligence
Business Intelligence Series

I started some years back to put together a timeline for the most important events happening in the BI technology stack (work in progress):

2023: Microsoft announces Microsoft Fabric (>>)

  • Synapse Data Warehouse is the next generation of data warehousing in Microsoft Fabric with native support for the delta lake.
  • Data Engineering & Data Science workloads with support for lakehouses, notebooks, Spark Job definitions, models and experiments.
  • Real-Time Analytics is a robust platform tailored to deliver real-time data insights and observability analytics capabilities for a wide range of data types.
  • OneLake provides a single unified storage location for all your data analytics needs.

2022: Microsoft releases SQL Server 2022 (>>)

  • Synapse Link for SQL Server 2022 allows to seamlessly replicate operational data in near real-time to be able to have more powerful analytics.
  • Purview is a unified data governance and management service.

2019: Microsoft launches Azure Synapse Analytics service (formerly SQL Data Warehouse), a limitless analytics service, that brings together enterprise data warehousing and Big Data analytics. (>>)

2019: Microsoft releases SQL Server 2019 (>>)

  •  Big Data Clusters add-in for SQL Server allows to deploy scalable clusters of SQL Server, Spark, and HDFS containers running on Kubernetes (feature to be retired)

2018: Microsoft extends PowerQuery with ETL capabilities. (>>)

2018: Microsoft releases Azure Data Studio, a data management tool that enables to work with SQL Server, Azure SQL DB and SQL DW from Windows, macOS and Linux. (>>)

2017: Microsoft releases Power BI Report Server, an on-premises server that enables Power BI Pro users to publish Power BI reports and distribute them broadly across the enterprise, without requiring report consumers to be licensed individually per use (>>)

2017: Microsoft released SQL Server Data Tools (SSDT), which uses PowerQuery to import and prepare data in SSAS/AAS tabular models.

2017: Microsoft releases SQL Server 2017. (>>)

  • SSRS is no longer available to install through SQL Server setup.
  • Python support added, R Services renamed to Machine Learning Services. (>>)

2016: Microsoft releases SQL Server 2016 (What's new, >>)

  • Query Store allows to monitor and troubleshoot performance issues.
  • SQL Server R Services integrate the R programming language into SQL Server.
  • Direct Query for SSAS.
  • PolyBase for querying the data stored in HDFS. (>>)
  • Support for Support for HDFS in SSIS.
  • Azure SQL Data Warehouse is GA. (>>)
  • modern reports with SSRS. (>>)
  • Real-Time Operational Analytics. (>>)
2016: SQL Server 2014 Developer Edition becomes free. (>>)

2015: Microsoft announces elastic databases SQL Data Warehouse & Azure Data Lake. (>>)

  • Elastic databases allows to build SaaS applications to manage large numbers of databases that have unpredictable resource demand.
  •  Azure SQL Data Warehouse is an elastic data warehouse in the cloud that can dynamically grow, shrink and pause compute in seconds independent of storage.
  • Azure Data Lake is a hyper-scale data store for big data analytic workloads.

2015: Microsoft releases Power BI to the general public.

  • Power BI Designer renamed to Power BI Desktop.
2015: Microsoft releases several Azure services:
  • launches the SQL Server Cloud database.
  • Azure Data Factory (ADF), a fully managed service that does information production by orchestrating data with processing services as managed data pipelines. (>>)
  • Azure Stream Analytics, a fully managed stream processing engine that is designed to analyze and process large volumes of streaming data with sub-millisecond latencies. (>>)

2014: Microsoft released Power BI Designer unifying Power Query, Power Pivot & Power View.

2013: Microsoft announces Power BI for Office 365. (>>)

2012: Microsoft releases with SQL Server 2012. (>>)

  • BI Semantic Model for SSAS provides a single, scalable model for BI applications.
  • Parallel Data Warehouse with PolyBase capabilities. 
  • in-memory capabilities. (>>)
  • Windows Azure SQL Reporting service available (>>)
  • SQL Server Data Tools unifies SQL Server and cloud SQL Azure development for both professional database and application developers.

2010: Microsoft released 

  • Power Pivot as part of SQL Server R2.
  • Azure SQL Database.

2010: Microsoft releases SQL Server 2008 R2.

  • Master Data Services.
  • Power Pivot & Self-service BI capabilities in SSAS.

2008: Microsoft releases SQL Server 2008 (>>)

  • Table compression.
  • Change Data Capture (CDC).

2005: Microsoft releases SQL Server 2005

  • a greatly enhanced version of Analysis Services.
  • SQL Server Integration Services to replace DTS.

2004: Microsoft released SQL Server Reporting Services (SSRS) as add-on to SQL Server 2000.

2000: Microsoft released SQL Server Analysis Services (SSAS) with SQL Server 2000.

1998: Microsoft released SQL Server 7.

  • OLAP services & first MDX specifications.
  • Data Transformation Services (DTS) for ETL workloads.
Related Posts Plugin for WordPress, Blogger...

About Me

My photo
Koeln, NRW, Germany
IT Professional with more than 24 years experience in IT in the area of full life-cycle of Web/Desktop/Database Applications Development, Software Engineering, Consultancy, Data Management, Data Quality, Data Migrations, Reporting, ERP implementations & support, Team/Project/IT Management, etc.