When creating a Power BI report consider the following steps when starting the actual work. The first five steps can be saved to a "template" that can be reused as starting point for each report.
Step 0: Check Power BI Desktop's version
Check whether you have the latest version, otherwise you can download it from the Microsoft website.
Given that most of the documentation, books and other resources are in English, it might be a good idea to install the English version.
Step 1: Enable the recommended options
File >> Options and settings >> Options >> Global >> Data Load:
.>> Time intelligence >> Auto date/time for new files >> (uncheck)
.>> Regional settings >> Application language >> set to English (United States)
.>> Regional settings >> Model language >> set to English (United States)
You can consider upon case also the following options (e.g. when the relationships are more complex than the feature can handle):
File >> Options and settings >> Options >> Current >> Data load:
.>> Relationship >> Import relationships from data sources on first load >> (uncheck)
.>> Relationship >> Autodetect new relationships after data is loaded >> (uncheck)
Step 2: Enable the options needed by the report
For example, you can enable visual calculations:
File >> Options and settings >> Options >> Preview features >> Visual calculations >> (check)
Comment:
Given that not all preview features are stable enough, instead of activating several features at once, it might be a good idea to do it individually and test first whether they work as expected.
Step 3: Add a table for managing the measures
Add a new table (e.g. "dummy" with one column "OK"):
Results = ROW("dummy", "OK")
Add a dummy measure that could be deleted later when there's at least one other measure:
Test = ""
Hide the "OK" column and with this the table is moved to the top. The measures can be further organized within folders for easier maintenance.
Step 4: Add the Calendar if time analysis is needed
Add a new table (e.g. "Calendar" with a "Date" column):
Calendar = Calendar(Date(Year(Today()-3*365),1,1),Date(Year(Today()+1*365),12,31))
Add the columns:
Year = Year('Calendar'[Date])
YearQuarter = 'Calendar'[Year] & "-Q" & 'Calendar'[Quarter]
Quarter = Quarter('Calendar'[Date])
QuarterName = "Q" & Quarter('Calendar'[Date])
Month = Month('Calendar'[Date])
MonthName = FORMAT('Calendar'[Date], "mmm")
Even if errors appear (as the columns aren't listed in the order of their dependencies), create first all the columns. Format the Date in a standard format (e.g. dd-mmm-yy) including for Date/Time for which the Time is not needed.
To get the values in the visual sorted by the MonthName:
Table view >> (select MonthName) >> Column tools >> Sort by column >> (select Month)
To get the values in the visual sorted by the QuarterName:
Table view >> (select QuarterName) >> Column tools >> Sort by column >> (select Quarter)
With these changes the filter could look like this:
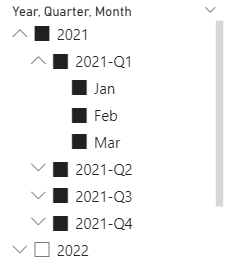
Format numeric values to represent their precision accordingly.
Format the dates in a standard format (e.g. "dd-mmm-yy") including for Date/Time for which the Time is not needed.
The formatting needs to be considered for the fields, measures and metrics added later as well.
Step 10: Define the filters
Identify the filters that will be used more likely in pages and use the Sync slicers to synchronize the filters between pages, when appropriate:
View >> Sync slicers >> (select Page name) >> (check Synch) >> (check Visible)
Step 11: Add the visuals
At least for report's validation, consider using a visual that holds the detail data as represented in the other visuals on the page. Besides the fact that it allows users to validate the report, it also provides transparence, which facilitates report's adoption.


No comments:
Post a Comment