13 February 2024

🧭Business Intelligence: A One-Man Show (Part V: Focus on the Foundation)

Business Intelligence Suite

I tend to agree that one person can't do anymore "everything in the data space", as Christopher Laubenthal put it his article on the topic [1]. He seems to catch the essence of some of the core data roles found in organizations. Summarizing these roles, data architecture is about designing and building a data infrastructure, data engineering is about moving data, database administration is mainly about managing databases, data analysis is about assisting the business with data and reports, information design is about telling stories, while data science can be about studying the impact of various components on the data. 

However, I find his analogy between a college's functional structure and the core data roles as poorly chosen from multiple perspectives, even if both are about building an infrastructure of some type. 

Firstly, the two constructions have different foundations. Data exists in a an organization also without data architects, data engineers or data administrators (DBAs)! It's enough to buy one or more information systems functioning as islands and reporting needs will arise. The need for a data architect might come when the systems need to be integrated or maybe when a data warehouse needs to be build, though many organizations are still in business without such constructs. While for the others, the more complex the integrations, the bigger the need for a Data Architect. Conversely, some systems can be integrated by design and such capabilities might drive their selection.

Data engineering is needed mainly in the context of the cloud, respectively of data lake-based architectures, where data needs to be moved, processed and prepared for consumption. Conversely, architectures like Microsoft Fabric minimize data movement, the focus being on data processing, the successive transformations it needs to suffer in moving from bronze to the gold layer, respectively in creating an organizational semantical data model. The complexity of the data processing is dependent on data' structuredness, quality and other data characteristics. 

As I mentioned before, modern databases, including the ones in the cloud, reduce the need for DBAs to a considerable degree. Unless the volume of work is big enough to consider a DBA role as an in-house resource, organizations will more likely consider involving a service provider and a contingent to cover the needs. 

Having in-house one or more people acting under the Data Analyst role, people who know and understand the business, respectively the data tools used in the process, can go a long way. Moreover, it's helpful to have an evangelist-like resource in house, a person who is able to raise awareness and knowhow, help diffuse knowledge about tools, techniques, data, results, best practices, respectively act as a mentor for the Data Analyst citizens. From my point of view, these are the people who form the data-related backbone (foundation) of an organization and this is the minimum of what an organization should have!

Once this established, one can build data warehouses, data integrations and other support architectures, respectively think about BI and Data strategy, Data Governance, etc. Of course, having a Chief Data Officer and a Data Strategy in place can bring more structure in handling the topics at the various levels - strategical, tactical, respectively operational. In constructions one starts with a blueprint and a data strategy can have the same effect, if one knows how to write it and implement it accordingly. However, the strategy is just a tool, while the data-knowledgeable workers are the foundation on which organizations should build upon!

"Build it and they will come" philosophy can work as well, though without knowledgeable and inquisitive people the philosophy has high chances to fail.

Previous Post <<||>> Next Post

Resources:
[1] Christopher Laubenthal (2024) "Why One Person Can’t Do Everything In Data" (link)

🧭Business Intelligence: A One-Man Show (Part IV: Data Roles between Past and Future)

Business Intelligence Series

Databases nowadays are highly secure, reliable and available to a degree that reduces the involvement of DBAs to a minimum. The more databases and servers are available in an organization, and the older they are, the bigger the need for dedicated resources to manage them. The number of DBAs involved tends to be proportional with the volume of work required by the database infrastructure. However, if the infrastructure is in the cloud, managed by the cloud providers, it's enough to have a person in the middle who manages the communication between cloud provider(s) and the organization. The person doesn't even need to be a DBA, even if some knowledge in the field is usually recommended.

The requirement for a Data Architect comes when there are several systems in place and there're multiple projects to integrate or build around the respective systems. It'a also the question of what drives the respective requirement - is it the knowledge of data architectures, the supervision of changes, and/or the review of technical documents? The requirement is thus driven by the projects in progress and those waiting in the pipeline. Conversely, if all the systems are in the cloud, their integration is standardized or doesn't involve much architectural knowledge, the role becomes obsolete or at least not mandatory. 

The Data Engineer role is a bit more challenging to define because it appeared in the context of cloud-based data architectures. It seems to be related to the data movement via ETL/ELT pipelines and of data processing and preparation for the various needs. Data modeling or data presentation knowledge isn't mandatory even if ideal. The role seems to overlap with the one of a Data Warehouse professional, be it a simple architect or developer. Role's knowhow depends also on the tools involved, because one thing is to build a solution based on a standard SQL Server, and another thing to use dedicated layers and architectures for the various purposes. Engineers' number should be proportional with the number of data entities involved.

Conversely, the existence of solutions that move and process the data as needed, can reduce the volume of work. Moreover, the use of AI-driven tools like Copilot might shift the focus from data to prompt engineering. 

The Data Analyst role is kind of a Cinderella - it can involve upon case everything from requirements elicitation to reports writing and results' interpretation, respectively from data collection and data modeling to data visualization. If you have a special wish related to your data, just add it to the role! Analysts' number should be related to the number of issues existing in organization where the collection and processing of data could make a difference. Conversely, the Data Citizen, even if it's not a role but a desirable state of art, could absorb in theory the Data Analyst role.

The Data Scientist is supposed to reveal the gems of knowledge hidden in the data by using Machine Learning, Statistics and other magical tools. The more data available, the higher the chances of finding something, even if probably statistically insignificant or incorrect. The role makes sense mainly in the context of big data, even if some opportunities might be available at smaller scales. Scientists' number depends on the number of projects focused on the big questions. Again, one talks about the Data Scientist citizen. 

The Information Designer role seems to be more about data visualization and presentation. It makes sense in the organizations that rely heavily on visual content. All the other organizations can rely on the default settings of data visualization tools, independently on whether AI is involved or not. 

Previous Post <<||>> Next Post

🧭🏭Business Intelligence: A One-Man Show III (The Microsoft Fabric)

Business Intelligence Series

Announced at the end of the last year, Microsoft Fabric (MF) become a reality for the data professional, even if there are still many gaps in the overall architecture and some things don't work as they should. The Delta Lake and the various data consumption experiences seem to bring more flexibility but also raise questions on how one can use them adequately in building solutions for Data Analytics and/or Data Science. 

Currently, as it happens with new technologies, data professionals seem to try to explore the functionality, see what's possible, what's missing, and that's a considerable effort as everybody is more or less on his own. The material released by Microsoft and other professionals should facilitate in theory this effort, though the considerable number of features and the effort needed to review them do the opposite. Some professionals do this as part of their jobs, and exploring the feature seems to be a full job in each area, while others, like myself, do it in their own time. 

There are organizations that demand from their employees to regularly actualize their knowledge in their field of activity, respectively explore how new technologies can be integrated in organization's architecture. Having a few hours or even a day a weak for this can go a long way! Occasionally, I could take 1-2 hours a week during the program and take maybe a few many more hours from my own time. Unfortunately, most of the significant progress I made in a certain area (SQL Server, Dynamics 365, Software Engineering, Power BI, and now MF) it was done in my own time, which became in time more and more challenging to do given the pace with which new features and technologies develop.

By comparison, it was relatively easy to locally install SQL Server in its various CTP or community versions, deploy one of the readily-available databases, and start learning. I'm still doing it, playing with a SQL Server 2022 instance whenever I find the time. Similarly, I can use Power BI and a few other tools, depending again on the time available to make progress. However, with MF things start slowly to get blurry. The 60 days of trial won't cut it anymore as there are so many things to learn - Spark SQL, PySpark, Delta Lake, KQL, Dataflows, etc. Probably, there will be ways for learning any of this standalone, though not together in an integrated manner. 

The complexity of the tools demands more time, a proper infrastructure and a good project to accommodate them. This doesn't mean that the complexity of the solutions need to increase as well! Azure Synapse allowed me to reuse many of the techniques I used in the past to build a modern Data Analytics solution, while in other areas I had to accommodate the new. The solution wasn't perfect (only time will tell), though it provided the minimum of what was needed. I expect the same to happen in Microsoft Fabric, even if the number of choices is bigger. 

There's a considerable difference between building a minimal viable solution and exploring, respectively harnessing MF's capabilities. The challenge for many organizations is to determine what that minimum is about, how to build that knowledge into the team, especially when starting from zero. 

Conversely, this doesn't mean that the skillset and effort can't be covered by one person. It might be more challenging though achievable if the foundation is there, respectively if certain conditions are met. This depends also on organization's expectations, infrastructure and other characteristics. A whole team is more likely to succeed than one person, but not certainty! 

Previous Post <<||>> Next Post

🧭Business Intelligence: A One-Man Show (Part II: In the Cusps of Complexity)

Business Intelligence Series

I watched today on YouTube Power BI Tips' "One Person to Do Everything" episode I missed last week. The main topic is based on Christopher Laubenthal's article "Why one person can't do everything in the data space". Author's arguments are based on an analogy between the various data areas and a college's functional structure. Reading the article, I must say that it takes a poorly chosen analogy to mess messy things more!

One of the most confusing things is that there are so many data-related context-dependent roles with considerable overlapping, that it becomes more and more difficult to understand what they cover. The author considers the roles of Data Architect, Data Engineer, Database Administrator (DBA), Data Analyst, Information Designer and Data Scientist. However, to the every aspect of a data architecture there are also developers on the database (backend) and reporting side (front-end). Conversely, there are other data professionals on the management side for the various knowledge areas of Data Management: Data Governance, Data Strategy, Data Security, Data Operations, etc. There are also roles at the border between the business and the technical side like Data Stewards, Business Analysts, Data Citizen, etc. 

There are two main aspects here. According to the historical perspective, many of these roles appeared when a new set of requirements or a new layer appeared in the architecture. Firstly, it was maybe the DBA, who was supposed to primarily administer the database. Being a keeper of the data and having some knowledge of the data entities, it was easy for him/her to export data for the various reporting needs. In time such activities were taken over by a second category of data professionals. Then the data were moved to Decision Support Systems and later to Data Warehouses and Data Lakes/Lakehoses, this evolution requiring other professionals to address the challenges of each layer. Every activity performed on the data requires a certain type of knowledge that can result in the end in a new denomination. 

The second perspective results from the management of data and the knowledge areas associated with it. If in small organizations with one or two systems in place one doesn't need to talk about Data Operations, in big organizations, where a data center or something similar is maybe in place, Data Operations can easily become a topic on its own, a management structure needing to be in place for its "effective and efficient" management. And the same can happen in the other knowledge areas and their interaction with the business. It's an inherent tendency of answering to complexity with complexity, which on the long term can be in the detriment of any business. In extremis, organizations tend to have a whole team in each area, which can further increase the overall complexity by a small to not that small magnitude. 

Fortunately, one of the benefits of technological advancement is that much of the complexity can be moved somewhere else, and these are the areas where the cloud brings the most advantages. Parts or all architecture can be deployed into the cloud, being managed by cloud providers and third-parties on an on-demand basis at stable costs. Moreover, with the increasing maturity and integration of the various layers, the impact of the various roles in the overall picture is reduced considerably as areas like governance, security or operations are built-in as services, requiring thus less resources. 

With Microsoft Fabric, all the data needed for reporting becomes in theory easily available in the OneLake. Unfortunately, there is another type of complexity that is dumped on other professionals' shoulders and these aspects need to be furthered considered. 

Previous Post <<|||>> Next Post

Resources:
[1] Christopher Laubenthal (2024) "Why One Person Can’t Do Everything In Data" (link)
[2] Power BI tips (2024) Ep.292: One Person to Do Everything (link)


12 February 2024

🧭Business Intelligence: A One-Man Show (Part I: Some Personal Background and a Big Thanks!)

Business Intelligence Series

Over the past 24 years, I found myself often in the position of a "one man show" doing almost everything in the data space from requirements gathering to development, testing, deployment, maintenance/support (including troubleshooting and optimization), and Project Management, respectively from operations to strategic management, when was the case. Of course, different tasks of varying complexity are involved! Developing a SSRS or Power BI report has a smaller complexity than developing in the process also all or parts of the Data Warehouse, or Lakehouse nowadays, respectively of building the whole infrastructure needed for reporting. All I can say is that "I've been there, I've done that!". 

Before SSRS became popular, I even built for a customer a whole reporting solution based on SQL Server, HTML & XML, respectively COM+ objects for database access. UI’s look-and-feel was like SSRS, though there was no wizardry involved besides the creative use of programming and optimization techniques. Once I wrote an SQL query, the volume of work needed to build a report was comparable to the one in SSRS. It was a great opportunity to use my skillset, working previously as a web developer and VB/VBA programmer. I worked for many years as a Software Engineer, applying the knowledge acquired in the field whenever it made sense to do so, working alone or in a team, as the projects required.

During this time, I was involved in other types of projects and activities that had less to do with the building of reports and warehouses. Besides of the development of various desktop, web, and data-processing solutions, I was also involved in 6-8 ERP implementations, being responsible for the migration of data, building the architectures needed in the process, supporting key users in various areas like Data Quality or Data Management. I also did Project Management, Application Management, Release and Change Management, and even IT Management. Thus, there were at times at least two components involved - one component was data-related, while the other component had more diversity. It was a good experience, because the second component often needed knowledge of the first, and vice versa. 

For example, arriving to understand the data model and business processes behind an ERP system by building ad-hoc and standardized reports, allowed me to get a good understanding of what data is needed for a Data Migration, which are the dependencies, or the level of quality needed. Similarly, the knowledge acquired by building ETL-based pipelines and data warehouses allowed me to design and build flexible Data Migration solutions, both architectures being quite similar from many perspectives. Knowledge of the data models and architectures involved can facilitate the overall process and is a premise for building reliable performant solutions. 

Similar examples can also be given in Data Management, Data Operations, Data Governance, during and post-implementation ERP support, etc. Reports and data are needed also in the Management areas - it starts from knowing what data are needed in the supporting processes for providing transparency, of getting insights and bringing the processes under control, if needed.

Working alone, being able to build a solution from the beginning to the end was often a job requirement. This doesn't imply that I was a "lone wolf". The nature of a data professional or software engineer’s job requires you to interact with various businesspeople from report requesters to key users, internal and external consultants, intermediary managers, and even upper management. There was also the knowledge of many data professionals involved indirectly – the resources I used to learn from - books, tutorials, blogs, webcasts, code, and training material. I'm thankful for their help over all these years!

Previous Post <<||>> Next Post

07 February 2024

💎🏭SQL Reloaded: Microsoft Fabric's Delta Tables in Action - Views and other Data Objects

One reads in the training material that the SQL Endpoint provides a read-only experience [1], meaning that no data can be written back to the delta lake tables. Playing with the metadata available in Spark SQL via Notebooks and the SQL Endpoint (see post), I realized that there is more to the statement! Even if one can query via the SQL Endpoint only delta tables, this doesn't mean that one can't build a semantic model on top of it, much like one was able to do via the Serverless SQL pool in Azure Synapse.

In Spark one can create via SQL, PySpark and the other supported languages views and functions, though they will not be available to the SQL Endpoint! To use the data generated in the process, the respective data needs to be saved to delta tables. Conversely, one can still create views, functions and stored procedures via the SQL Endpoint though the objects won't be available in Spark SQL! 

This has important implications, though in this post let's focus on the syntax and create several objects for testing purposes in the two environments. I'll use the Assets delta table created in a previous post. The Spark SQL code should be run in a notebook (e.g. one cell per group of statements), while the code for the SQL Endpoint should be run in SQL Server Management Studio.

Views

/* test view's creation in the SQL Endpoint */

-- drop the test view 
DROP VIEW IF EXISTS dbo.vAssets_Microsoft2;
GO

-- create the test view
CREATE VIEW dbo.vAssets_Microsoft2
AS
--Microsoft assets
SELECT Id, CreationDate, Vendor, Asset, Model, Owner, Tag, Quantity
FROM dbo.Assets
WHERE Vendor = 'Microsoft';
GO

-- test the viwe
SELECT *
FROM dbo.vAssets_Microsoft2;

/* test view's creation in Spark SQL */

-- drop test view 
DROP VIEW IF EXISTS vAssets_Microsoft;

-- create test view
CREATE VIEW vAssets_Microsoft COMMENT 'Microsoft assets in scope (view)'
AS
SELECT Id, CreationDate, Vendor, Asset, Model, Owner, Tag, Quantity
FROM assets
WHERE Vendor = 'Microsoft';

-- review data
SELECT *
FROM vAssets_Microsoft;

Table-Valued Functions

/* test function's creation in the SQL Endpoint */

-- drop the test function 
DROP FUNCTION IF EXISTS dbo.fAssets_Microsoft2;
GO

-- create the test function
CREATE FUNCTION dbo.fAssets_Microsoft2(
    @Vendor nvarchar(max))
RETURNS TABLE 
AS 
RETURN (
    SELECT Id, CreationDate, Vendor, Asset, Model, Owner, Tag, Quantity
    FROM dbo.Assets
    WHERE Vendor = @Vendor
);
GO

-- test the function
SELECT *
FROM dbo.fAssets_Microsoft2('Microsoft');

SELECT *
FROM dbo.fAssets_Microsoft2('Dell');

Unfortunately, the Spark SQL code doesn't seem to work, its execution returning a PARSE_SYNTAX_ERROR error no matter how simple the code was (see also [2]).
 
/* test function's creation in Spark SQL */

-- drop test function 
DROP FUNCTION IF EXISTS fAssets_Microsoft;

-- create test function
CREATE FUNCTION fAssets_Microsoft(
    pVendor string)
RETURNS TABLE
AS 
RETURN 
    SELECT Id, CreationDate, Vendor, Asset, Model, Owner, Tag, Quantity
    FROM assets
    WHERE Vendor = pVendor;

-- review data
SELECT *
FROM fAssets_Microsoft('Microsoft');

Stored Procedure

Stored procedures aren't available in Spark SQL, though this doesn't mean that we can't test the code in the SQL Endpoint:

/* test procedure's creation in the SQL Endpoint */

-- drop the test procedure 
DROP PROCEDURE IF EXISTS dbo.spAssets_Microsoft2;
GO

-- create the test procedure
CREATE PROCEDURE dbo.spAssets_Microsoft2(
@Vendor nvarchar(max) = NULL)
AS
--Microsoft assets
SELECT Id, CreationDate, Vendor, Asset, Model, Owner, Tag, Quantity
FROM dbo.Assets
WHERE Vendor = IsNull(@Vendor, Vendor);
GO

-- test the procedure
EXEC dbo.spAssets_Microsoft2 'Microsoft';
EXEC dbo.spAssets_Microsoft2 'Dell';
EXEC dbo.spAssets_Microsoft2;

Notes:
1) I observed in documentation and some presentations that the common practice of prefixing data objects based on their type is seldom considered. I still find it useful when building solutions, even if object's type can be derived from the context and/or metadata. 
2) The examples were chosen to test the minimal functionality so that the differences between the two platforms are minimal - using the dbo schema and the GO command in the SQL Endpoint, COMMENT in Spark SQL. However, as soon specific functionality is used, extra code is needed to mitigate the differences.
3) The names between environments were kept different, just in case one needs to test objects' availability between platforms.

Happy coding!

Previous Post  <<||>>  Next Post

Resources:
[1] Microsoft Learn (2023) Work with Delta Lake tables in Microsoft Fabric (link)
[2] Databricks (2023) CREATE FUNCTION (SQL and Python) (link)

06 February 2024

💎🏭SQL Reloaded: Microsoft Fabric's Delta Tables in Action - Data Objects Metadata

There seem to be four main sources for learning about the functionality available in the Delta Lake especially in what concerns the SQL dialect used by the Spark SQL: Databricks [1], Delta Lake [2], Azure Databricks [3], respectively the Data Engineering documentation in Microsoft Fabric [4] and the afferent certification material. Unfortunately, the latter focuses more on PySpark. So, until Microsoft addresses the gap, one can consult the other sources, check what's working and built thus the required knowledge for handling the various tasks. 

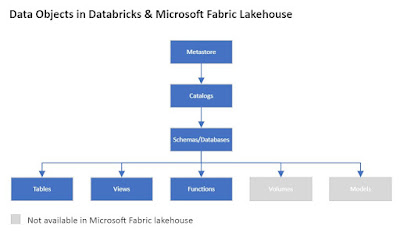
First of all, it's important to understand which the data objects available in Microsoft Fabric are. Based on [5] I could identify the following hierarchy:


According to the same source [5] the metastore contains all of the metadata that defines data objects in the lakehouse, while the catalog is the highest abstraction in the lakehouse. The database, called also a schema, keeps its standard definition - a collection of data objects, such as tables or views (aka relations) and functions. The tables, views and functions keep their standard definitions. Except the metastore, these are also the (securable) objects on which permissions can be set. 

One can explore the structure in Spark SQL by using the SHOW command:

-- explore the data objects from the lakehouse
SHOW CATALOGS;

SHOW DATABASES;

SHOW SCHEMAS;

SHOW CATALOGS;

SHOW VIEWS;

SHOW TABLES;

SHOW FUNCTIONS;

Moreover, one can list only the objects from an object from the parent (e.g. the tables existing in a database):
 
-- all tables from a database
SHOW TABLES FROM Testing;

-- all tables from a database matching a pattern
SHOW TABLES FROM Testing LIKE 'Asset*';

-- all tables from a database matching multiple patterns
SHOW TABLES FROM Testing LIKE 'Asset*|cit*';

Notes:
1) Same syntax applies for views and functions, respectively for the other objects in respect to their parents (from the hierarchy). 
2) Instead of FROM one can use the IN keyword, though I'm not sure what's the difference given that they seem to return same results.
3) For databases and tables one can use also the SQL Server to export the related metadata. Unfortunately, it's not the case for views and functions because when the respective objects are created in Spark SQL, they aren't visible over the SQL Endpoint, and vice versa.

4) Given that there are multiple environments that deal with delta tables, to minimize the confusion that might result from their use, it makes sense to use database as term instead of schema. 

References:
[1] Databricks (2024) SQL language reference (link)
[2] Delta Lake (2023) Delta Lake documentation (link)
[3] Microsoft Learn (2023) Azure Databricks documentation (link)
[4] Microsoft Learn (2023) Data Engineering documentation in Microsoft Fabric (link)
[5] Databricks (2023) Data objects in the Databricks lakehouse (link)

💎🏭SQL Reloaded: Microsoft Fabric's Delta Tables in Action - Table Metadata II (Updating a table's COMMENT attributes)

While using the DESCRIBE TABLE metadata I observed that its output shown also a Comment attribute which was NULL for all the columns. Browsing through the Databricks documentation (see [1]), I found that the Comment can be provided in a delta table's definition as follows (code to be run in a notebook):

-- drop the table (if already exists)
DROP TABLE IF EXISTS Assets2;

--create the table
CREATE TABLE Assets2 (
 Id int NOT NULL COMMENT 'Asset UID',
 CreationDate timestamp NOT NULL COMMENT 'Creation Date',
 Vendor string NOT NULL COMMENT 'Vendors name',
 Asset string NOT NULL COMMENT 'Asset type',
 Model string NOT NULL COMMENT 'Asset model',
 Owner string NOT NULL COMMENT 'Current owner',
 Tag string NOT NULL COMMENT 'Assets tag',
 Quantity decimal(13, 2) NOT NULL COMMENT 'Quantity'
) 
USING DELTA
COMMENT 'Vendor assets';

-- show table's definition
DESCRIBE TABLE Assets2;

-- show table's details
DESCRIBE DETAIL Assets;

So, I thought there must be a way to update Assets table's definition as well. And here's the solution split into two steps, as different syntax is required for modifying the columns, respectively the table:

-- modify columns' COMMENT for an existing table
ALTER TABLE Assets ALTER COLUMN ID COMMENT 'Asset UID';
ALTER TABLE Assets ALTER COLUMN CreationDate COMMENT 'Creation Date';
ALTER TABLE Assets ALTER COLUMN Vendor COMMENT 'Vendors name';
ALTER TABLE Assets ALTER COLUMN Asset COMMENT 'Asset type';
ALTER TABLE Assets ALTER COLUMN Model COMMENT 'Asset model';
ALTER TABLE Assets ALTER COLUMN Owner COMMENT 'Current owner';
ALTER TABLE Assets ALTER COLUMN Tag COMMENT 'Assets tag';
ALTER TABLE Assets ALTER COLUMN Quantity COMMENT 'Quantity';

-- show table's definition
DESCRIBE TABLE Assets;

The operation generated a log file with the following content:

{"commitInfo":{"timestamp":1707180621522,"operation":"CHANGE COLUMN","operationParameters":{"column":"{\"name\":\"Quantity\",\"type\":\"decimal(13,2)\",\"nullable\":false,\"metadata\":{\"comment\":\"Quantity\"}}"},"readVersion":13,"isolationLevel":"Serializable","isBlindAppend":true,"operationMetrics":{},"engineInfo":"Apache-Spark/3.4.1.5.3-110807746 Delta-Lake/2.4.0.8","txnId":"42590d18-e04a-4fb2-bbfa-94414b23fb07"}}
{"metaData":{"id":"83e87b3c-28f4-417f-b4f5-842f6ba6f26d","description":"Vendor assets","format":{"provider":"parquet","options":{}},"schemaString":"{\"type\":\"struct\",\"fields\":[
{\"name\":\"Id\",\"type\":\"integer\",\"nullable\":false,\"metadata\":{\"comment\":\"Asset UID\"}},
{\"name\":\"CreationDate\",\"type\":\"timestamp\",\"nullable\":false,\"metadata\":{\"comment\":\"Creation Date\"}},
{\"name\":\"Vendor\",\"type\":\"string\",\"nullable\":false,\"metadata\":{\"comment\":\"Vendors name\"}},
{\"name\":\"Asset\",\"type\":\"string\",\"nullable\":false,\"metadata\":{\"comment\":\"Asset type\"}},
{\"name\":\"Model\",\"type\":\"string\",\"nullable\":false,\"metadata\":{\"comment\":\"Asset model\"}},
{\"name\":\"Owner\",\"type\":\"string\",\"nullable\":false,\"metadata\":{\"comment\":\"Current owner\"}},
{\"name\":\"Tag\",\"type\":\"string\",\"nullable\":false,\"metadata\":{\"comment\":\"Assets tag\"}},
{\"name\":\"Quantity\",\"type\":\"decimal(13,2)\",\"nullable\":false,\"metadata\":{\"comment\":\"Quantity\"}}]}","partitionColumns":[],"configuration":{},"createdTime":1707149934697}}

And the second step (see [2]):

-- modify a table's COMMENT
COMMENT ON TABLE Assets IS 'Vendor assets';

-- describe table's details
DESCRIBE DETAIL Assets;

    The operation generated a log file with the following content:

{"commitInfo":{"timestamp":1707180808138,"operation":"SET TBLPROPERTIES","operationParameters":{"properties":"{\"comment\":\"Vendor assets\"}"},"readVersion":14,"isolationLevel":"Serializable","isBlindAppend":true,"operationMetrics":{},"engineInfo":"Apache-Spark/3.4.1.5.3-110807746 Delta-Lake/2.4.0.8","txnId":"21c315b5-a81e-4107-8a19-6256baee7bd5"}}
{"metaData":{"id":"83e87b3c-28f4-417f-b4f5-842f6ba6f26d","description":"Vendor assets","format":{"provider":"parquet","options":{}},"schemaString":"{\"type\":\"struct\",\"fields\":[
{\"name\":\"Id\",\"type\":\"integer\",\"nullable\":false,\"metadata\":{\"comment\":\"Asset UID\"}}
,{\"name\":\"CreationDate\",\"type\":\"timestamp\",\"nullable\":false,\"metadata\":{\"comment\":\"Creation Date\"}}
,{\"name\":\"Vendor\",\"type\":\"string\",\"nullable\":false,\"metadata\":{\"comment\":\"Vendors name\"}}
,{\"name\":\"Asset\",\"type\":\"string\",\"nullable\":false,\"metadata\":{\"comment\":\"Asset type\"}}
,{\"name\":\"Model\",\"type\":\"string\",\"nullable\":false,\"metadata\":{\"comment\":\"Asset model\"}}
,{\"name\":\"Owner\",\"type\":\"string\",\"nullable\":false,\"metadata\":{\"comment\":\"Current owner\"}}
,{\"name\":\"Tag\",\"type\":\"string\",\"nullable\":false,\"metadata\":{\"comment\":\"Assets tag\"}}
,{\"name\":\"Quantity\",\"type\":\"decimal(13,2)\",\"nullable\":false,\"metadata\":{\"comment\":\"Quantity\"}}]}","partitionColumns":[],"configuration":{},"createdTime":1707149934697}}

Notes:
1) Don't forget to remove the Assets2 table!
2) Updating the COMMENT for a single delta table is simple, though for updating the same for a list of tables might be task for a PySpark job. It makes sense to provide the respective metadata from the start, when that's possible. Anyway, the information should be available in lakehouse's data dictionary.
3) One can reset the COMMENT to NULL or to an empty string.

Happy coding!

Resources:
[1] Databaricks (2023) ALTER TABLE (link)
[2] Databaricks (2023) COMMENT ON (link)

💎🏭SQL Reloaded: Microsoft Fabric's Delta Tables in Action - Table Metadata I (General Information)

In a previous post I've created a delta table called Assets. For troubleshooting and maintenance tasks it would be useful to retrieve a table's metadata - properties, definition, etc. There are different ways to extract the metadata, depending on the layer and method used.

INFORMATION_SCHEMA in SQL Endpoint

Listing all the delta tables available in a Lakehouse can be done using the INFORMATION_SCHEMA via the SQL Endpoint:

-- retrieve the list of tables
SELECT * 
FROM INFORMATION_SCHEMA.TABLES
WHERE TABLE_TYPE = 'BASE TABLE'
ORDER BY TABLE_SCHEMA  

Output:
TABLE_CATALOG TABLE_SCHEMA TABLE_NAME TABLE_TYPE
Testing dbo city BASE TABLE
Testing dbo assets BASE TABLE

The same schema can be used to list columns' definition:
 
-- retrieve column metadata
SELECT TABLE_CATALOG
, TABLE_SCHEMA
, TABLE_NAME
, COLUMN_NAME
, ORDINAL_POSITION
, DATA_TYPE
, CHARACTER_MAXIMUM_LENGTH
, NUMERIC_PRECISION
, NUMERIC_SCALE
, DATETIME_PRECISION
, CHARACTER_SET_NAME
FROM INFORMATION_SCHEMA.COLUMNS
WHERE TABLE_NAME = 'assets'
ORDER BY ORDINAL_POSITION

Note:
Given that the INFORMATION_SCHEMA is an ANSI-standard schema for providing metadata about a database's objects (including views, schemata), probably this is the best way to retrieve general metadata as the above (see [3]). More information over the SQL Endpoint can be obtained by querying directly the SQL Server metadata.

Table's Properties

The Delta Lake documentation reveals that a table's properties can be retrieved via the DESCRIBE command, which can be used in a notebook's cell (see [1] for attributes' definition):

-- describe table's details
DESCRIBE DETAIL Assets;

Output (transposed):
Attribute Value
format delta
id 83e87b3c-28f4-417f-b4f5-842f6ba6f26d
name spark_catalog.testing.assets
description NULL
location abfss://[…]@onelake.dfs.fabric.microsoft.com/[…]/Tables/assets
createdAt 2024-02-05T16:18:54Z
lastModified 2024-02-05T16:29:52Z
partitionColumns
numFiles 1
sizeInBytes 3879
properties [object Object]
minReaderVersion 1
minWriterVersion 2
tableFeatures appendOnly,invariants

One can export the table metadata also from the sys.tables via the SQL Endpoint, though will be considered also SQL Server based metadata:

-- table metadata
SELECT t.object_id
, schema_name(t.schema_id) schema_name
, t.name table_name
, t.type_desc
, t.create_date 
, t.modify_date
, t.durability_desc
, t.temporal_type_desc
, t.data_retention_period_unit_desc
FROM sys.tables t
WHERE name = 'assets'

Output (transposed):
Attribute Value
object_id 1264723558
schema_name dbo
table_name assets
type_desc USER_TABLE
create_date 2024-02-05 16:19:04.810
modify_date 2024-02-05 16:19:04.810
durability_desc SCHEMA_AND_DATA
temporal_type_desc NON_TEMPORAL_TABLE
data_retention_period_unit_desc INFINITE

Note:
1) There seem to be thus two different repositories for storing the metadata, thing reflected also in the different timestamps.

Table's Definition 

A table's definition can be easily exported via the SQL Endpoint in SQL Server Management Studio. Multiple tables' definition can be exported as well via the Object explorer details within the same IDE. 

In Spark SQL you can use the DESCRIBE TABLE command:

-- show table's definition
DESCRIBE TABLE Assets;

Output:
col_name data_type comment
Id int NULL
CreationDate timestamp NULL
Vendor string NULL
Asset string NULL
Model string NULL
Owner string NULL
Tag string NULL
Quantity decimal(13,2) NULL

Alternatively, you can use the EXTENDED keyword with the previous command to show further table information:
 
-- show table's definition (extended)
DESCRIBE TABLE EXTENDED Assets;

Output (only the records that appear under '# Detailed Table Information'):
Label Value
Name spark_catalog.testing.assets
Type MANAGED
Location abfss://[...]@onelake.dfs.fabric.microsoft.com/[...]/Tables/assets
Provider delta
Owner trusted-service-user
Table Properties [delta.minReaderVersion=1,delta.minWriterVersion=2]

Note that the table properties can be listed individually via the SHOW TBLPROPERTIES command:
 
--show table properties
SHOW TBLPROPERTIES Assets;

A column's definition can be retrieved via a DESCRIBE command following the syntax:

-- retrieve column metadata
DESCRIBE Assets Assets.CreationDate;

Output:
info_name info_value
col_name CreationDate
data_type timestamp
comment NULL

In PySpark it's trickier to retrieve a table's definition (code adapted after Dennes Torres' presentation at Toboggan Winter edition 2024):

%%pyspark
import pyarrow.dataset as pq
import os
import re

def show_metadata(file_path, table_name):
    #returns a delta table's metadata 

    print(f"\{table_name}:")
    schema_properties = pq.dataset(file_path).schema.metadata
    if schema_properties:
        for key, value in schema_properties.items():
            print(f"{key.decode('utf-8')}:{value.decode('utf-8')}")
    else:
        print("No properties available!")

#main code
path = "/lakehouse/default/Tables"
tables = [f for f in os.listdir(path) if re.match('asset',f)]

for table in tables:
    show_metadata(f"/{path}/"+ table, table)

Output:
\assets:
org.apache.spark.version:3.4.1
org.apache.spark.sql.parquet.row.metadata:{"type":"struct","fields":[
{"name":"Id","type":"integer","nullable":true,"metadata":{}},
{"name":"CreationDate","type":"timestamp","nullable":true,"metadata":{}},
{"name":"Vendor","type":"string","nullable":true,"metadata":{}},
{"name":"Asset","type":"string","nullable":true,"metadata":{}},
{"name":"Model","type":"string","nullable":true,"metadata":{}},
{"name":"Owner","type":"string","nullable":true,"metadata":{}},
{"name":"Tag","type":"string","nullable":true,"metadata":{}},
{"name":"Quantity","type":"decimal(13,2)","nullable":true,"metadata":{}}]}
com.microsoft.parquet.vorder.enabled:true
com.microsoft.parquet.vorder.level:9

Note:
One can list the metadata for all tables by removing the filter on the 'asset' table:

tables = os.listdir(path)

Happy coding!

References:
[1] Delta Lake (2023) Table utility commands (link)
[2] Databricks (2023) DESCRIBE TABLE (link)
[3] Microsoft Learn (2023) System Information Schema Views (link)

Related Posts Plugin for WordPress, Blogger...

About Me

My photo
Koeln, NRW, Germany
IT Professional with more than 24 years experience in IT in the area of full life-cycle of Web/Desktop/Database Applications Development, Software Engineering, Consultancy, Data Management, Data Quality, Data Migrations, Reporting, ERP implementations & support, Team/Project/IT Management, etc.