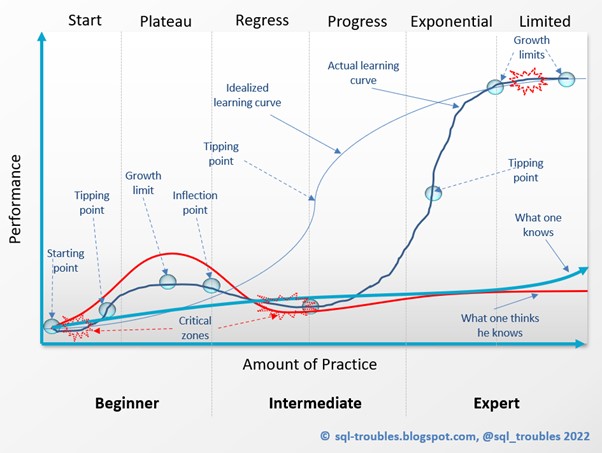
A learning curve attempts depicting the (average) time it takes a person to learn how to use a method, tool, or technique, tracing the path from newbie to mastery. A common definition of the learning curve is based on the correlation between a learner’s performance on a task or activity and the number of attempts or amount of time required to complete it.
There are
several diagrams in circulation which depict the correlation between the
difficulty of Power BI concepts and probably their implementation as functionality.
Even if they reflect to some degree the rate of learning, their simplicity and fuzziness
can easily make one question their accuracy in reflecting the reality.
Researchers
tend to categorize the curves associated with the learning process in simple idealized
patterns like S-curve (aka sigmoid), exponential growth, exponential rise and
fall to limit, or power law, however the learning process in IT-based endeavors is
seldom characterized by a linear or exponential curve, given that the tasks
seldom allow a steady path. The jumps of knowledge between tasks can be wide
enough to appear insurmountable, and they can prove to be quite of a challenge without
some help.
Like a baby’s
first steps, we, as learners, must learn first to crawl, before making some unsteady
steps, and it can take long time until visible progress is made. It’s a slow progress
until we suddenly hit a (tipping) point from which everything seems easy, fact
that increases our confidence in us. On the other side, when we find that we
make no visible progress for a long period, it’s easy to arrive to the opposite,
a critical zone, which in extremis could make one lose interest.
As
beginners, after the first tipping point on the learning journey, it’s easy to
arrive at a plateau in which there seem no need to learn new things, the
current knowledge allowing to handle a range of tasks of small to average
complexity. This can last for a long time, and then, a big thing comes our way
– a hard problem to solve or a concept hard to understand. It’s the point where
we stagnate, and the deeper we go, and the more such challenges are thrown in
our way, the more difficult the learning seems to be. However, with new
understanding, small steps are made, one step after the other, the pace makes
us to evolve faster until we reach again a critical point from which the
process increases smoothly until we seem to stagnate again. We meet again a
hard limit to growth, which seems to be more solid than the previous one.
Both limits
to growth can appear to be hard, however, considering that the knowledge in the
field expands, more opportunity for growth appear, thus, the limits are apparent. Even if knowledge tends to increase ‘indefinitely’, the limits are
there in terms of complexity, time available, knowledge quality (incl.
availability) or any other dimension of the learning process. Moreover, these
successions of tipping points, growth limits, plateaus, critical, steady
and fast progress zones can occur in several iterations in the learning path.
Thus, the path seems to resemble a snakelike curve with many ups and downs.
For the
learner is important to be aware of this last aspect, there are always ups and
downs, taking effort, patience and maybe an expert’s help to bridge the gaps in
between. The chances are high that the gap between what we think we know and
what we know is considerable, therefore a reality check is useful from time to
time. A new problem to tackle will provide that occasion!
Previous Post <<||>> Next Post


No comments:
Post a Comment