21 August 2022

🧮ERP: Planning (Part V: It’s all about Partnership II)

When starting an ERP implementation project an organization needs to fill the existing knowledge gaps in respect to whatever it takes to achieve the goals associated with the respective project. Therefore, it makes sense to work with a implementer that can help cover the gaps directly or indirectly. Moreover, it makes sense to establish a long-term relationship that would allow to harness ERP system’s capabilities after project’s end, increase the ROI and, why not, find other areas of cooperation. It’s in theory what a partner does, and a strategic technology partnership is about – providing any kind of technological expertise the customer doesn't have in-house. 

Unfortunately, from being a ‘service provider’ to becoming a ‘partner’ is a challenging road for many organizations, especially when this type of relationship is not understood and managed accordingly. Partnership’s management may resume in defining common goals, principles, values and processes, establishing a communication strategy and a common understanding of the challenges and the steps ahead, providing visibility into the cost estimates, billing, resources’ availability and utilization. Addressing these aspects would offer a framework on which the partnerships can nourish. Without considering these topics, the implementer remains just a 'service provider', no matter of the names used to characterize the relationship. 

Now, the use of the word ‘partner’ would make someone think that only one partner is considered, typically a big to middle-sized organization that would have this kind of resources. The main reason behind this reasoning is that the number of functional areas and volume of skillset required for filling the requirements of an implementation are high compared with other projects, the resources needing to be available on-demand without affecting the other constraints: costs, quality, time. This can be challenging, therefore can be met scenarios in which two or more external organizations are involved in the partnership, ideally organizations that complement each other. 

It is common in ERP implementations to appeal also to individual consultants for specific areas or the whole project. The principles and values of a partnership, as well the framework behind, can be applied to individual consultants as well. Independently of resources’ provenience more important is the partnership ‘mindset’ - being together in the same boat, working together on a shared and understood strategy, with clear goals and objectives.

Moreover, the people participating in the project must have a ‘partner's mindset’ as well. Without this, the project will likely get different impulses in the wrong direction(s), as a group’s interests will take priority over the ones of the organization. Ideally, this mindset should extend to the whole organization as topics like Data Quality and Process Improvement must be an organization’s effort, deeply imprinted in organization’s culture.

More like ever, it’s important for the business to see and treat the IT department as a ‘partner’ and not as a ‘service provider’ by providing the needed level of transparency in requirements, issues, practices and processes, by treating the IT department as equal party in the decision-making and addressing its current and future strategical requirements. Ideally, this partnership should happen long before the implementation starts, given that it takes time for mentalities and practices to change, for knowledge to be acquired and used appropriately. 

Building a partnership takes time, effort and strategic thinking, this on top of the actual implementation, increasing thus the overall complexity, at least at the beginning. Does it pay off? Like in a marriage, it’s useful to have somebody you can trust, who knows you, whom you can rely upon, and talk with to find solutions. However, only time will tell whether such expectations are met and kept till the end. 

Previous <||> Next

09 August 2022

🧭🪄Business Intelligence: Power BI (Part I: Power BI's Learning Curve I)

A learning curve attempts depicting the (average) time it takes a person to learn how to use a method, tool, or technique, tracing the path from newbie to mastery. A common definition of the learning curve is based on the correlation between a learner’s performance on a task or activity and the number of attempts or amount of time required to complete it.

There are several diagrams in circulation which depict the correlation between the difficulty of Power BI concepts and probably their implementation as functionality. Even if they reflect to some degree the rate of learning, their simplicity and fuzziness can easily make one question their accuracy in reflecting the reality.

Researchers tend to categorize the curves associated with the learning process in simple idealized patterns like S-curve (aka sigmoid), exponential growth, exponential rise and fall to limit, or power law, however the learning process in IT-based endeavors is seldom characterized by a linear or exponential curve, given that the tasks seldom allow a steady path. The jumps of knowledge between tasks can be wide enough to appear insurmountable, and they can prove to be quite of a challenge without some help.

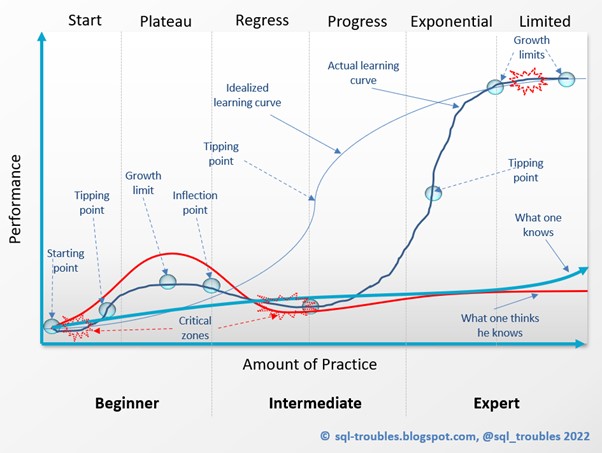
Like a baby’s first steps, we, as learners, must learn first to crawl, before making some unsteady steps, and it can take long time until visible progress is made. It’s a slow progress until we suddenly hit a (tipping) point from which everything seems easy, fact that increases our confidence in us. On the other side, when we find that we make no visible progress for a long period, it’s easy to arrive to the opposite, a critical zone, which in extremis could make one lose interest.

As beginners, after the first tipping point on the learning journey, it’s easy to arrive at a plateau in which there seem no need to learn new things, the current knowledge allowing to handle a range of tasks of small to average complexity. This can last for a long time, and then, a big thing comes our way – a hard problem to solve or a concept hard to understand. It’s the point where we stagnate, and the deeper we go, and the more such challenges are thrown in our way, the more difficult the learning seems to be. However, with new understanding, small steps are made, one step after the other, the pace makes us to evolve faster until we reach again a critical point from which the process increases smoothly until we seem to stagnate again. We meet again a hard limit to growth, which seems to be more solid than the previous one.

Power BI's learning curve

Both limits to growth can appear to be hard, however, considering that the knowledge in the field expands, more opportunity for growth appear, thus, the limits are apparent. Even if knowledge tends to increase ‘indefinitely’, the limits are there in terms of complexity, time available, knowledge quality (incl. availability) or any other dimension of the learning process. Moreover, these successions of tipping points, growth limits, plateaus, critical, steady and fast progress zones can occur in several iterations in the learning path. Thus, the path seems to resemble a snakelike curve with many ups and downs.

For the learner is important to be aware of this last aspect, there are always ups and downs, taking effort, patience and maybe an expert’s help to bridge the gaps in between. The chances are high that the gap between what we think we know and what we know is considerable, therefore a reality check is useful from time to time. A new problem to tackle will provide that occasion!

Previous Post <<||>> Next Post

Related Posts Plugin for WordPress, Blogger...

About Me

My photo
Koeln, NRW, Germany
IT Professional with more than 24 years experience in IT in the area of full life-cycle of Web/Desktop/Database Applications Development, Software Engineering, Consultancy, Data Management, Data Quality, Data Migrations, Reporting, ERP implementations & support, Team/Project/IT Management, etc.