Introduction
Changing Columns' length
In Design mode drag of the columns to match the length of the attributes stored in them. This might require several tries.
Adding a Header/Footer
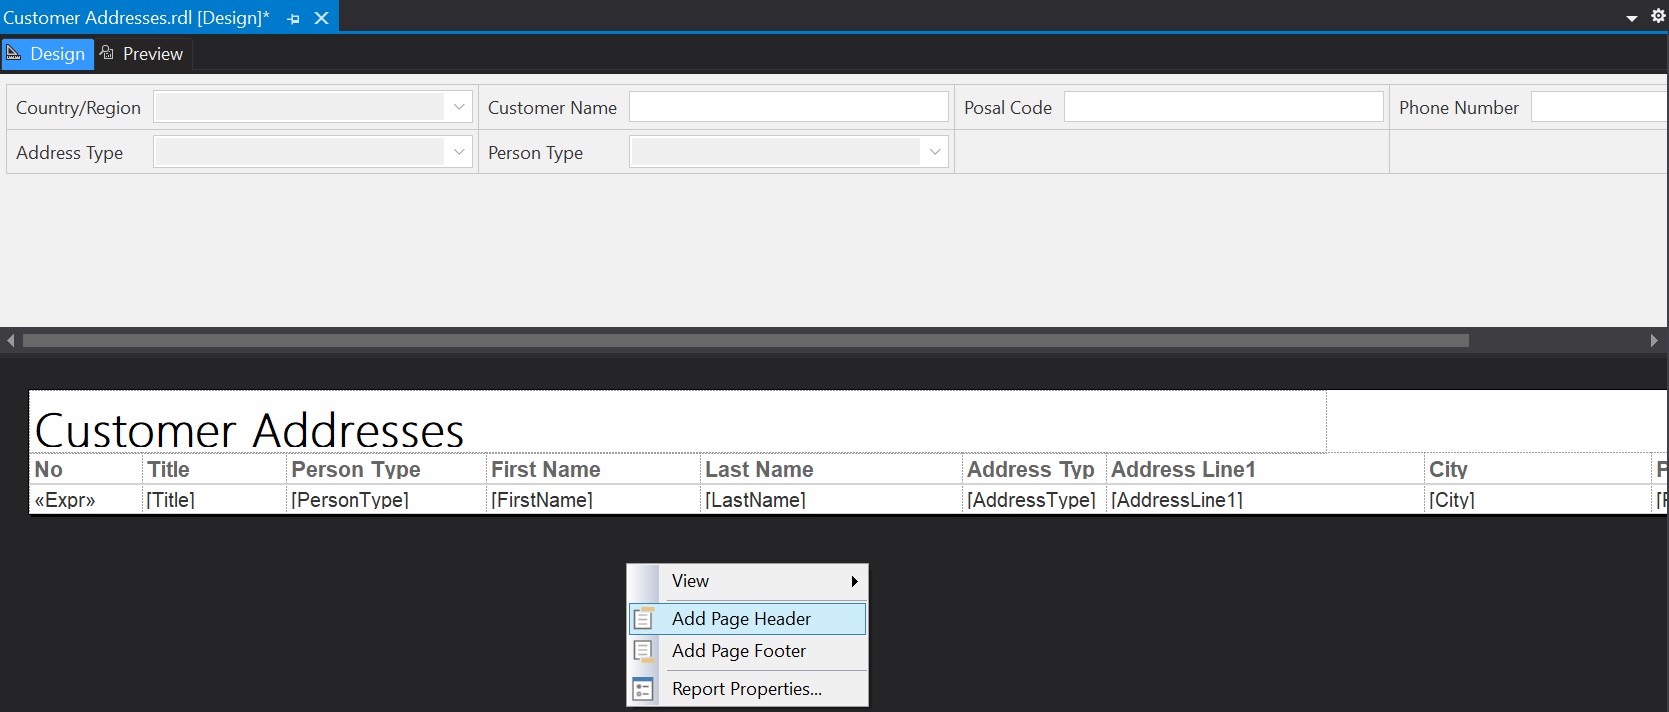
In Within reports body right click and from the floating menu choose 'Add Page Header', respectively 'Add Page Footer' like in the below screenshot:
Adding the header/footer
Usually in the head I consider report's name as well two text boxes containing the date at which the report was added, respectively the number of pages the report displays.
Cut report's header textbox from report's body into the header and move it to match the leftmost side of the report. In the header add two text boxes and provide the following formulas for the current date, respectively the number of pages:
= Now().Date().ToString("dd.MM.yyyy"))
= Globals!PageNumber & " from " & Globals!TotalPages
Then drag of controls to match the dimensions of the blow grid like in the screen below:
 Header
Note:
Then It's important to align the various controls so their margins match together, otherwise will be added empty columns or rows in the Excel exports, users having to delete the empty cells manually each time they want to use the data.
Adding the Parameters:
Even if the parameters are displayed within browser, as soon the data are exported to Excel they are lost. Therefore, to identify with which values the report was used, it is useful to add the parameters in table's header. Add one or two lines above the header, and merge a few cells to accommodate the parameters as below:

The merged cells contain the following formulas:
= "Country: " & Parameters!Country.Label
= "Customer Name: " & Parameters!CustomerName.Value
= "Postal Code: " & Parameters!PostalCode.Value
= "Phone Number:" & Parameters!PhoneNumber.Value
= "Address Type: " & Parameters!AddressType.Label
= "Person Type: " & Parameters!PersonType.Label
Formatting Table
One can go with the available formatting, however table's header could be changed of 10 pt font size. One can add also a background color for the header, format the top and bottom border and align columns' name in the center. The background color for the rows with the parameters must be non-transparent (e.g. white) if the header is fixed.
As concerns the data rows, one can add different colors for alternate rows. For this select the row and as background color provide the following formula:
=IIf(RowNumber(Nothing) Mod 2 = 0, "White", "LightSteelBlue")
Freezing the Header
One can freeze the header during scrolling by setting the property FixedData='True' for each static row. For this you need to change to Advance mode and set FixedData property for the first three static rows as follows:

Thus, when scrolling, the header will remain fix:

Probably the choice of collars is not the best, though it can be for example adapted to organizations' colors. One can add also a logo, the name of the user who run the report, or whatever information are still needed.


No comments:
Post a Comment