Showing posts with label SQL Server Administration. Show all posts

13 January 2021

SQL Server Administration: Undocumented IV (DBCC SQLPERF)

Besides the documented LOGSPACE parameter (see previous post), DBCC SQLPERF utility has several undocumented parameters which allow providing statistics about schedulers, threads, spinlocks, IO, network, read-aheads, respectively waits.  

Scheduler Statistics

By providing 'umsstats' as parameter, the utility returns as result the visible UMS schedulers on the system:

-- visible UMS schedulers
DBCC SQLPERF(umsstats)

Output:
StatisticValue
Node Id0
Avg Sched Load5
Sched Switches6903
Sched Pass6721358
IO Comp Passes11334
Scheduler ID0
    online1
    num tasks6
    num runnable0
    num workers9
    active workers6
    work queued0
    cntxt switches7125444
    cntxt switches(idle)9898903
    preemptive switches2304
Scheduler ID1
    online1
    num tasks6
    num runnable0
    num workers9
    active workers5
    work queued0
    cntxt switches3370432
    cntxt switches(idle)4427991
    preemptive switches22729

The fields have the following meaning: 
StatisticDescription
Node Id
Avg Sched Load
Sched SwitchesThe number of switches between schedulers
Sched Pass
IO Comp Passes
Scheduler IDThe scheduler's zero-based ID number
num tasksThe number of tasks associated with the scheduler
num runnableThe number of workers on the runnable list
num workersThe total number of workers associated with the scheduler
idle workersThe number of idle workers
work queuedThe number of items waiting to be processed in the work queue
cntxt switchesThe number of switches between workers for the scheduler
cntxt switches(idle)The number of times the idle loop was switched into

The functionality is useful when one suspects that there are issues related to the visible schedulers.

Detailed information about the schedulers can be found also via the sys.dm_os_schedulers DMV.

Threads Statistics

By providing 'threads' as parameter, the utility returns as result the threads created in the system:

--  thread statistics
DBCC SQLPERF(threads)

Output (just the first records):
SpidThread IDStatusLoginNameIOCPUMemUsage
111228backgroundsa000
212572backgroundsa000
312576backgroundsa000
411884backgroundsa000
512964backgroundsa000
612960backgroundsa004
712968backgroundsa000

Detailed information about the schedulers can be found also via the sys.dm_os_threads DMV.

IO Statistics

By providing 'iostats' as parameter, the utility returns as result a count of the outstanding reads, respectively writes:

--  IO statistics
DBCC SQLPERF(iostats)

Output:
StatisticValue
Reads Outstanding0
Writes Outstanding0

Network Statistics

By providing 'netstats' as parameter, the utility returns as result network-related statistics:

--  network statistics
DBCC SQLPERF(netstats)

Output:
StatisticValue
Network Reads6976
Network Writes9036
Network Bytes Read5318957
Network Bytes Written2,222512E+07
Command Queue Length0
Max Command Queue Length0
Worker Threads0
Max Worker Threads0
Network Threads0
Max Network Threads0

Read Ahead Statistics

By providing 'rastats' as parameter, the utility returns read-ahead statistics:

--  read ahead statistics
DBCC SQLPERF(rastats)

Output
StatisticValue
RA Pages Found in Cache0
RA Pages Placed in Cache0
RA Physical IO0
Used Slots0

Spinlock Statistics

By providing 'spinlockstats' as parameter, the utility returns the spinlock statistics, where a spinlock is a a lightweight synchronization object used to serialize access to data structures which are typically held for a short period of time:

--  spinlock statistics
DBCC SQLPERF(spinlockstats)

Output:
Spinlock NameCollisionsSpinsSpins/CollisionSleep Time (ms)Backoffs
LOCK_RW_TEST00000
LOCK_RW_SECURITY_CACHE711210500296,0619054
LOCK_RW_CMED_HASH_SET5175035001
LOCK_RW_ABTX_HASH_SET00000
LOCK_RW_RBIO_REQ00000

Detailed information about the spinlock stats can be found also via the sys.dm_os_spinlock_stats DMV.

Wait Statistics

By providing 'waitstats' as parameter, the utility returns the available wait statistics:

-- wait statistics 
DBCC SQLPERF(waitstats)

Output (only a few records):
Wait TypeRequestsWait TimeSignal Wait Time
LCK_M_SCH_M185973
LCK_M_S13168950
PAGEIOLATCH_SH17893856825
PAGEIOLATCH_UP1181010
PAGEIOLATCH_EX7361049016

Detailed information about the wait stats can be found also via sys.dm_os_wait_stats DMV.

Notes:
As Microsoft warns, the undocumented features shouldn't be used into production environments as they will be deprecated in future versions. Instead should be used the documented DMVs, when available. 
All objects mentioned above require VIEW SERVER STATE permissions.
The DBCC SQLPERF utility allows resetting the latch, spinlock, respectively the wait statistics by providing the following parameters (see the SQL Docs for more information): 

-- resetting the latch statistics
DBCC SQLPERF('sys.dm_os_wait_stats', CLEAR)

-- resetting the spinlock statistics
DBCC SQLPERF ('sys.dm_os_spinlock_stats', CLEAR);  

-- resetting the wait statistics
DBCC SQLPERF('sys.dm_os_latch_stats', CLEAR)

DBCC PERFMON provides in a single call the IO, network, read ahead, spinlocks, respectively the wait statistics in distinct resultsets:

-- performance statistics
DBCC PERFMON

SQL Server Administration: Monitoring the Database Logs

One of the aspects to monitor on a SQL Server instance is the size of the logs available for each database, respectively the degree to which the logs are used. Starting with SQL Server 2005 this could be achieved by using the 'Log File(s) Used Size (KB)' and 'Log File(s) Size (KB)'  counters via the sys.dm_os_performance_counters DMV as follows:

-- log files - size (kb)
SELECT lfu.instance_name database_name
, lfu.cntr_value size_kb
, Cast(lfu.cntr_value/1024.00 as decimal (18,2)) size_MB
FROM sys.dm_os_performance_counters lfu 
WHERE lfu.counter_name LIKE  'Log File(s) Size (KB)%' 
  AND lfu.object_name LIKE 'SQLServer:Databases%'
  AND lfu.instance_name IN ('tempdb', 'master', 'model', 'msdb')
ORDER BY lfu.instance_name

-- log files - used size (kb)
SELECT lfs.instance_name database_name
, lfs.cntr_value used_size_kb
, Cast(lfs.cntr_value/1024.00 as decimal (18,2)) used_size_MB
FROM sys.dm_os_performance_counters lfs
WHERE lfs.counter_name LIKE  'Log File(s) Used Size (KB)%' 
  AND lfs.object_name LIKE 'SQLServer:Databases%'
  AND lfs.instance_name IN ('tempdb', 'master', 'model', 'msdb')
ORDER BY lfs.instance_name

The two queries can be combined into one as follows:

-- database log space allocation (SQL Server 2005+)
SELECT db.name database_name
, db.log_reuse_wait_desc 
, Cast(lfs.cntr_value/1024.00 as decimal(28,2)) size_MB
, Cast(lfu.cntr_value/1024.00 as decimal(28,2)) AS used_MB
, Cast(100.00*lfu.cntr_value/lfs.cntr_value as decimal(10,2)) used_percent 
, CASE WHEN CAST(lfu.cntr_value AS float) / CAST(lfs.cntr_value AS float) > .5 THEN 
   CASE 
    WHEN db.name = 'tempdb' AND log_reuse_wait_desc NOT IN ('CHECKPOINT', 'NOTHING') THEN 'WARNING'  
    WHEN db.name <> 'tempdb' THEN 'WARNING' 
    ELSE 'OK' 
    END 
  ELSE 'OK' END log_status 
FROM sys.databases db 
     JOIN sys.dm_os_performance_counters lfs 
       ON db.name = lfs.instance_name 
      AND lfs.counter_name LIKE 'Log File(s) Size (KB)%' 
     JOIN sys.dm_os_performance_counters lfu 
       ON db.name = lfu.instance_name 
      AND lfu.counter_name LIKE  'Log File(s) Used Size (KB)%' 
WHERE db.name IN ('tempdb', 'master', 'model', 'msdb')
ORDER BY db.name 

Output:
database_namelog_reuse_wait_descsize_MBused_MBused_percentlog_status
masterNOTHING1.991.1155.78WARNING
modelNOTHING7.991.7421.80OK
msdbNOTHING28.801.966.81OK
tempdbNOTHING999.990.690.07OK

Starting with SQL Server 2012 the same information can be obtained via the sys.dm_db_log_space_usage DMV, however the view returns information only for the current database:

-- getting the log space only for a database (SQL Server 2012+)
SELECT db_name(database_id) database_name 
, Cast(total_log_size_in_bytes/1024.00/1024.00 as decimal(28,2)) size_MB
, Cast(used_log_space_in_bytes/1024.00/1024.00 as decimal(28,2)) used_MB
, Cast(used_log_space_in_percent as decimal(28,2)) used_percent
FROM sys.dm_db_log_space_usage

Output:
database_namesize_MBused_MBused_percent
master1.991.1959.61

With less flexibility one can obtain the size in MB and the used percentage by using the DBCC utility as follows:

-- retrieving the log usage for all databases
DBCC SQLPERF(LOGSPACE); 

Output:
Database NameLog Size (MB)Log Space Used (%)Status
master1,99218833,137260
tempdb999,99220,063525890
model7,99218821,114370
msdb28,804696,6178460
AdventureWorks201433,9921914,766720
AdventureWorksDW201417,9921922,68780

Notes:
1. All the mentioned objects require VIEW SERVER STATE permissions.
2. The solution based on the performance counters returns slightly different values than the other solutions, though the differences are neglectable. 

Resources: 
[1] SQL Docs (2017) sys.dm_os_performance_counters [source]
[2] SQL Docs (2017) DBCC SQLPERF [source]
[3] SQL Docs (2017) sys.dm_db_log_space_usage [source]

06 July 2020

SQL Server Administration: Undocumented III (SQL Server CPU Utilization via the Ring Buffer)

Introduction

If no proper monitoring solution of the SQL Server and the hosting server is in place to review the CPU utilization, one can use the Scheduler Monitor buffer provided by the undocumented sys.dm_os_ring_buffers data management view (DMV). Introduced with SQL Server 2005, the DMV provides significant amount of diagnostic memory information in XML form via several buffers: Resource Monitor, Out-of-Memory, Memory Broker, Buffer Pool, respectively Scheduler Monitor buffer [2]. A ring buffer is a recorded response to a notification [1].

The view changed between the various versions of SQL Server, while with the introduction of Always On availability groups in SQL Server 2017 further buffer rings were made available (see [5]).

Warning:
According to Microsoft (see [4] the sys.dm_os_ring_buffers is provided only for information purposes, the future compatibility post SQL Server 2019 being not guaranteed!

Querying the Scheduler Monitor Buffer

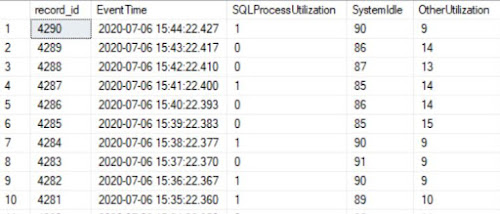
Within the Scheduler Monitor buffer, the DMV stores a history of 4 hours uptime with minute by minute data points (in total 256 entries) with the CPU utilization for the SQL Server, other processes, respectively the system idle time as percentages. It allows thus to identify the peaks in CPU utilization and thus to determine the intervals of focus for further troubleshooting. As the data are stored within an XML structure, the values can be queried via the XQuery syntax as follows: 

-- cpu utilization for SQL Server and other applications
DECLARE @ts_now bigint = (SELECT cpu_ticks/(cpu_ticks/ms_ticks)
        FROM sys.dm_os_sys_info); 

SELECT DAT.record_id
, DAT.EventTime
, DAT.SQLProcessUtilization 
, DAT.SystemIdle 
, 100 - (DAT.SystemIdle + DAT.SQLProcessUtilization) OtherUtilization
FROM ( 
	SELECT record.value('(./Record/@id)[1]', 'int') record_id
	, record.value('(./Record/SchedulerMonitorEvent/SystemHealth/SystemIdle)[1]', 'int') SystemIdle 
	, record.value('(./Record/SchedulerMonitorEvent/SystemHealth/ProcessUtilization)[1]', 'int') SQLProcessUtilization
	, EventTime 
	FROM ( 
		SELECT DATEADD(ms, -1 * (@ts_now - [timestamp]), GETDATE()) EventTime
		, [timestamp]
		, CONVERT(xml, record) AS [record] 
		FROM sys.dm_os_ring_buffers 
		WHERE ring_buffer_type = N'RING_BUFFER_SCHEDULER_MONITOR' 
		  AND record LIKE N'%<SystemHealth>%') AS x 
	) AS DAT
ORDER BY DAT.record_id DESC;

If the SQL Server is not busy as all, the SQL Server utilization time may tend to 0%, while the system idle time to 90%. (It's the case of my SQL Server lab.)

CPU Utilization for my home lab
CPU Utilization for my home SQL Server lab

Notes:
If the server was restarted within the last 4 hours, then the points will have a gap between two readings corresponding to the downtime interval.
The query is supposed to run also on Linux machines, though the SystemIdle time will be 0. One can thus consider the SQL and non-SQL CPU utilization.

Storing the History

The above query can be run on a regular basis (e.g. every 3-4 hours) via a SSIS package and push the data into a table for historical purposes. Because is needed to have a continuous history of the readings, it's better if the gap between runs is smaller than the 4 hours. No matter of the approach used is better to check for overlappings when storing the data:

-- dropping the table
-- DROP TABLE IF EXISTS dbo.T_RingBufferReadings 

-- reinitilizing the history
-- TRUNCATE TABLE dbo.T_RingBufferReadings

-- creating the table
CREATE TABLE dbo.T_RingBufferReadings (
  Id bigint IDENTITY (1,1) NOT NULL
, RecordId bigint 
, EventTime datetime2(3) NOT NULL
, SQLProcessUtilization int NOT NULL
, SystemIdle int NOT NULL
, OtherUtilization int NOT NULL
)


-- reviewing the data
SELECT *
FROM dbo.T_RingBufferReadings 
ORDER BY EventTime DESC

If there are many records, to improve the performance, one can create also an index, which can include the reading points as well:

-- creating a unique index with an include 
CREATE UNIQUE NONCLUSTERED INDEX [UI_T_RingBufferReadings_EventTime] ON dbo.T_RingBufferReadings
(
	EventTime ASC,
    RecordId ASC
) INCLUDE (SQLProcessUtilization, SystemIdle, OtherUtilization)
GO

The above query based on the DMV becomes:

-- cpu utilization by SQL Server and other applications
DECLARE @ts_now bigint = (SELECT cpu_ticks/(cpu_ticks/ms_ticks)
        FROM sys.dm_os_sys_info); 

INSERT INTO dbo.T_RingBufferReadings
SELECT record_id
, DAT.EventTime
, DAT.SQLProcessUtilization 
, DAT.SystemIdle 
, 100 - (DAT.SystemIdle + DAT.SQLProcessUtilization) OtherUtilization
FROM ( 
	SELECT record.value('(./Record/@id)[1]', 'int') record_id
	, record.value('(./Record/SchedulerMonitorEvent/SystemHealth/SystemIdle)[1]', 'int') SystemIdle 
	, record.value('(./Record/SchedulerMonitorEvent/SystemHealth/ProcessUtilization)[1]', 'int') SQLProcessUtilization
	, EventTime 
	FROM ( 
		SELECT DATEADD(ms, -1 * (@ts_now - [timestamp]), GETDATE()) EventTime
		, [timestamp]
		, CONVERT(xml, record) AS [record] 
		FROM sys.dm_os_ring_buffers 
		WHERE ring_buffer_type = N'RING_BUFFER_SCHEDULER_MONITOR' 
		  AND record LIKE N'%<SystemHealth>%') AS x 
	) AS DAT
	LEFT JOIN dbo.T_RingBufferReadings RBR
	  ON DAT.record_id = RBR.Recordid 
WHERE RBR.Recordid IS NULL
ORDER BY DAT.record_id DESC;

Note:
A ServerName column can be added to the table if is needed to store the values for different SQL Servers. Then the LEFT JOIN has to consider the new added column. 
Either of the two queries can be used to display the data points within a chart via SSRS, Power BI or any reporting tool available. 

Happy coding!

References:
[1] Grant Fritchey (2014) SQL Server Query Performance Tuning: Troubleshoot and Optimize Query Performance in SQL Server 2014, 4th Ed.
[2] Sunil Agarwal et al (2005), Troubleshooting Performance Problems in SQL Server 2005, Source: TShootPerfProbs.docx
[3] Sunil Agarwal et al (2008), Troubleshooting Performance Problems in SQL Server 2008, Source: TShootPerfProbs2008.docx
[4] Microsoft SQL Docs (2018) Related Dynamic Management Views, Source
[5] Microsoft SQL Docs (2017) Use ring buffers to obtain health information about Always On availability groups, Source

27 June 2020

SQL Server Administration: Undocumented II (Execute Command for Each Table)

One neat undocumented feature useful in the administration of the SQL Server is the sp_MSforeachtable stored procedure which allows executing a set of several commands against each table available into the current database, or, with a few changes, against a set of predefined tables.  It allows running up to 3 commands as part of the main processing, as well a pre-command, typically used to set variable environments or perform initializations, respectively a post-command, typically used for control and cleanup processes. It replaces thus the need to run the commands within a cursor, even if the latter can occasionally provide more flexibility (see example).

The stored procedures provides the following parameters:
@command1, @command2, @command3: the main commands to be executed (at least the first command must be executed)
@precommand: a command to be executed before the @command1,
@postcommand: a command to be executed after all the commands were executed successfully,
@replacechar: the character used to represent the table within the commands, by default a question mark (?) character
@whereand: used to limit the scope only to a set of tables 

Before the introduction of Data Management Views with SQL Server 2005, the stored procedure was used to get the number of records for all tables:

-- getting the number of records for each table
EXEC sp_MSForEachTable @command1='SELECT ''?'' [Table], COUNT(*) NoRecords FROM ?'

To restrict running the command(s) only for a table, the object_id function can be used within the @whereand parameter:

-- getting the number of records for a table
EXEC sp_MSforeachtable @command1='SELECT ''?'' [Table], COUNT(*) NoRecords FROM ?' --
      , @whereand = ' And Object_id = Object_id(''[Person].[Address]'')'

In AX 2009 and even the later versions including Dynamics 365 (as long the direct access to the database is possible) the number of records could be restricted to a given company (aka business unit):

-- getting the number of records from a mandant
sp_MSforEachTable @command1 = 'SELECT ''?'' [Table], COUNT(*) NoRecords FROM WHERE DataAreaId IN (''DAT'')'

The procedude can be used to perform CRUD operayions on each table. During a data migration it was possible to clean out the business units not needed with just a simple script:

--delete the data for multiple data areas
 sp_MSforEachTable @command1 = 'DELETE FROM ? WHERE DataAreaId IN (''m01'')'

Administrations tasks can be performed as well, e.g. updating statistics, performing consistency checks for each table, etc.:

-- for each table 
EXEC sp_MSforeachtable 'EXEC sp_spaceused ''?''' -- displaying the disk space researved/used
EXEC sp_MSforeachtable 'UPDATE statistics ? WITH ALL' -- updating statistics
EXEC sp_MSforeachtable 'DBCC CHECKTABLE (''?'') WITH ALL_ERRORMSGS, NO_INFOMSGS' -- check table considerncy 

A set of tasks can be performed for a single table by providing the constraint within the @whereand parameter:

-- executing multiple commands for a table
EXEC sp_MSforeachtable @command1='UPDATE statistics ? WITH ALL' -- updating statistics
   , @command2= 'DBCC CHECKTABLE (''?'') WITH ALL_ERRORMSGS, NO_INFOMSGS' -- check table considerncy 
   , @whereand = ' And Object_Name(Object_id) = ''[Person].[Address]'''

Executing the commands against a subset of tables involves using a persisted or temporary table to store the name of the tables which shoul be considered, eventually with further metadata to allow filtering:

-- dropping the table
-- DROP TABLE IF EXISTS #Tables

-- create a temporary table
SELECT TableName
INTO #Tables 
FROM (VALUES ('[Person].[Address]')
, ('[Person].[AddressType]')
, ('[Person].[BusinessEntity]')) DAT(TableName)

-- getting the number of records for the list of tables
EXEC sp_MSForEachTable @command1='SELECT ''?'' [Table], COUNT(*) NoRecords FROM ?'
, @whereand = ' And Object_id In (Select Object_id(TableName) FROM #Tables)'

Warnings:
Do not forget to dump the temporary table when finished!
The code is provided only for exemplification purposes. You can use the above code on your own risk!
Undocumented features can be deprecated in future versions of SQL Server, therefore they should be used with precaution in long-term solutions.

Happy coding!:

25 June 2020

SQL Server Administration: Undocumented I (Reading the SQL Server Log)

Starting SQL Server 2005 Microsoft made available the sys.xp_readerrorlog system stored procedure, which allows reading the SQL Server as well the SQL Server Agent logs one by one. Since I learned about it, I prefer using it to search for errors in the log instead of using the Management Studio because it allows more flexibility and often seems to be much faster than the Log File Viewer.

The stored procedure exposes the following parameters:
p1: numeric value identifying the index of the log file: 0 = current, 1 = archive #1, 2 = archive #2, ...
p2: log file type: 1 or NULL = SQL Server log, 2 = SQL Agent log
p3: the string  to search for (e.g. Error)
p4: a second string t to search for (allows refining the results)
p5: start time of the events to be considered
p6: end time of the events to be considered
p7: sorting order for results: N'asc' = ascending, N'desc' = descending

The only required parameter is the first, thus the stored procedure can be called as follows:

-- reading the current SQL Server log (to be run individually)
EXEC xp_readerrorlog 0
EXEC xp_readerrorlog 0, 1
EXEC xp_readerrorlog 0, 1, N'Login failed' -- filters for failed logins 
EXEC xp_readerrorlog 0, 1, N'DBCC CHECKDB' -- filters for database consistency checks 
EXEC xp_readerrorlog 0, 1, N'Error' -- filters the Errors
EXEC xp_readerrorlog 0, 1, N'Error', N'Severity: 14' -- filters the Errors with severity 14
EXEC xp_readerrorlog 0, 1, N'', N'', '20200601', NULL, NULL -- start date
EXEC xp_readerrorlog 0, 1, N'', N'', '20200601', '20200607', NULL -- start date & end date 
EXEC xp_readerrorlog 0, 1, N'', N'', NULL, NULL, N'asc' -- ascending sorting

-- reading the last SQL Server log
EXEC xp_readerrorlog 1, 1


-- reading the current SQL Agent log
EXEC xp_readerrorlog 0, 2

Especially when filtering for certain information, the output can be displayed easily into a SSRS report. Besides errors typically I'm looking for failed logins or the results of consistency checks.

The number of log files available depends on how the SQL Server Logs were configured.

Even if the stored procedure provides the needed information fast, the error and the corresponding description are shown in separate records with the same timestamp. To process the records one can use a temporary table matching output's definition. To facilitate the selection of consecutive records a primary key can be added as well. One can dump into the table some or all of the log files and perform various searches or analyses.

-- dropping the table
--DROP TABLE IF EXISTS #tbl 

-- creating a temporary table
CREATE TABLE #tbl (
  id int IDENTITY(1,1) NOT NULL
, LogDate datetime2(3)
, ProcessInfo nvarchar(50)
, LogText varchar(max))    
  
-- reading the current log into it
INSERT INTO #tbl        
EXEC sys.xp_readerrorlog 0, 1

-- reading the last archive log into it
INSERT INTO #tbl        
EXEC sys.xp_readerrorlog 1, 1

-- retrieving the errors together with their descriptions 
SELECT A.LogDate
, A.ProcessInfo
, A.LogText
, B.LogText
FROM #tbl A
     JOIN #tbl B
    ON A.Id = B.Id - 1
WHERE A.LogText LIKE '%Error:%'

Here's the output of the last query (it will look differently on your server):


The temporary table can be used for further analyses (e.g. displaying the first, respectively last occurrence of the error together with a count):

-- first/last occurence of an error 
SELECT Min(A.LogDate) FirstOccurence
, Max(A.LogDate) LastOccurence
, count(*) NoRecords 
, A.LogText
, B.LogText
FROM #tbl A
     JOIN #tbl B
    ON A.Id = B.Id - 1
WHERE A.LogText LIKE '%Error:%'
GROUP BY A.LogText
, B.LogText


Warnings:
Do not forget to dump the temporary table when finished!
The code is provided only for exemplification purposes. You can use the above code on your own risk!
Be careful when the number of records in the logs is too big, because reading all the records can create temporary performance issues!
Undocumented features can be deprecated in future versions of SQL Server, therefore they should be used with precaution in long-term solutions.

Happy coding!

01 May 2019

Database Management: SQL Server Feature Bloat

Database Management
Database Management Series

In an old SSWUG editorial “SQL Server Feature Bloat” by Ben Taylor, the author raises the question on whether SQL Server features like the support for Unicode, the increase in page size for data storage to 8k or the storage of additional metadata and statistics create a feature bloat. He further asks on whether customers may consider other database solutions, and on whether this aspect is important for customers.

A software or feature bloat is the “process whereby successive versions of a computer program become perceptibly slower, use more memory, disk space or processing power, or have higher hardware requirements than the previous version - whilst making only dubious user-perceptible improvements or suffering from feature creep” (Wikipedia).

Taylor’s question seems to be entitled, especially when is considered the number of features added in the various releases of SQL Server. Independently on whether they attempt to improve performance, extend existing functionality or provide new functionality, many of these features target special usage and are hardly used by average applications that use SQL Server only for data storage. Often after upgrading to a new release, it may happen that the customers see no performance improvement in the features used or the performance even decays, while the new release needs more resources to perform the same tasks. This can make customers wonder on whether all these new features bring any benefit for them.

It’s easy to neglect the fact that the SQL Server is just used as storage layer in an architecture and more likely that some of the problems reside in the business or presentation layers. In addition, not always a solution is designed to take advantage of a database’s (latest) features. Besides, it may happen that the compatibility level is set to a lower value, so the latest functionality won’t be used at all.

Probably the customers hope that the magic will happen immediately after the upgrade. For some features like the ones regarding engine’s optimization are enabled by default and is expected a performance gain, however, to take advantage of the new features the existing applications need to be redesigned. With each new edition it’s important to look at the opportunities provided by the upgrades and analyze the performance benefit as there’s often a trade-off between benefit and effort on one side, respectively between technical advantages and disadvantages on the other.

The examples used by Taylor aren’t necessarily representative because they refer to changes made prior to SQL Server 2005 edition and there are good arguments for their implementation. The storage of additional metadata and statistics is neglectable in comparison with the size of the databases and the benefits, given that the database engine needs statistics so it can operate optimally. SQL Server moved from 2 KB pages to 8 KB pages between versions 6.5 and 7.0 probably because it offers a good performance with efficient use of space. The use of Unicode character set become a standard given that databases needed to support multiple languages.

Feature bloating is not a problem that concerns only SQL Server but also other database products like Oracle, DB2 or MySQL, and other types of software. Customers’ choice of using one vendor’s products over another is often a strategic decision in which the database is just a piece of a bigger architecture. In the TPC-H benchmarks SQL Server 2014 and 2016 scored during the last years higher than the competitors. It’s more likely that customers will move to SQL Server than vice-versa, when possible. Customers expect performance, stability and security and are willing to pay for them, as long the gain is visible.

05 November 2018

SQL Server Administration: End of Life for 2008 and 2008 R2 Versions

SQL Server 2008 and 2008 R2 versions are heading with steep steps toward the end of support - July 9, 2019. Besides an upgrade to upper versions, it seems there is also the opportunity to migrate to an Azure SQL Server Managed Instance, which allows a near 100% compatibility with an on-premises SQL Server installation, or to a Azure VM (see Franck Mercier’s post).

If you aren’t sure which versions of SQL Server you have in your organization here’s a script that can be run on all SQL Server 2005+ installations via SQL Server Management Studio:

SELECT SERVERPROPERTY('ComputerNamePhysicalNetBIOS') ComputerName
 , SERVERPROPERTY('Edition') Edition
 , SERVERPROPERTY('ProductVersion') ProductVersion
 , CASE Cast(SERVERPROPERTY('ProductVersion') as nvarchar(20))
     WHEN '9.00.5000.00' THEN 'SQL Server 2005'
     WHEN '10.0.6000.29' THEN 'SQL Server 2008' 
     WHEN '10.50.6000.34' THEN 'SQL Server 2008 R2' 
     WHEN '11.0.7001.0' THEN 'SQL Server 2012' 
     WHEN '12.0.6024.0' THEN 'SQL Server 2014' 
     WHEN '13.0.5026.0' THEN 'SQL Server 2016'
     WHEN '14.0.2002.14' THEN 'SQL Server 2017'
     ELSE 'unknown'
   END Product 


Resources:
[1] Microsoft (2018) How to determine the version, edition, and update level of SQL Server and its components [Online] Available from: https://support.microsoft.com/en-us/help/321185/how-to-determine-the-version-edition-and-update-level-of-sql-server-an
[2] Microsoft Blogs (2018) SQL Server 2008 end of support, by Franck Mercier [Online] Available from: https://blogs.technet.microsoft.com/franmer/2018/11/01/sql-server-2008-end-of-support-2/

Related Posts Plugin for WordPress, Blogger...

About Me

My photo
IT Professional with more than 24 years experience in IT in the area of full life-cycle of Web/Desktop/Database Applications Development, Software Engineering, Consultancy, Data Management, Data Quality, Data Migrations, Reporting, ERP implementations & support, Team/Project/IT Management, etc.