27 November 2020

🧊Data Warehousing: ETL (Part II: An Introduction)


ETL (Extract, Transform, Load) processes, technologies or tools are about extracting data from one or more data sources via a set of queries, performing changes on the data via conversions, aggregations, mappings or other types of transformations, respectively loading the data into target tables or other type of repositories. Thus, an ETL process allows moving and transforming data between predefined data structures on an ad-hoc basis or as part of stable repetitive processes, which makes ETL ideal for data warehousing, data integrations, data migrations or similar scenarios. 

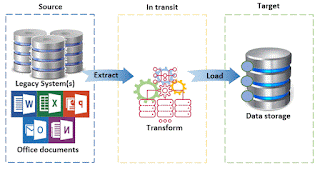
ETL Data Flow

Extract: The extraction of data is done typically based on SQL queries from relational databases or any OLEDB or ODBC-based data repositories including flat or MS Office files, though modern ETL tools can support other type of queries (CAML, XQuery, DAX) or even NoSQL architectures (Handoop). This allows addressing a wide range of requirements, the complexity of the logic depending on the functionality provided by the query languages, respectively the extraction functionality available.  

Transform: The transformation logic can be implemented based on the functionality provided by the ETL tool, and can involve after case any combination of aggregates, conditional splits, merges, lookups, multicasts, pivoting/unpivoting, cleansing, data conversions, sampling, mapping or any other transformations that can be performed on an in-transit dataset. On the other side, quite often the same can be achieved with the help of SQL-based manipulations directly in the extraction logic or later in the process. SQL can prove to be occasionally faster and more flexible than the transformations provided by the ETL tool, however despite the overlaps, the two approaches can complement each other when used adequately. 

Load: The load is usually just a dump of the data into one or more final or intermediary tables with predefined structures. Unless the data don’t match the data type, format or further defined constraints, the load seldom involve further challenges as long the solution was designed adequately. 

Within the logical model, extract, transform and load can be considered as process by themselves. Within the object model provided by the ETL tool, they are considered in the mentioned sequence within a data flow, which within a set of workflow constraints defines how the data move through the pipeline – the sequence of processing steps considered. The basic unit of work is the data flow and the workflow it belongs to, unit that can be encapsulated in one container for easier management or simply convenience. Several containers can be linked within a workflow to create more complex behavior. 

The data flows and workflow constraints, together with the supporting connections and containers form an ETL package, the main unit of work for encapsulating and running ETL logic. ETL packages are scheduled and run as fit for the purpose.

With the right design, these building blocks allow enough flexibility in handling ad-hoc requests or of building complex solutions. This involves decisions on how to partition the ETL packages, respectively the data flows, in which order they should be run, where and in which sequence the data should be transformed, how to handle exceptions, how to build eventually intermediary data repositories, how to handles audit requirements, and so on. Each of these choices can prove to be important. 

The knowledge of the ETL architecture and functionality is quintessential in providing the right solution for the problem considered, however once the basics were understood the challenges typically reside in understanding the source and/or target structures, the logical and physical entities available, identify the way the data can be partitioned horizontally or vertically, respectively what type of transformations are required for moving the data, as required by the solution. 

Previous Post <<||>> Next Post

07 November 2020

⛁DBMS: Event Streaming Databases (More of a Kafka’s Story)

Database Management

Event streaming architectures are architectures in which data are generated by different sources, and then processed, stored, analyzed, and acted upon in real-time by the different applications tapped into the data streams. An event streaming database is then a database that assures that its data are continuously up-to-date, providing specific functionality like management of connectors, materialized views and running queries on data-in-motion (rather than on static data). 

Reading about this type of technologies one can easily start fantasizing about the Web as a database in which intelligent agents can process streams of data in real-time, in which knowledge is derived and propagated over the networks in an infinitely and ever-growing flow in which the limits are hardly perceptible, in which the agents act as a mind disconnected in the end from the human intent. One is stroke by the fusing elements of realism and the fantastic aspects, more like in a Kafka’s story in which the metamorphosis of the technologies and social aspects can easily lead to absurd implications.

The link to Kafka was somehow suggested by Apache Kafka, an open-source distributed event streaming platform, which seems to lead the trends within this new-developing market. Kafka provides database functionality and guarantees the ACID (atomicity, concurrency, isolation, durability) properties of transactions while tapping into data streams. 

Data streaming is an appealing concept though it has some important challenges like data overload or over-flooding, the complexity derived from building specific (business) and integrity rules for processing the data, respectively for keeping data consistency and truth within the ever-growing and ever-changing flows. 

Data overload or over-flooding occurs when applications are not able to keep the pace with the volume of data or events fired with each change. Imagine the raindrops falling on a wide surface in which each millimeter or micrometer has its own rules for handling the raindrops and this at large scale. The raindrops must infiltrate into the surface to be processed and find their way to the beneath water flows, aggregating up to streams that could nurture seas or even oceans. Same metaphor can be applied to the data events, in which the data pervade applications accumulating in streams processed by engines to derive value. However heavy rains can easily lead to floods in which water aggregates at the surface. 

Business applications rely on predefined paths in which the flow of data is tidily linked to specific actions found themselves in processual sequences that reflect the material or cash flow. Any variation in the data flow from expectations will lead to inefficiencies and ultimately to chaos. Some benefit might be derived from data integrations between the business applications, however applications must be designed for this purpose and handle extreme behaviors like over-flooding. 

Data streams are maybe ideal for social media networks in which one broadcasts data through the networks and any consumer that can tap to the network can further use the respective data. We can see however the problems of nowadays social media – data, better said information, flow through the networks being changed as fit for purposes that can easily diverge from the initial intent. Moreover, information gets denatured, misused, overused to the degree that it overloads the networks, being more and more difficult to distinguish between reliable and non-reliable information. If common sense helps in the process of handling such information, not the same can be said about machines or applications. 

It will be challenging to deal with the vastness, vagueness, uncertainty, inconsistency, and deceit of the networks of the future, however data streaming more likely will have a future as long it can address such issues by design. 


06 November 2020

🧭Business Intelligence: Perspectives (Part VI: Data Soup - Reports vs. Data Visualizations)

Business Intelligence Series

Considering visualizations, John Tukey remarked that ‘the greatest value of a picture is when it forces us to notice what we never expected to see’, which is not always the case for many of the graphics and visualizations available in organizations, typically in the form of simple charts and dashboards, quite often with no esthetics or meaning behind.

In general, reports are needed as source for operational activities, in which the details in form of raw or aggregate data are important. As one moves further to the tactical or strategic aspects of a business, visualizations gain in importance especially when they allow encoding data and information, respectively variations, trends or relations in smaller places with minimal loss of information.

There are also different aspects of visualizations that need to be considered. Modern tools allow rapid visualization and interactive navigation of data across different variables which is great as long one knows what is searching for, which is not always the case.

There are junk charts in which the data drowns in graphical elements that bring no value to the reader, in extremis even distorting the message/meaning.

There are graphics/visualizations that attempt bringing together and encoding multiple variables in respect to a theme, and for which a ‘project’ is typically needed as data is not ad-hoc available, don’t have the desired quality or need further transformations to be ready for consumption. Good quality graphics/visualizations require time and a good understanding of the business, which are not necessarily available into the BI/Analytics teams, and unfortunately few organizations do something in that direction, ignoring typically such needs. In this type of environments is stressed the rapid availability of data for decision-making or action-relevant insight, which depends typically on the consumer.

The story-telling capabilities of graphics/visualizations are often exaggerated. Yes, they can tell a story though stories need to be framed into a context/problem, some background and further references need to be provided, while without detailed data the graphics/visualizations are just nice representations in which each consumer understands what he can.

In an ideal world the consumer and the ‘designer’ would work together to identify the important data for the theme considered, to find the appropriate level of detail, respectively the best form of encoding. Such attempts can stop at table-based representations (aka reports), respectively basic or richer forms of graphical representations. One can consider reports as an early stage of the visualization process, with the potential to derive move value when the data allow meaningful graphical representations. Unfortunately, the time, data and knowledge available seldom make this achievable.

In addition, a well-designed report can be used as basis for multiple purposes, while a graphic/visualization can enforce more limitations. Ideal would be when multiple forms of representation (including reports) are combined to harness the value of data. Navigations from visualizations to detailed data can be useful to understand what happens; learning and understanding the various aspects being an iterative process.

It’s also difficult to demonstrate the value of insight derived from visualizations, especially when graphical literacy goes behind the numeracy and statistical literacy - many consumers lacking the skills needed to evaluate numbers and statistics adequately. If for a good artistic movie you need an assistance to enjoy the show and understand the message(s) behind it, the same can be said also about good graphics/visualizations. Moreover, this requires creativity, abstraction-based thinking, and other capabilities to harness the value of representations.

Given the considerable volume of requirements related to the need of basis data, reports will continue to be on high demand in organizations. In exchange visualizations can complement them by providing insights otherwise not available.

Initially published on Medium as answer to a post on Reporting and Visualizations. 

Related Posts Plugin for WordPress, Blogger...

About Me

My photo
Koeln, NRW, Germany
IT Professional with more than 24 years experience in IT in the area of full life-cycle of Web/Desktop/Database Applications Development, Software Engineering, Consultancy, Data Management, Data Quality, Data Migrations, Reporting, ERP implementations & support, Team/Project/IT Management, etc.