Showing posts with label Graphical Representation. Show all posts

30 July 2025

📊Graphical Representation: Sense-making in Data Visualizations (Part 3: Heuristics)

Graphical Representation Series
 

Consider the following general heuristics in data visualizations (work in progress):

  • plan design
    • plan page composition
      • text
        • title, subtitles
        • dates 
          • refresh, filters applied
        • parameters applied
        • guidelines/tooltips
        • annotation 
      • navigation
        • main page(s)
        • additional views
        • drill-through
        • zoom in/out
        • next/previous page
        • landing page
      • slicers/selections
        • date-related
          • date range
          • date granularity
        • functional
          • metric
          • comparisons
        • categorical
          • structural relations
      • icons/images
        • company logo
        • button icons
        • background
    • pick a theme
      • choose a layout and color schema
        • use a color palette generator
        • use a focused color schema or restricted palette
        • use consistent and limited color scheme
        • use suggestive icons
          • use one source (with similar design)
        • use formatting standards
    • create a visual hierarchy 
      • use placement, size and color for emphasis
      • organize content around eye movement pattern
      • minimize formatting changes
      • 1 font, 2 weights, 4 sizes
    • plan the design
      • build/use predictable and consistent templates
        • e.g. using Figma
      • use layered design
      • aim for design unity
      • define & use formatting standards
      • check changes
    • GRACEFUL
      • group visuals with white space 
      • right chart type
      • avoid clutter
      • consistent & limited color schema
      • enhanced readability 
      • formatting standard
      • unity of design
      • layered design
  • keep it simple 
    • be predictable and consistent 
    • focus on the message
      • identify the core insights and design around them
      • pick suggestive titles/subtitles
        • use dynamics subtitles
      • align content with the message
    • avoid unnecessary complexity
      • minimize visual clutter
      • remove the unnecessary elements
      • round numbers
    • limit colors and fonts
      • use a restrained color palette (<5 colors)
      • stick to 1-2 fonts 
      • ensure text is legible without zooming
    • aggregate values
      • group similar data points to reduce noise
      • use statistical methods
        • averages, medians, min/max
      • categories when detailed granularity isn’t necessary
    • highlight what matters 
      • e.g. actionable items
      • guide attention to key areas
        • via annotations, arrows, contrasting colors 
        • use conditional formatting
      • do not show only the metrics
        • give context 
      • show trends
        • via sparklines and similar visuals
    • use familiar visuals
      • avoid questionable visuals 
        • e.g. pie charts, gauges
    • avoid distortions
      • preserve proportions
        • scale accurately to reflect data values
        • avoid exaggerated visuals
          • don’t zoom in on axes to dramatize small differences
      • use consistent axes
        • compare data using the same scale and units across charts
        • don't use dual axes or shifting baselines that can mislead viewers
      • avoid manipulative scaling
        • use zero-baseline on bar charts 
        • use logarithmic scales sparingly
    • design for usability
      • intuitive interaction
      • at-a-glance perception
      • use contrast for clarity
      • use familiar patterns
        • use consistent formats the audience already knows
    • design with the audience in mind
      • analytical vs managerial perspectives (e.g. dashboards)
    • use different level of data aggregations
      •  in-depth data exploration 
    • encourage scrutiny
      • give users enough context to assess accuracy
        • provide raw values or links to the source
      • explain anomalies, outliers or notable trends
        • via annotations
    • group related items together
      • helps identify and focus on patterns and other relationships
    • diversify 
      • don't use only one chart type
      • pick the chart that reflects the best the data in the conrext considered
    • show variance 
      • absolute vs relative variance
      • compare data series
      • show contribution to variance
    • use familiar encodings
      • leverage (known) design patterns
    • use intuitive navigation
      • synchronize slicers
    • use tooltips
      • be concise
      • use hover effects
    • use information buttons
      • enhances user interaction and understanding 
        • by providing additional context, asking questions
    • use the full available surface
      • 1080x1920 works usually better 
    • keep standards in mind 
      • e.g. IBCS
  • state the assumptions
    • be explicit
      • clearly state each assumption 
        • instead of leaving it implied
    • contextualize assumptions
      • explain the assumption
        • use evidence, standard practices, or constraints
    • state scope and limitations
      • mention what the assumption includes and excludes
    • tie assumptions to goals & objectives
      • helps to clarify what underlying beliefs are shaping the analysis
      • helps identify whether the visualization achieves its intended purpose 
  • show the data
    • be honest (aka preserve integrity)
      • avoid distortion, bias, or trickery
    • support interpretation
      • provide labels, axes, legends
    • emphasize what's meaningful
      • patterns, trends, outliers, correlations, local/global maxima/minima
  • show what's important 
    • e.g. facts, relationships, flow, similarities, differences, outliers, unknown
    • prioritize and structure the content
      • e.g. show first an overview, what's important
    • make the invisible visible
      • think about what we do not see
    • know your (extended) users/audience
      • who'll use the content, at what level, for that
  • test for readability
    • get (early) feedback
      • have the content reviewed first
        • via peer review, dry run presentation
  • tell the story
    • know the audience and its needs
    • build momentum, expectation
    • don't leave the audience to figure it out
    • show the facts
    • build a narrative
      • show data that support it
      • arrange the visuals in a logical sequence
    • engage the reader
      • ask questions that bridge the gaps
        • e.g. in knowledge, in presentation's flow
      • show the unexpected
      • confirm logical deductions
Previous Post <<||>> Next Post

27 July 2025

📊Graphical Representation: Sense-making in Data Visualizations (Part 2: Guidelines)

Graphical Representation Series
 

Consider the following best practices in data visualizations (work in progress):

  • avoid poor labeling and annotation practices
    • label data points
      • considering labeling at least the important number of points
        • e.g. starts, ends, local/global minima/minima
        • when labels clutter the chart or there's minimal variation
    • avoid abbreviations
      • unless they are defined clearly upfront, consistent and/or universally understood
      • can hinder understanding
        • abbreviations should help compress content without losing meaning
    • use font types, font sizes, and text orientation that are easy to read
    • avoid stylish design that makes content hard to read
    • avoid redundant information
    • text should never overshadow or distort the actual message or data
      • use neutral, precise wording
  • avoid the use of pre-attentive attributes 
    • aka visual features that our brains process almost instantly
    • color
      • has identity value: used to distinguish one thing from another
        • carries its own connotations
        • gives a visual scale of measure
        • the use of color doesn’t always help
      • hue 
        • refers to the dominant color family of a specific color, being processed by the brain based on the different wavelengths of light
          • allows to differentiate categories
        • use distinct hues to represent different categories
      • intensity (aka brightness)
        • refers to how strong or weak a color appears
      • saturation (aka chroma, intensity) 
        • refers to the purity or vividness of a color
          • as saturation decreases, the color becomes more muted or washed out
          • highly saturated colors have little or no gray in it
          • highly desaturated colors are almost gray, with none of the original colors
        • use high saturation for important elements like outliers, trends, or alerts
        • use low saturation for background elements
      • avoid pure colors that are bright and saturated
        • drive attention to the respective elements 
      • avoid colors that are too similar in tone or saturation
      • avoid colors hard to distinguish for color-blind users
        • e.g. red-green color blindness
          • brown-green, orange-red, blue-purple combinations
          • avoid red-green pairings for status indicators 
            • e.g. success/error
        • e.g. blue-yellow color blindness
          • blue-green, yellow-ping, purple-blue
        • e.g. total color blindness (aka monochromacy)
          • all colors appear as shades of gray
            • ⇒ users must rely entirely on contrast, shape, and texture
      • use icons, labels, or patterns alongside color
      • use tools to test for color issues
      • use colorblind-safe palettes 
      • for sequential or diverging data, use one hue and vary saturation or brightness to show magnitude
      • start with all-gray data elements
        • use color only when it corresponds to differences in data
          • ⇐ helps draw attention to whatever isn’t gray
      • dull and neutral colors give a sense of uniformity
      • can modify/contradict readers' intuitive response
      • choose colors to draw attention, to label, to show relationships 
    • form
      • shape
        • allows to distinguish types of data points and encode information
          • well-shaped data has functional and aesthetic character
        • complex shapes can become more difficult to be perceived
      • size
        • attribute used to encode the magnitude or extent of elements 
        • should be aligned to its probable use, importance, and amount of detail involved
          • larger elements draw more attention
        • its encoding should be meaningful
          • e.g. magnitudes of deviations from the baseline
        • overemphasis can lead to distortions
        • choose a size range that is appropriate for the data
        • avoid using size to represent nominal or categorical data where there's no inherent order to the sizes
      • orientation
        • angled or rotated items stand out.
      • length/width
        • useful in bar charts to show quantity
        • avoid stacked bar graphs
      • curvature
        • curved lines can contrast with straight ones.
      • collinearity
        • alignment can suggest grouping or flow
    • highlighting
    • spatial positioning
      • 2D position
        • placement on axes or grids conveys value 
      • 3D position in 2D space

      • grouping
        • proximity implies relationships.
        • keep columns, respectively bars close together
      • enclosure
        • borders or shaded areas signal clusters.
      • depth (stereoscopic or shading)
        • adds dimensionality
  • avoid graphical features that are purely decorative
    • aka elements that don't affect understanding, structure or usability
    • stylistic embellishments
      • borders/frames
        • ornamental lines or patterns around content
      • background images
        • images used for ambiance, not content
      • drop shadows and gradients
        • enhance depth or style but don’t add meaning.
      • icons without function
        • decorative icons that don’t represent actions or concepts
    • non-informative imagery
      • stock photos
        • generic visuals that aren’t referenced in the text.
      • illustrations
        • added for visual interest, not explanation.
      • mascots or logos
        • when repeated or not tied to specific content.
    • layout elements
      • spacers
        • transparent or blank images used to control layout
        • leave the right amount of 'white' space between chart elements
      • custom bullets or list markers
        • designed for flair, not clarity
      • visual separators
        • lines or shapes that divide sections without conveying hierarchy or meaning
  • avoid bias
    • sampling bias
      • showing data that doesn’t represent the full population
        • avoid cherry-picking data
          • aka selecting only the data that support a particular viewpoint while ignoring others that might contradict it
          • enable users to look at both sets of data and contrast them
          • enable users to navigate the data
        • avoid survivor bias
          • aka focusing only on the data that 'survived' a process and ignoring the data that didn’t
      • use representative data
        • aka the dataset includes all relevant groups
      • check for collection bias
        • avoid data that only comes from one source 
        • avoid data that excludes key demographics
    • cognitive bias
      • mental shortcut that sometimes affect interpretation
        • incl. confirmation bias, framing bias, pattern bias
      • balance visual hierarchies
        • don’t make one group look more important by overemphasizing it
      • show uncertainty
        • by including confidence intervals or error bars to reflect variability
      • separate comparisons
        • when comparing groups, use adjacent charts rather than combining them into one that implies a hierarchy
          • e.g. ethnicities, region
    • visual bias
      • design choices that unintentionally (or intentionally) distort meaning
        • respectively how viewers interpret the data
      • avoid manipulating axes 
        • by truncating y-axis
          • exaggerates differences
        • by changing scale types
          • linear vs. logarithmic
            • a log scale compresses large values and expands small ones, which can flatten exponential growth or make small changes seem more significant
          • uneven intervals
            • using inconsistent spacing between tick marks can distort trends
        • by zooming in/out
          • adjusting the axis to focus on a specific range can highlight or hide variability and eventually obscure the bigger picture
        • by using dual axes
          • if the scales differ too much, it can falsely imply correlation or exaggerate relationships 
        • by distorting the aspect ration
          • stretching or compressing the chart area can visually amplify or flatten trends
            • e.g. a steep slope might look flat if the x-axis is stretched
        • avoid inconsistent scales
        • label axes clearly
        • explain scale choices
      • avoid overemphasis 
        • avoid unnecessary repetition 
          • e.g. of the same graph, of content
        • avoid focusing on outliers, (short-term) trends
        • avoid truncating axes, exaggerating scales
        • avoid manipulating the visual hierarchy 
      • avoid color bias
        • bright colors draw attention unfairly
      • avoid overplotting 
        • too much data obscures patterns
      • avoid clutter
        • creates cognitive friction
          • users struggle to focus on what matters because their attention is pulled in too many directions
          • is about design excess
        • avoid unnecessary or distracting elements 
          • they don’t contribute to understanding the data
      • avoid overloading 
        • attempting to show too much data at once
          • is about data excess
        • overwhelms readers' processing capacity, making it hard to extract insights or spot patterns
    • algorithmic bias 
      • the use of ML or other data processing techniques can reinforce certain aspects (e.g. social inequalities, stereotypes)
      • visualize uncertainty
        • include error bars, confidence intervals, and notes on limitations
      • audit data and algorithms
        • look for bias in inputs, model assumptions and outputs
    • intergroup bias
      • charts tend to reflect or reinforce societal biases
        • e.g. racial or gender disparities
      • use thoughtful ordering, inclusive labeling
      • avoid deficit-based comparisons
  • avoid overcomplicating the visualizations 
    • e.g. by including too much data, details, other elements
  • avoid comparisons across varying dimensions 
    • e.g. (two) circles of different radius, bar charts of different height, column charts of different length, 
    • don't make users compare angles, areas, volumes

21 July 2025

📊Graphical Representation: Sense-making in Data Visualizations (Part 1: An Introduction)

Graphical Representation Series

Introduction

Creating simple charts or more complex data visualizations may appear trivial for many, though their authors shouldn't forget that readers have different backgrounds, degrees of literacy, many of them not being maybe able to make sense of graphical displays, at least not without some help.

Beginners start with a limited experience and build upon it, then, on the road to mastery, they get acquainted with the many possibilities, a deeper sense is achieved and the choices become a few. Independently of one's experience, there are seldom 'yes' and 'no' answers for the various choices, but everything is a matter of degree that varies with one's experience, available time, audience's expectations, and many more aspects might be considered in time.  

The following questions are intended to expand, respectively narrow down our choices when dealing with data visualizations from a data professional's perspective. The questions are based mainly on [1] though they were extended to include a broader perspective. 

General Questions

Where does the data come from? Is the source reliable, representative (for the whole population in scope)? Is the data source certified? Are yhe data actual? 

Are there better (usable) sources? What's the effort to consider them? Does the data overlap? To what degree? Are there any benefits in merging the data? How much this changes the overall picture? Are the changes (in trends) explainable? 

Was the data collected? How, from where, and using what method? [1] What methodology/approach was used?

What's the dataset about? Can one recognize the data, the (data) entities, respectively the structures behind? How big is the fact table (in terms of rows and columns)? How many dimensions are in scope?

What transformations, calculations or modifications have been applied? What was left out and what's the overall impact?

Any significant assumptions were made? [1] Were the assumptions clearly stated? Are they entitled? Is it more to them? 

Were any transformation applied? Do the transformations change any data characteristics? Were they adequately documented/explained? Do they make sense? Was it something important left out? What's the overall impact?

What criteria were used to include/exclude data from the display? [1] Are the criteria adequately explained/documented? Do they make sense?

Are similar data publicly available? Is it (freely) accessible/usable? To what degree? How much do the datasets overlap? Is there any benefit to analyze/use the respective data? Are the characteristics comparable? To what degree?

Dataviz Questions

What's the title/subtitle of the chart? Is it meaningful for the readers? Does the title reflect the data, respectively the findings adequately? Can it be better formulated? Is it an eye-catcher? Does it meet the expectations? 

What data is shown? Of what type? At what level is the data aggregated? 

What chart (type) is being used? [1] Are the readers familiar with the chart type? Does it needs further introduction/clarifications? Are there better means to represent the data? Does the chart offer the appropriate perspective? Does it make sense to offer different (complementary) perspective(s)? To what degree other perspectives help?

What items of data do the marks represent? What value associations do the attributes represent? [1] Are the marks visible? Are the marks adequately presented (e.g. due to missing data)? 

What range of values are displayed? [1] What approximation the values support? To what degree can the values be rounded without losing meaning?

Is the data categorical, ordinal or continuous? 

Are the axes property chosen/displayed/labeled? Is the scale properly chosen (linear, semilogarithmic, logarithmic), respectively displayed? Do they emphasize, diminish, distort, simplify, or clutter the information? 

What features (shapes, patterns, differences or connections) are observable, interesting or vital for understanding the chart? [1] 

Where are the largest, mid-sized and smallest values? (aka ‘stepped magnitude’ judgements). [1] 

Where lie the most/least values? Where is the average or normal? (aka ‘global comparison’ judgements)” [1] How are the values distributed? Are there any outliers present? Are they explainable? 

What features are expected or unexpected? [1] To what degree are they unexpected?  

What features are important given the subject? [1] 

What shapes and patterns strike readers as being semantically aligned with the subject? [1] 

What is the overall feeling when looking at the final result? Is the chart overcrowded? Can anything be left out/included? 

What colors were used? [1] Are the colors adequately chosen, respectively meaningful? Do they follow the general recommendations?  

What colors, patterns, forms do readers see first? What impressions come next, respectively last longer?  

Are the various elements adequately/intuitively positioned/distinguishable? What's the degree of overlapping/proximity? Do the elements respect an intuitive hierarchy? Do they match readers' expectations, respectively the best practices in scope? Are the deviations entitled? 

Is the space properly used? To what degree? Are there major gaps? 

Know Your Audience

What audience targets the visualization? Which are its characteristics (level of experience with data visualizations; authors, experts or casual attendees)? Are there any accidental attendees? How likely is the audience to pay attention? 

What is audience’s relationship with the subject matter? What knowledge do they have or, conversely, lack about the subject? What assistance might they need to interpret the meaning of the subject? Do they have the capacity to comprehend what it means to them? [1]

Why do the audience wants/needs to understand the topic? Are they familiar, respectively actively interested or more passive? Is it able to grasp the intended meaning? [1] To what degree? What kind of challenges might be involved, of what nature?

What is their motivation? Do they have a direct, expressed need or are they more passive and indifferent? Is it needed a way to persuade them or even seduce them to engage? [1] Can this be done without distorting the data and its meaning(s)?

What are their visualization literacy skill set? Do they require assistance perceiving the chart(s)? Are they sufficiently comfortable with operating features of interactivity? Do they have any visual accessibility issues (e.g. red–green color blindness)? Do they need to be (re)factored into the design? [1]

Reflections

What has been learnt? Has it reinforced or challenged existing knowledge? [1] Was new knowledge gained? How valuable is this knowledge? Can it be reused? In which contexts? 

Do the findings meet one's expectations? To what degree? Were the expectations entitled? On what basis? What's missing? What's gaps' relevance? 

What feelings have been stirred? Has the experience had an impact emotionally? [1] To what degree? Is the impact positive/negative? Is the reaction entitled/explainable? Are there any factors that distorted the reactions? Are they explainable? Do they make sense? 

What does one do with this understanding? Is it just knowledge acquired or something to inspire action (e.g. making a decision or motivating a change in behavior)? [1] How relevant/valuable is the information for us? Can it be used/misused? To what degree? 

Are the data and its representation trustworthy? [1] To what degree?

Previous Post <<||>> Next Post

References:
[1] Andy Kirk, "Data Visualisation: A Handbook for Data Driven Design" 2nd Ed., 2019

03 May 2025

📊Graphical Representation: Graphics We Live By (Part XI: Comparisons Between Data Series)

Graphical Representation Series

Over the past 10-20 years it became so easy to create data visualizations just by dropping some of the data available into a tool like Excel and providing a visual depiction of it with just a few clicks. In many cases, the first draft, typically provided by default in the tool used, doesn't even need further work as the objective was reached, while in others the creator must have a minimum skillset for making the visualization useful, appealing, or whatever quality is a final requirement for the work in scope. However, the audience might judge the visualization(s) from different perspectives, and there can be a broad audience with different skills in reading, evaluating and understanding the work.

There are many depictions on the web resembling the one below, taken from a LinkedIn post:

Example Chart - Boing vs. Airbus

Even if the visualization is not perfect, it does a fair job in representing the data. Improvements can be made in the areas of labels, the title and positioning of elements, and the color palette used. At least these were the improvements made in the original post. It must be differentiated also between the environment in which the charts are made available, the print format having different characteristics than the ones in business setups. Unfortunately, the requirements of the two are widely confused, probably also because of the overlapping of the mediums used. 

Probably, it's a good idea to always start with the row data (or summaries of it) when the result consists of only a few data points that can be easily displayed in a table like the one below (the feature to round the decimals for integer values should be available soon in Power BI):

Summary Table

Of course, one can calculate more meaningful values like percentages from the total, standard deviations and other values that offer more perspectives into the data. Even if the values adequately reflect the reality, the reader can but wonder about the local and global minimal/maximal values, without talking much about the meaning of data points, which is easily identifiable in a chart. At least in the case of small data sets, using a table in combination with a chart can provide a more complete perspective and different ways of analyzing the data, especially when the navigation is interactive. 

Column and bar charts do a fair job in comparing values over time, though they do use a lot of ink in the process (see D). While they make it easy to compare neighboring values, the rectangles used tend to occupy a lot of space when they are made too wide or too high to cover the empty space within the display (e.g. when just a few values are displayed, space being wasted in the process). As the main downside, it takes a lot of scanning until the reader identifies the overall trends, and the further away the bars are from each other, the more difficult it becomes to do comparisons. 

In theory, line charts are more efficient in representing the above data points, because the marks are usually small and the line thin enough to provide a better data-ink ratio, while one can see a lot at a glance. In Power BI the creator can use different types of interpolation: linear (A), step (B) or smooth (C). In many cases, it might be a good idea to use a linear interpolation, though when there are no or minimal overlapping, it might be worthwhile to explore the other types if interpolation too (and further request feedback from the users):

Linear, Step and Smooth Line Charts

The nearness of values from different series can raise difficulties in identifying adequately the points, respectively delimiting the lines (see B).When the density of values allows it, it makes sense also to include the averages for each data series to reflect the distance between the two data sets. Unfortunately, the chart can get crowded if further data series or summaries are added to the cart(s). 

If the column chart (E) is close to the redesigned chart provided in the original redesign, the other alternatives can provide upon case more value. Stacked column charts (D) allow also to compare the overall quantity by month, area charts (F) tend to use even more color than needed, while water charts (G) allow to compare the difference between data points per time unit. Tornado charts (H) are a variation of bar charts, allowing easier comparing of the size of the bars, while ribbon charts (I) show well the stacking values. 

Alternatives to Line Charts

One should consider changing the subtitle(s) slightly to reflect the chart type when the patterns shown imply a shift in attention or meaning. Upon case, more that one of the above charts can be used within the same report when two or more perspectives are important. Using a complementary perspective can facilitate data's understanding or of identifying certain patterns that aren't easily identifiable otherwise. 

In general, the graphics creators try to use various representational means of facilitating a data set's understanding, though seldom only two series or a small subset of dimensions provide a complete description. The value of data comes when multiple perspectives are combined. Frankly, the same can be said about the above data series. Yes, there are important differences between the two series, though how do the numbers compare when one looks at the bigger picture, especially when broken down on element types (e.g. airplane size). How about plan vs. actual values, how long does it take more for production or other processes? It's one of a visualization's goals to improve the questions posed, but how efficient are visualizations that barely scratch the surface?

In what concerns the code, the following scripts can be used to prepare the data:

-- Power Query script (Boeing vs Airbus)
= let
    Source = let
    Source = #table({"Sorting", "Month Name", "Serial Date", "Boeing Deliveries", "Airbus Deliveries"},
    {
        {1, "Oct", #date(2023, 10, 31), 30, 50},
        {2, "Nov", #date(2023, 11, 30), 40, 40},
        {3, "Dec", #date(2023, 12, 31), 40, 110},
        {4, "Jan", #date(2024, 1, 31), 20, 30},
        {5, "Feb", #date(2024, 2, 29), 30, 40},  // Leap year adjustment
        {6, "Mar", #date(2024, 3, 31), 30, 60},
        {7, "Apr", #date(2024, 4, 30), 40, 60},
        {8, "May", #date(2024, 5, 31), 40, 50},
        {9, "Jun", #date(2024, 6, 30), 50, 80},
        {10, "Jul", #date(2024, 7, 31), 40, 90},
        {11, "Aug", #date(2024, 8, 31), 40, 50},
        {12, "Sep", #date(2024, 9, 30), 30, 50}
    }
    ),
    #"Changed Types" = Table.TransformColumnTypes(Source, {{"Sorting", Int64.Type}, {"Serial Date", type date}, {"Boeing Deliveries", Int64.Type}, {"Airbus Deliveries", Int64.Type}})
in
    #"Changed Types"
in
    Source

It can be useful to create the labels for the charts dynamically:

-- DAX code for labels
MaxDate = Format(Max('Boeing vs Airbus'[Serial Date]),"MMM-YYYY")
MinDate = FORMAT (Min('Boeing vs Airbus'[Serial Date]),"MMM-YYYY")
MinMaxDate = [MinDate] & " to " & [MaxDate]
Title Boing Airbus = "Boing and Airbus Deliveries " & [MinMaxDate]

Happy coding!

Previous Post <<||>> Next Post

04 August 2024

📊Graphical Representation: Graphics We Live By (Part X: Pie and Donut Charts in Power BI and Excel)

Graphical Representation Series

Pie charts are loved and hated by many altogether, and there are many entitled reasons to use them and avoid them, though the most important criteria to evaluate them is whether they do the intended job in an acceptable manner, especially when compared to other representational means. The most important aspect they depict is the part to whole ratio, which even if can be depicted by other graphical tools, few tools are efficient in representing it. 

The pie chart works well as a visualization tool when it has only 3-5 values that are easily recognizable in the visualization, however as soon the size or the number of pieces vary considerably, the more difficult it is to visualize and interpret them, in case their representation has more negative than positive effects. There are many topics that form something like a long tail - the portion of the distribution having many occurrences far from the head or beginning. Displaying the items from the long tail together with the other components together can totally obscure the distribution of the items from the long tail as they become unrecognizable in the diagram. 

One approach to handle this is to group all the items from the long tail together under a piece (e.g. Other) and use a second form of representation to display them separately. For example,  Microsoft Excel offers a way to zoom in the section of a pie chart with small percentages by displaying them in a second pie chart (pie of pie) or bar chart (bar of pie), something like a "zoom in" perspective (see image below). Unfortunately, the feature seems to limit itself only to small percentages, and thus can't be used currently to offer a broader perspective. Ideally, it would be useful to zoom in on any piece of the pie, especially when the items are categorized as a hierarchy with two or even more levels. 


Unfortunately, even modern visualization tools offer limited features in displaying this kind of perspective into a flexible unitary visualization, and thus users are forced to use their creativity in providing proper solutions. In the below example the "Renewables" piece of pie is further broken down into several components of a full pie, an ensemble supposed to function as a single form of representation. With a bit of effort, the reader probably will understand the meaning behind the two pie charts, however the encoding of colors and other elements used are suboptimal in the decoding process. 

Pie Charts - Original Solution

In the above example, the arrow may suggest that in between the two donut charts exists a relationship, reflected also in the description provided, however the readers may still have difficulties in correctly interpreting the diagrams, especially when there's some kind of overlapping or other type of implied or unimplied resemblance. If the colors overlap or have other similarities, are they intentional? If the circles have the same size, does this observed resemblance have a meaning? The reader shouldn't bother himself with this type of questions, but see the resemblance and the meaning of the various elements with a minimum of effort while decoding a chart's elements. Of course, when the meaning is not clear, some guidance should be ideally provided!

Unfortunately, Power BI doesn't seem to have a similar visual like the one from Excel yet, however with a bit of effort one can obtain similar results, even if there are other minor or important limitations. For example, the lines between the two pie charts can't be drawn, so one is forced to use other encodings to show that there's a connection between the Renewable slice and the small pie chart. Moreover, the ensemble thus created isn't treated unitary and handled accordingly. Frankly, the maturity of a graphical representation environment can and should be judged also from this perspective!

The below representation built in Power BI uses a few tricks to display two pie charts together. The smaller pie chart representing the breakdown and pieces' colors are variations of parent's color, attempting to show that there's a relationship between the slice from the first chart and the pie chart with the details. Unfortunately, it wasn't possible to use similar lines like in Excel to show the relation between the two sections. 

Pie of Pie in Power BI

Instead of a pie chart, one can use a donut, like in the original representation. Even if the donut uses a smaller area for representation, in theory the pie chart offers a better basis for comparisons, at least in theory. Stacked column charts can be used as well (see C), however one loses the certainty that the pieces must add up to 100%. Further limitations can appear when one wants to achieve more with the visualizations.

Custom charts can be used as well. The pie chart coming from xViz (see D) allows to increase the size of a pie piece by using another radius, technique which could be used to highlight the piece represented in the second chart. Frankly, sunburst diagrams (see E) are better at representing the parent to child proportions, where the same color encoding has been used. Unfortunately, the more information is shown, the more loaded the visualization seems to be.

Pie of Pie Alternatives in Power BI I

A treemap can prove to be a better representation alternative because it encodes proportions in a unitary way, much like pie charts do, though it takes more space if one wants to make the labels visible. Radial charts (see G) and Aster plots (see I) can be occasionally better choices, especially because they use less space as they display only the main categories. A second diagram chart can be used to display the subcategories, much like in A and B. Sankey charts (see H) can be used as well, even if they don't allow representing any quantitative values unless one encodes them directly in the labels. 

Pie of Pie Alternatives in Power BI II

When one dives into the world of diagrams and goes behind the still limited representational choices provided by the standard tools, one can be surprised by the additional representational choices. However, their appropriateness should be considered against readers' skillset to read and interpret them! Frankly, the alternatives considered above could be a better choice when they will reach a representational maturity. 

Many thanks to Christopher Chin, who in his weekly post on data visualization blunders, suggested the examples used as basis for this post (see [1])!

Previous Post <<||>> Next Post

References:
[1] LinkedIn (2024) Christopher Chin's post (link)

15 June 2024

🗒️Graphical Representation: Bar & Column Charts [Notes]

Disclaimer: This is work in progress intended to consolidate information from various sources and may deviate from them. Please consult the sources for the exact content!
Last updated: 15-Jun-2024

Bar & Column Charts with Variations
Bar & Column Charts (Graphs) 

  • {definition} graphical representation of categorical data with rectangular figures (aka boxes) whose heights (column chart) or lengths (bar chart) are proportional to the values that they represent
  • {benefit} allow to visually encode/decode quantitative information-size as magnitude and area based on the relative position of the end of the box along the common scale
    • if the width of the box is the same, it's enough to compare the length
      • ⇒ the basis of comparison is one-dimensional [1]
      • ⇐ orient the reader to the relative magnitudes of the boxes
    • area is typically encoded when the width varies
      • ⇐ encoding by area is a poor encoding method as it can mislead
    • can represent negative and positive values 
    • one of the most useful, simple, and adaptable techniques in graphic presentation [1]
      • easily understood by readers
      • sometimes avoided because they are so common
      • almost everything could be a bar chart
    • the length of each bar is proportional to the quantity or amount of each category represented [1]
      • ⇒the zero line must be shown [1]
      • ⇒the scale must not be broken [1]
        • {exception} an excessively long bar in a series of bars may be broken off at the end, and the amount involved shown directly beyond it [1]
  • {benefit} allow to visually represent categorical data
    • ⇒ occasionally represented without scales, grid lines or tick marks
    • the more data elements are presented, the more difficult it becomes to navigate and/or display the data
  • {benefit} allow us to easily compare magnitudes 
    • sometimes without looking at the actual values
  • {type} bar chart
    • the box is shown horizontally
    • represents magnitude by length
    • allows comparing different items as of a specific time
  • {type} column chart
    • the box is shown vertically
    • represents magnitude by height
    • allows comparing different items over time
      • ⇐ it still displays discrete points
    • recommended for comparing similar items for different time periods [2]
    • effective way to show most types of comparisons [2]
  • {subtype} stacked chart
    • variation of bar/column charts in which the boxes of a dimension's components are staked over each other
      • {exception} spaces can be used between boxes if the values aren't cumulative [3]
    • {benefit} allows encoding a further dimension where the values are staked within the same box
    • {drawback} do not show data structure well
      • ⇒ make it challenging to compare values across boxes
  • {subtype} 100-percent chart
    • variation of stacked chart in which the magnitude totals to 100%
    • {benefit} allows to display part to whole relationships
      • ⇐ preferable to circle chart's angle and area comparison [1]
  • {subtype} clustered chart (aka grouped chart)
    • variation of bar/column charts that allows encoding further quantitative information in distinct boxes tacked together which occasionally overlap
      • ⇐ if there's space, it is usually kept to a minimum
      • e.g. can be used to display multiple data series 
    • can be used with a secondary axis
    • {benefit} allows comparisons within the cluster/group as well between clusters/groups
    • {drawback} more challenging to make comparisons across points
  • {subtype} area chart (variable-width/variwide chart/graph
    • variation of bar/column charts in which the height/width have significance being proportional to some measure or characteristics of the data elements represented [3]
    • {benefit} allow encoding a further dimension as part of the area
  • {subtype} deviation chart 
    • variation of bar/column charts that display positive and negative values 
  • {subtype} joined chart
    • variation of bar/column charts in which the boxes are tacked together
    • {benefit} allow to better use the space available 
  • {subtype} paired chart 
    • variation of bar/column charts in which the boxes are paired in mirror based on an axis
      • e.g. the values of one data series are displayed to the left, while the values for a second data series are displayed to the right 
    • {benefit} allows to study the correlation and/or other relationships between the values of two data series
    • the hidden axes can have different scales 
  • {subtype} circular chart (aka radial chart)
    • variation of bar/column charts in which the boxes are wrapped into a circle, the various categories being uniformly spaced along the radial or category axis [3]
    • the value scale can have any upper or lower value and can progress in either direction [3]
    • {benefit} useful to represent data that have a circular dimension in an aesthetic form
      • e.g. months, hours
  • {subtype} waterfall chart (aka progressing chart)
    • variation of bar/column charts in which the boxes are displayed progressively, the start of a box corresponding the end of the previous box 
    • time and activity charts can be considered as variations of this subtype [3]
    • {advantage} allows to determine cumulative values, respectively the increase/decrease between consecutive boxes
  • {subtype}composite chart (aka mixed chartcombination chart, overlay chart)
    • variation of bar/column charts in besides boxes are used other graphic types of encoding (line, area)
      • ⇐ the different data graphics are overlaid on one another [3]
    • {benefit} allows to improve clarity or highlight the relationships between several data series [3]
    • {drawback} overlaying can result in clutter 
  • used to  
    • display totals, averages or frequencies
    • display time series
    • display the relationship between two or more items
    • make a comparison among several items
    • make a comparison between parts and the whole
  • can be confounded with 
    • [histograms]
      • show distribution through the frequency of quantitative values against defined intervals of quantitative values
      • used for continuous numerical data or data that can be effectively modelled as continuous
      • it doesn't have spaces between bars
        • ⇐ older use of bar/column charts don't use spaces
        • if this aspect is ignored, histograms can be considered as a special type of area chart
    • [vertical line chart] (aka price chart, bar chart)
      • vertical line charts are sometimes referred as bar charts (see [3])
  • things to consider
    • distance between bars
      • the more distant the bars, the more difficult it becomes to make comparisons and the accuracy of judgment decreases
    • sorting
      • sorting the bars/columns by their size facilitates comparisons, though it can impede items' search, especially when there are many categories involved
        • {exception} not recommended for time series
    • clutter
      • displaying too many items in a cluster and/or too many labels can lead to clutter
      • {recommendation} display at maximum 3-4 clustered boxes
    • color
      • one should follow the general recommendations 
    • trend lines
      • can be used especially with time series especially to represent the linear regression line
    • dual axis
      • {benefit} allows to compare the magnitudes of two data series by employing a secondary axis
    • overlapping
      • overlapping boxes can make charts easier to read
    • symbols
      • can be used to designate reference points of comparison for each of the bars [3]
  • {alternative} pie chart
    • can be used to dramatize comparisons in relation to the whole [2]
    • one should consider the drawbacks 
  • {alternative} choropleth maps
    • more adequate for geographical dimensions
    • provide minimal encoding 
  • {alternative} line charts
    • can be much more informative
    • provides an optimal dat-ink ratio
    • reduces the chart junk feeling
  • {alternative} dot plots
    • are closer to the original data

References:
[1] Anna C Rogers (1961) "Graphic Charts Handbook"
[2] Robert Lefferts (1981) "Elements of Graphics: How to prepare charts and graphs for effective reports"
[3] Robert L Harris (1996) "Information Graphics: A Comprehensive Illustrated Reference"

14 June 2024

📊Graphical Representation: Graphics We Live By (Part IX: Word Clouds in Power BI)

Graphical Representation Series

A word cloud (aka tag cloud) is a visual representation of textual data in the form of a cloud - a mass of words in which each word is shown with a different font size and/or color based on its frequency, significance or categorization in the dataset considered. It is used to depict keyword metadata on websites, to visualize free form text or the frequency of specific values within a categorical dimension, respectively to navigate the same. 

Words can be categorized as single or compounded, where special characters like hyphen can be used. A tag is a special type of a word, usually a single word. One can use different direction or arrangement for displaying each word, independently of whether the value is numerical or alphanumerical. Word clouds are usually not sorted, even if the values could be sorted using a spiraled arrangement, which offers and easier way to navigate and compare the data.

Most of the representations are based on words' frequency, though occasionally the frequency is considered against a background corpus (e.g. Wikipedia). The use of tags as categorization methods for content items is seldom done, though needs to be considered as well. 

It makes sense to use word clouds only with categorical data (see below) for which the chances of multiple occurrences is high. Numerical values (see A & D) can be displayed as well when their range is narrow. Moreover, when the number of distinct values is high, one can consider only the top N values. Continuous data may be challenging to represent, though occasionally they can be represented as well, especially when reducing the precision

Word clouds allow to see at a glance what values are available and can be used as an alternative to choropleth maps for filtering and navigating the data. They aren't good for precise comparisons, though further information can be provided in the tooltip. 

In Power BI there are currently two visuals that allow to display word clouds - from Microsoft, respectively Powerviz, which was added recently (see Jun-2024 release [2]). They provide similar functionality, though Powerviz's visual offers more flexibility in what concerns the word options (case, styling, delimiters) direction, shapes (displaying the values within a form), ranking (top vs bottom), exclusion rules and formational formatting. It uses also a radial arrangement, which allows to select or exclude a set of values via the lasso functionality (see E). 

Word Clouds

Previous Post <<||>> Next Post

References:
[1] Wikipedia (2024) Tag cloud (link)
[2] Microsoft Power BI Blog (2004) Power BI June 2024 Feature Summary (link)


01 June 2024

📊Graphical Representation: Graphics We Live By (Part VIII: List of Items in Power BI)

Graphical Representation Series

Introduction

There are situations in which one needs to visualize only the rating, other values, or ranking of a list of items (e.g. shopping cart, survey items) on a scale (e.g. 1 to 100, 1 to 10) for a given dimension (e.g. country, department). Besides tables, in Power BI there are 3 main visuals that can be used for this purpose: the clustered bar chart, the line chart (aka line graph), respectively the slopegraph:

Main Display Methods

Main Display Methods

For a small list of items and dimension values probably the best choice would be to use a clustered bar chart (see A). If the chart is big enough, one can display also the values as above. However, the more items in the list, respectively values in the dimension, the more space is needed. One can maybe focus then only on a subset of items from the list (e.g. by grouping several items under a category), respectively choose which dimension values to consider. Another important downside of this method is that one needs to remember the color encodings. 

This downside applies also to the next method - the use of a line chart (see B) with categorical data, however applying labels to each line simplifies its navigation and decoding. With line charts the audience can directly see the order of the items, the local and general trends. Moreover, a line chart can better scale with the number of items and dimension values.

The third option (see C), the slopegraph, looks like a line chart though it focuses only on two dimension values (points) and categorizes the line as "down" (downward slope), "neutral" (no change) and "up" (upward slope). For this purpose, one can use parameters fields with measures. Unfortunately, the slopegraph implementation is pretty basic and the labels overlap which makes the graph more difficult to read. Probably, with the new set of changes planned by Microsoft, the use of conditional formatting of lines would allow to implement slope graphs with line charts, creating thus a mix between (B) and (C).

This is one of the cases in which the Y-axis (see B and C) could be broken and start with the meaningful values. 

Table Based Displays

Especially when combined with color encodings (see C & G) to create heatmap-like displays or sparklines (see E), tables can provide an alternative navigation of the same data. The color encodings allow to identify the areas of focus (low, average, or high values), while the sparklines allow to show inline the trends. Ideally, it should be possible to combine the two displays.  

Table Displays and the Aster Plot

One can vary the use of tables. For example, one can display only the deviations from one of the data series (see F), where the values for the other countries are based on AUS. In (G), with the help of visual calculations one can also display values' ranking. 

Pie Charts

Pie charts and their variations appear nowadays almost everywhere. The Aster plot is a variation of the pie charts in which the values are encoded in the height of the pieces. This method was considered because the data used above were encoded in 4 similar plots. Unfortunately, the settings available in Power BI are quite basic - it's not possible to use gradient colors or link the labels as below:

Source Data as Aster Plots

Sankey Diagram

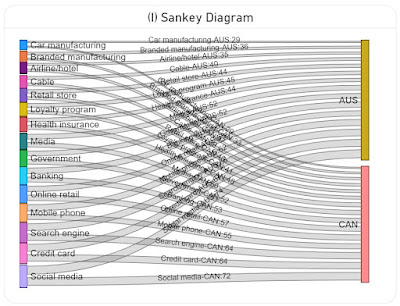
A Sankey diagram is a data visualization method that emphasizes the flow or change from one state (the source) to another (the destination). In theory it could be used to map the items to the dimensions and encode the values in the width of the lines (see I). Unfortunately, the diagram becomes challenging to read because all the lines and most of the labels intersect. Probably this could be solved with more flexible formatting and a rework of the algorithm used for the display of the labels (e.g. align the labels for AUS to the left, while the ones for CAN to the right).

Sankey Diagram

Data Preparation

A variation of the above image with the Aster Plots which contains only the plots was used in ChatGPT to generate the basis data as a table via the following prompts:

  • retrieve the labels from the four charts by country and value in a table
  • consolidate the values in a matrix table by label country and value
The first step generated 4 tables, which were consolidated in a matrix table in the second step. Frankly, the data generated in the first step should have been enough because using the matrix table required an additional step in DAX.

Here is the data imported in Power BI as the Industries query:

let
    Source = #table({"Label","Australia","Canada","U.S.","Japan"}
, {
 {"Credit card","67","64","66","68"}
, {"Online retail","55","57","48","53"}
, {"Banking","58","53","57","48"}
, {"Mobile phone","62","55","44","48"}
, {"Social media","74","72","62","47"}
, {"Search engine","66","64","56","42"}
, {"Government","52","52","58","39"}
, {"Health insurance","44","48","50","36"}
, {"Media","52","50","39","23"}
, {"Retail store","44","40","33","23"}
, {"Car manufacturing","29","29","26","20"}
, {"Airline/hotel","35","37","29","16"}
, {"Branded manufacturing","36","33","25","16"}
, {"Loyalty program","45","41","32","12"}
, {"Cable","40","39","29","9"}
}
),
    #"Changed Types" = Table.TransformColumnTypes(Source,{{"Australia", Int64.Type}, {"Canada", Int64.Type}, {"U.S.", Number.Type}, {"Japan", Number.Type}})
in
    #"Changed Types"

Transforming (unpivoting) the matrix to a table with the values by country:

IndustriesT = UNION (
    SUMMARIZECOLUMNS(
     Industries[Label]
     , Industries[Australia]
     , "Country", "Australia"
    )
    , SUMMARIZECOLUMNS(
     Industries[Label]
     , Industries[Canada]
     , "Country", "Canada"
    )
    , SUMMARIZECOLUMNS(
     Industries[Label]
     , Industries[U.S.]
     , "Country", "U.S."
    )
    ,  SUMMARIZECOLUMNS(
     Industries[Label]
     , Industries[Japan]
     , "Country", "Japan"
    )
)

Notes:
The slopechart from MAQ Software requires several R language libraries to be installed (see how to install the R language and optionally the RStudio). Run the following scripts, then reopen Power BI Desktop and enable running visual's scripts.

install.packages("XML")
install.packages("htmlwidgets")
install.packages("ggplot2")
install.packages("plotly")

Happy (de)coding!

Related Posts Plugin for WordPress, Blogger...

About Me

My photo
Koeln, NRW, Germany
IT Professional with more than 25 years experience in IT in the area of full life-cycle of Web/Desktop/Database Applications Development, Software Engineering, Consultancy, Data Management, Data Quality, Data Migrations, Reporting, ERP implementations & support, Team/Project/IT Management, etc.